Biologic Therapy Market Information: By Product and Geography - Global Forecast till 2025
17 Jun 2022
VaccineGene TherapyAntibodyCell TherapyCollaborate
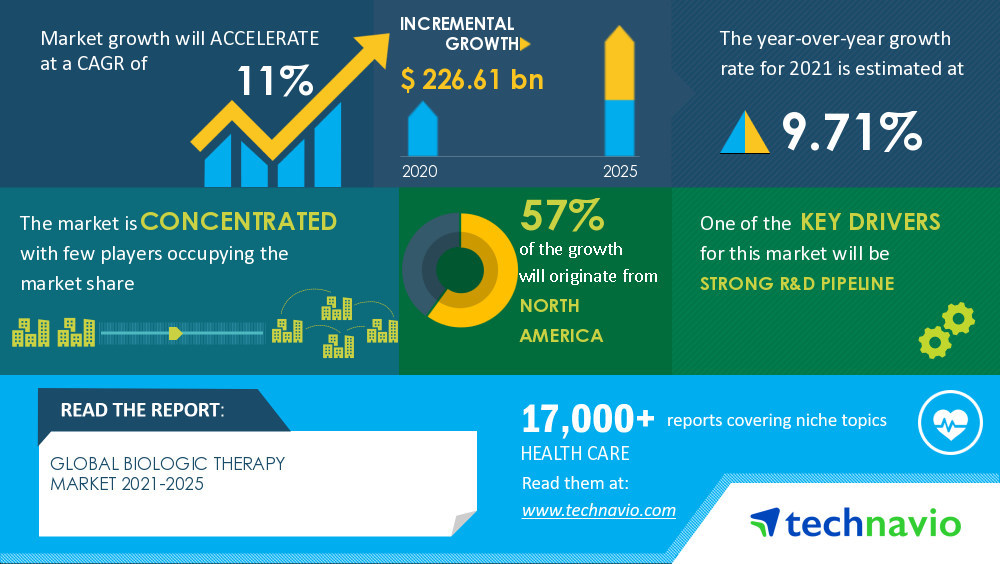
NEW YORK, June 17, 2022 /PRNewswire/ -- One of the key factors driving the
Biologic Therapy Market growth is the
strong R&D pipeline. The efficiency of biologics in the treatment of severe infections, malignancies, and immunological and hormonal disorders is encouraging manufacturers to invest in R&D for the development of biologics.
For instance, monoclonal antibodies constitute one of the fastest-growing segments amongst biological therapies. To date, 88 monoclonal antibodies have been approved for different indications. Some of the examples are ICT-107 for glioblastoma, VGX-3100 for cervical cancer, NeuVax for breast cancer, NexVax2 for celiac disease, CRS-207 for pancreatic cancer, PEV7 for recurrent vulvovaginal candidiasis, and GI-4000 for pancreatic cancer. Similar is the case of biologics meant to be used as vaccines and therapeutic proteins, the pipeline of vendors like AbbVie, Amgen, Johnson & Johnson, and F. Hoffmann-La Roche clearly indicate huge investments in R&D. Apart from manufacturers that are actively involved in research on biologics, many research institutes are also engaged in developing novel biologics through industrial collaborations.
Preview
Source: PRNewswire
Technavio has announced its latest market research report titled Biologic Therapeutics Market by Product and Geography - Forecast and Analysis 2021-2025
Get more information on Macro & Micro Economic Factor Analysis, Statistical Tools, and Trend Projection at Affordable Pricing options.
Learn More
The Biologic Therapy Market value is set to
grow by USD 226.61 billion, progressing at a CAGR of 11% from 2020 to 2025, as per the latest report by Technavio. Moreover, the market is segmented by
product (antibody therapeutics, vaccines, cell therapy, gene therapy, and other therapies) and geography (North America, Europe, Asia, and ROW).
Biologic Therapy Market 2021-2025: Segmentation
Product
Vaccines
Other Therapies
The biologic therapy market share growth by antibody therapeutics will be significant during the forecast period. Monoclonal antibodies are amongst the most widely sold biologics and are even referred to as the future of medicine.
Monoclonal antibodies are cloned from single-parent cells and are designed to recognize and bind to specific receptors on the surface of the cells. This specificity in action makes monoclonal antibodies more effective than conventional treatments for immunological and chronic ailments like cancer. Owing to these factors, it is expected that the global biologic therapy market will grow during the forecast period.
Geography
North America
Europe
Asia
ROW
57% of the market's growth will originate from North America during the forecast period. The US is the key market for biologic therapy in North America.
Market growth in this region will be slower than the growth of the market in the Asia region. One of the reasons for market growth in the Americas is the increased incidence of chronic diseases.
The rise in the prevalence of major health disorders is mainly due to lifestyle changes and increased consumption of alcohol and tobacco in the US. However, market growth is expected to be only gradual due to the patent expiry of major biologics present in the market.
Biologic Therapy Market 2021-2025: Scope
Biologic Therapy Market size
Biologic Therapy Market trends
Biologic Therapy Market analysis
High cost of biologics is one of the key challenges hindering the biologic therapy market growth. Biologics can be used for the treatment of several types of malignancies, hormonal imbalances, and autoimmune conditions, but they are expensive, which makes them beyond the reach of the economically underprivileged.
The total manufacturing costs, which include the costs related to the clinical trials associated with biologics, account for vendors offering these products at high costs. The development of a biological molecule requires a separate living organism.
Though bacterial production is not that costly, the production of therapeutic agents like monoclonal antibodies and vaccines becomes costly as they involve animal handling. The immunization of the animal and other procedures related to the production of antibodies and vaccines increases the cost of that product. Due to the high price of biologic therapy, many patients are unable to access this effective therapy, and this will remain a major challenge for the market during the forecast period.
Biologic Therapy Market 2021-2025: Vendor Analysis
The report analyzes the market's competitive landscape and offers information on several market vendors, including:
Merck and Co. Inc.
The biologic therapy market is
concentrated and the vendors are deploying growth strategies such as
partnering with research organizations and hospitals for R&D to compete in the market.
Biologic Therapy Market 2021-2025: Key Highlights
CAGR of the market during the forecast period 2021-2025
Detailed information on factors that will assist biologic therapy market growth during the next five years
Estimation of the biologic therapy market size and its contribution to the parent market
Predictions on upcoming trends and changes in consumer behavior
The growth of the biologic therapy market
Analysis of the market's competitive landscape and detailed information on vendors
Comprehensive details of factors that will challenge the growth of biologic therapy market vendors
Related Reports:
Head and Neck Cancer Diagnostics Market by Diagnostic Methods and Geography - Forecast and Analysis 2020-2024: The head and neck cancer diagnostics market size has the potential to grow by USD 3.41 billion during 2020-2024. The market's growth momentum will accelerate throughout the forecast period.
Latest Exclusive Research Insights Here
Global Spine Biologics Market 2018-2022: The global spine biologics market size will grow by USD 418.72 million during 2018-2022. This industry research report provides a detailed analysis of the market based on product (bone grafts, BMP, BMAC, and others) and geography (the Americas, APAC, and EMEA).
Latest Exclusive Research Insights Here
Table of Contents:
1 Executive Summary
2 Market Landscape
2.1 Market ecosystem
Exhibit 01: Parent market
Exhibit 02: Market characteristics
2.2 Value chain analysis
3 Market Sizing
3.1 Market definition
Exhibit 03: Offerings of vendors included in the market definition
3.2 Market segment analysis
Exhibit 04: Market segments
3.3 Market size 2020
3.4 Market outlook: Forecast for 2020 - 2025
Exhibit 05: Global - Market size and forecast 2020 - 2025 ($ billion)
Exhibit 06: Global market: Year-over-year growth 2020 - 2025 (%)
3.5 Market by application
4 Five Forces Analysis
4.1 Five forces summary
Exhibit 07: Five forces analysis 2020 & 2025
4.2 Bargaining power of buyers
Exhibit 08: Bargaining power of buyers
4.3 Bargaining power of suppliers
Exhibit 09: Bargaining power of suppliers
4.4 Threat of new entrants
Exhibit 10: Threat of new entrants
4.5 Threat of substitutes
Exhibit 11: Threat of substitutes
4.6 Threat of rivalry
Exhibit 12: Threat of rivalry
4.7 Market condition
Exhibit 13: Market condition - Five forces 2020
5 Market Segmentation by Product
5.1 Market segments
Exhibit 14: Product - Market share 2020-2025 (%)
5.2 Comparison by Product
Exhibit 15: Comparison by Product
5.3 Antibody therapeutics - Market size and forecast 2020-2025
Exhibit 16: Antibody therapeutics - Market size and forecast 2020-2025 ($ billion)
Exhibit 17: Sales of major monoclonal antibodies 2018-2020 ($ million)
Exhibit 18: Antibody therapeutics - Year-over-year growth 2020-2025 (%)
5.4 Vaccines - Market size and forecast 2020-2025
Exhibit 19: Vaccines - Market size and forecast 2020-2025 ($ billion)
Exhibit 20: Vendors offering vaccines
Exhibit 21: Vaccines - Year-over-year growth 2020-2025 (%)
5.5 Cell therapy - Market size and forecast 2020-2025
Exhibit 22: Cell therapy - Market size and forecast 2020-2025 ($ billion)
Exhibit 23: Cell therapy - Year-over-year growth 2020-2025 (%)
5.6 Gene therapy - Market size and forecast 2020-2025
Exhibit 24: Gene therapy - Market size and forecast 2020-2025 ($ billion)
Exhibit 25: Gene therapy - Year-over-year growth 2020-2025 (%)
5.7 Other therapies - Market size and forecast 2020-2025
Exhibit 26: Other therapies - Market size and forecast 2020-2025 ($ billion)
Exhibit 27: Other therapies - Year-over-year growth 2020-2025 (%)
5.8 Market opportunity by Product
Exhibit 28: Market opportunity by Product
6 Customer landscape
7 Geographic Landscape
7.1 Geographic segmentation
Exhibit 30: Market share by geography 2020-2025 (%)
7.2 Geographic comparison
Exhibit 31: Geographic comparison
7.3 North America - Market size and forecast 2020-2025
Exhibit 32: North America - Market size and forecast 2020-2025 ($ billion)
Exhibit 33: North America - Year-over-year growth 2020-2025 (%)
7.4 Europe - Market size and forecast 2020-2025
Exhibit 34: Europe - Market size and forecast 2020-2025 ($ billion)
Exhibit 35: Europe - Year-over-year growth 2020-2025 (%)
7.5 Asia - Market size and forecast 2020-2025
Exhibit 36: Asia - Market size and forecast 2020-2025 ($ billion)
Exhibit 37: Asia - Year-over-year growth 2020-2025 (%)
7.6 ROW - Market size and forecast 2020-2025
Exhibit 38: ROW - Market size and forecast 2020-2025 ($ billion)
Exhibit 39: ROW - Year-over-year growth 2020-2025 (%)
7.7 Key leading countries
Exhibit 40: Key leading countries
7.8 Market opportunity by geography
Exhibit 41: Market opportunity by geography ($ billion)
8 Drivers, Challenges, and Trends
8.1 Market drivers
8.2 Market challenges
Exhibit 43: Impact of drivers and challenges
8.3 Market trends
9 Vendor Landscape
9.1 Overview
Exhibit 44: Vendor landscape
9.2 Landscape disruption
Exhibit 45: Landscape disruption
Exhibit 46: Industry risks
10 Vendor Analysis
10.1 Vendors covered
Exhibit 47: Vendors covered
10.2 Market positioning of vendors
Exhibit 48: Market positioning of vendors
10.3 AbbVie Inc.
Exhibit 49: AbbVie Inc. - Overview
Exhibit 50: AbbVie Inc. - Product and service
Exhibit 51: AbbVie Inc. – Key news
Exhibit 52: AbbVie Inc. - Key offerings
10.4 AstraZeneca Plc
Exhibit 53: AstraZeneca Plc - Overview
Exhibit 54: AstraZeneca Plc - Product and service
Exhibit 55: AstraZeneca Plc – Key news
Exhibit 56: AstraZeneca Plc - Key offerings
Exhibit 57: Bristol-Myers Squibb Co. - Overview
Exhibit 58: Bristol-Myers Squibb Co. - Product and service
Exhibit 59: Bristol-Myers Squibb Co. – Key news
Exhibit 60: Bristol-Myers Squibb Co. - Key offerings
Exhibit 61: F. Hoffmann-La Roche Ltd. - Overview
Exhibit 62: F. Hoffmann-La Roche Ltd. - Business segments
Exhibit 63: F. Hoffmann-La Roche Ltd. – Key news
Exhibit 64: F. Hoffmann-La Roche Ltd. - Key offerings
Exhibit 65: F. Hoffmann-La Roche Ltd. - Segment focus
10.7 GlaxoSmithKline Plc
Exhibit 66: GlaxoSmithKline Plc - Overview
Exhibit 67: GlaxoSmithKline Plc - Business segments
Exhibit 68: GlaxoSmithKline Plc – Key news
Exhibit 69: GlaxoSmithKline Plc - Key offerings
Exhibit 70: GlaxoSmithKline Plc - Segment focus
Exhibit 71: Johnson and Johnson Inc. - Overview
Exhibit 72: Johnson and Johnson Inc. - Business segments
Exhibit 73: Johnson and Johnson Inc. – Key news
Exhibit 74: Johnson and Johnson Inc. - Key offerings
Exhibit 75: Johnson and Johnson Inc. - Segment focus
10.9 Merck and Co. Inc.
Exhibit 76: Merck and Co. Inc. - Overview
Exhibit 77: Merck and Co. Inc. - Business segments
Exhibit 78: Merck and Co. Inc. – Key news
Exhibit 79: Merck and Co. Inc. - Key offerings
Exhibit 80: Merck and Co. Inc. - Segment focus
10.10 Novartis AG
Exhibit 81: Novartis AG - Overview
Exhibit 82: Novartis AG - Business segments
Exhibit 83: Novartis AG – Key news
Exhibit 84: Novartis AG - Key offerings
Exhibit 85: Novartis AG - Segment focus
10.11 Pfizer Inc.
Exhibit 86: Pfizer Inc. - Overview
Exhibit 87: Pfizer Inc. - Business segments
Exhibit 88: Pfizer Inc. – Key news
Exhibit 89: Pfizer Inc. - Key offerings
10.12 Sanofi SA
Exhibit 90: Sanofi SA - Overview
Exhibit 91: Sanofi SA - Business segments
Exhibit 92: Sanofi SA – Key news
Exhibit 93: Sanofi SA - Key offerings
Exhibit 94: Sanofi SA - Segment focus
11.1 Scope of the report
11.2 Currency conversion rates for US$
Exhibit 95: Currency conversion rates for US$
11.3 Research methodology
Exhibit 96: Research Methodology
Exhibit 97: Validation techniques employed for market sizing
Exhibit 98: Information sources
11.4 List of abbreviations
Exhibit 99: List of abbreviations
About Us
Technavio is a leading global technology research and advisory company. Their research and analysis focus on emerging market trends and provides actionable insights to help businesses identify market opportunities and develop effective strategies to optimize their market positions. With over 500 specialized analysts, Technavio's report library consists of more than 17,000 reports and counting, covering 800 technologies, spanning across 50 countries. Their client base consists of enterprises of all sizes, including more than 100 Fortune 500 companies. This growing client base relies on Technavio's comprehensive coverage, extensive research, and actionable market insights to identify opportunities in existing and potential markets and assess their competitive positions within changing market scenarios.
Contact
Technavio Research
Jesse Maida
US: +1 844 364 1100
UK: +44 203 893 3200
Email: [email protected]
Website: www.technavio.com/
SOURCE Technavio
For more details,please visit the original website
The content of the article does not represent any opinions of Synapse and its affiliated companies. If there is any copyright infringement or error, please contact us, and we will deal with it within 24 hours.
Organizations
Indications
Targets
-Hot reports


Get started for free today!
Accelerate Strategic R&D decision making with Synapse, PatSnap’s AI-powered Connected Innovation Intelligence Platform Built for Life Sciences Professionals.
Start your data trial now!
Synapse data is also accessible to external entities via APIs or data packages. Leverages most recent intelligence information, enabling fullest potential.