Intrauterine Contraceptive Devices (IUD) market 2023-2027: 5-Year (2017-2021) Historic Industry Size & Analysis of 15 Vendors and 7 Countries - Technavio
03 Dec 2022
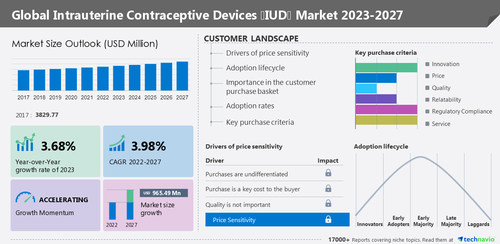
NEW YORK, Dec. 3, 2022 /PRNewswire/ -- The intrauterine contraceptive devices (IUD) market size is forecast to
grow by USD 965.49 million from 2022 to 2027, with an accelerated CAGR of 3.98%, according to the recent market study by Technavio. This report also offers a
5-year historical (2017-2021) data projection of market size, segmentation, and region.
Discover some insights on market size before buying the full report.
Request a free sample report.
Continue Reading
Preview
Source: PRNewswire
Technavio has announced its latest market research report titled Global Intrauterine Contraceptive Devices (IUD) Market 2023-2027
Qualitative and quantitative analysis of vendors has been conducted to help clients understand the wider business environment as well as the strengths and weaknesses of key market players. Data is qualitatively analyzed to categorize vendors as pure play, category-focused, industry-focused, and diversified; it is quantitatively analyzed to categorize vendors as dominant, leading, strong, tentative, and weak. The
Bargaining Power of Buyers & Suppliers and the
Threat of New Entrants, Rivalry, and Substitutes have also been analyzed and rated between
LOW-HIGH to provide a holistic view of market favorability.
Find Technavio's Exclusive Analysis of Price Sensitivity, Adoption Lifecycle, Customer Purchase Basket, Adoption Rates, and Purchase Criteria
One of the core components of the
customer landscape is
price sensitivity, an analysis of which will help companies refine
marketing strategies to gain a competitive advantage.
Another key aspect is price sensitivity drivers (
purchases are undifferentiated, the purchase is a key cost to buyers, and quality is not important), which range between
LOW and HIGH.
Furthermore, market adoption rates for all regions have been covered.
The intrauterine contraceptive devices (IUD) market report also offers information on the criticality of inputs, R&D, CAPEX, technology, and products of 15 vendors listed Below –
Durbin PLC
EUROGINE SL
Gima Spa
Krishco Medical Products Pvt. Ltd.
Melbea Innovations Ltd.
Prosan International BV
SMB Corp. of India
Download a sample report
Chart & Data Table on 5-Year Historic (2017-2021) Market Size, Comparative Analysis of Segments, and Y-O-Y Growth of intrauterine contraceptive devices (IUD) market
The market is segmented by
type (hormonal intrauterine device and copper intrauterine device) and end-user (hospitals, gynecology clinics, and others).
Based on
type, the hormonal intrauterine device
segment became the market's largest segment
in 2022.
Hormonal intrauterine devices decrease the risk of pelvic inflammatory disease (PID) and tubal pregnancies and help in treating symptoms such as polycystic ovary syndrome (PCOS) and endometriosis.
Hormonal intrauterine devices are more effective in preventing pregnancies when compared with other contraception devices. They are superior to copper intrauterine devices and pose fewer complications and risks.
To procure the data -
Buy report!
The increasing number of unplanned pregnancies and unwanted abortions is the key factor driving the global intrauterine contraceptive devices (IUD) market growth.
The growing number of unplanned pregnancies is expected to contribute to the growth of the global intrauterine contraceptive devices (IUD) market. Unintended pregnancies are one of the most pressing public health problems and a significant issue in global reproductive healthcare, imposing a substantial socioeconomic burden on society and individuals. According to WHO, in developing countries, almost half of the pregnancies among adolescent girls aged 15-19 years are unplanned. The adoption of contraceptive methods can lower the rate of such pregnancies.
Chart & Data Table on Historical Market Size (2017-2021, Historic Industry Size & Analysis of 15 Vendors and 7 Countries
The market is segmented by region
(North America, Europe, APAC, and the Rest of World). An analysis of key leading countries has been included.
North America, will account for 33% of the market's growth during the forecast period. The US leads the intrauterine contraceptive devices (IUD) market in North America. The presence of local market players, supportive government initiatives, high awareness, and technological innovations such as postpartum and reusable IUDs drive market growth in the US.
According to the Centers for Disease Control and Prevention (CDC), almost half of pregnancies in the US are unintended. Hence, the country experiences a high adoption of intrauterine devices among women.
For Insights on the market dynamics & segmentations,
VIEW A PDF SAMPLE !
Related Reports -
Emergency Contraceptive Pills Market by Distribution Channel and Geography – Forecast and Analysis 2021-2025: The emergency contraceptive pills market size is forecast to grow up to USD 75.56 million at a CAGR of 1.64% during 2020-2025.
Female Contraceptive Market by Distribution Channel, Product, and Geography – Forecast and Analysis 2023-2027: The female contraceptive market is forecast to grow at a
CAGR of 5.32% between 2022 and 2027. The size of the market is forecast to increase by
USD 5,.22 million.
Register for a free trial today and gain instant access to 17,000+ market research
reports.
Technavio's SUBSCRIPTION platform
Table of Contents:
1 Executive Summary
1.1 Market Overview
Exhibit 01: Executive Summary – Chart on Market Overview
Exhibit 02: Executive Summary – Data Table on Market Overview
Exhibit 03: Executive Summary – Chart on Global Market Characteristics
Exhibit 04: Executive Summary – Chart on Market by Geography
Exhibit 05: Executive Summary – Chart on Market Segmentation by Type
Exhibit 06: Executive Summary – Chart on Market Segmentation by End-user
Exhibit 07: Executive Summary – Chart on Incremental Growth
Exhibit 08: Executive Summary – Data Table on Incremental Growth
Exhibit 09: Executive Summary – Chart on Vendor Market Positioning
2 Market Landscape
2.1 Market ecosystem
Exhibit 10: Parent market
Exhibit 11: Market Characteristics
3 Market Sizing
3.1 Market definition
Exhibit 12: Offerings of vendors included in the market definition
3.2 Market segment analysis
Exhibit 13: Market segments
3.3 Market size 2022
3.4 Market outlook: Forecast for 2022-2027
Exhibit 14: Chart on Global - Market size and forecast 2022-2027 ($ million)
Exhibit 15: Data Table on Global - Market size and forecast 2022-2027 ($ million)
Exhibit 16: Chart on Global Market: Year-over-year growth 2022-2027 (%)
Exhibit 17: Data Table on Global Market: Year-over-year growth 2022-2027 (%)
4 Historic Market Size
4.1 Global intrauterine contraceptive devices (IUD) market 2017 - 2021
Exhibit 18: Historic Market Size – Data Table on Global intrauterine contraceptive devices (IUD) market 2017 - 2021 ($ million)
4.2 Type Segment Analysis 2017 - 2021
Exhibit 19: Historic Market Size – Type Segment 2017 - 2021 ($ million)
4.3 End-User Segment Analysis 2017 - 2021
Exhibit 20: Historic Market Size – End-User Segment 2017 - 2021 ($ million)
4.4 Geography Segment Analysis 2017 - 2021
Exhibit 21: Historic Market Size – Geography Segment 2017 - 2021 ($ million)
4.5 Country Segment Analysis 2017 - 2021
Exhibit 22: Historic Market Size – Country Segment 2017 - 2021 ($ million)
5 Five Forces Analysis
5.1 Five forces summary
Exhibit 23: Five forces analysis - Comparison between 2022 and 2027
5.2 Bargaining power of buyers
Exhibit 24: Chart on Bargaining power of buyers – Impact of key factors 2022 and 2027
5.3 Bargaining power of suppliers
Exhibit 25: Bargaining power of suppliers – Impact of key factors in 2022 and 2027
5.4 Threat of new entrants
Exhibit 26: Threat of new entrants – Impact of key factors in 2022 and 2027
5.5 Threat of substitutes
Exhibit 27: Threat of substitutes – Impact of key factors in 2022 and 2027
5.6 Threat of rivalry
Exhibit 28: Threat of rivalry – Impact of key factors in 2022 and 2027
5.7 Market condition
Exhibit 29: Chart on Market condition - Five forces 2022 and 2027
6 Market Segmentation by Type
6.1 Market segments
Exhibit 30: Chart on Type - Market share 2022-2027 (%)
Exhibit 31: Data Table on Type - Market share 2022-2027 (%)
6.2 Comparison by Type
Exhibit 32: Chart on Comparison by Type
Exhibit 33: Data Table on Comparison by Type
6.3 Hormonal intrauterine device - Market size and forecast 2022-2027
Exhibit 34: Chart on Hormonal intrauterine device - Market size and forecast 2022-2027 ($ million)
Exhibit 35: Data Table on Hormonal intrauterine device - Market size and forecast 2022-2027 ($ million)
Exhibit 36: Chart on Hormonal intrauterine device - Year-over-year growth 2022-2027 (%)
Exhibit 37: Data Table on Hormonal intrauterine device - Year-over-year growth 2022-2027 (%)
6.4 Copper intrauterine device - Market size and forecast 2022-2027
Exhibit 38: Chart on Copper intrauterine device - Market size and forecast 2022-2027 ($ million)
Exhibit 39: Data Table on Copper intrauterine device - Market size and forecast 2022-2027 ($ million)
Exhibit 40: Chart on Copper intrauterine device - Year-over-year growth 2022-2027 (%)
Exhibit 41: Data Table on Copper intrauterine device - Year-over-year growth 2022-2027 (%)
6.5 Market opportunity by Type
Exhibit 42: Market opportunity by Type ($ million)
7 Market Segmentation by End-user
7.1 Market segments
Exhibit 43: Chart on End-user - Market share 2022-2027 (%)
Exhibit 44: Data Table on End-user - Market share 2022-2027 (%)
7.2 Comparison by End-user
Exhibit 45: Chart on Comparison by End-user
Exhibit 46: Data Table on Comparison by End-user
7.3 Hospitals - Market size and forecast 2022-2027
Exhibit 47: Chart on Hospitals - Market size and forecast 2022-2027 ($ million)
Exhibit 48: Data Table on Hospitals - Market size and forecast 2022-2027 ($ million)
Exhibit 49: Chart on Hospitals - Year-over-year growth 2022-2027 (%)
Exhibit 50: Data Table on Hospitals - Year-over-year growth 2022-2027 (%)
7.4 Gynecology clinics - Market size and forecast 2022-2027
Exhibit 51: Chart on Gynecology clinics - Market size and forecast 2022-2027 ($ million)
Exhibit 52: Data Table on Gynecology clinics - Market size and forecast 2022-2027 ($ million)
Exhibit 53: Chart on Gynecology clinics - Year-over-year growth 2022-2027 (%)
Exhibit 54: Data Table on Gynecology clinics - Year-over-year growth 2022-2027 (%)
7.5 Others - Market size and forecast 2022-2027
Exhibit 55: Chart on Others - Market size and forecast 2022-2027 ($ million)
Exhibit 56: Data Table on Others - Market size and forecast 2022-2027 ($ million)
Exhibit 57: Chart on Others - Year-over-year growth 2022-2027 (%)
Exhibit 58: Data Table on Others - Year-over-year growth 2022-2027 (%)
7.6 Market opportunity by End-user
Exhibit 59: Market opportunity by End-user ($ million)
8 Customer Landscape
8.1 Customer landscape overview
Exhibit 60: Analysis of price sensitivity, lifecycle, customer purchase basket, adoption rates, and purchase criteria
9 Geographic Landscape
9.1 Geographic segmentation
Exhibit 61: Chart on Market share by geography 2022-2027 (%)
Exhibit 62: Data Table on Market share by geography 2022-2027 (%)
9.2 Geographic comparison
Exhibit 63: Chart on Geographic comparison
Exhibit 64: Data Table on Geographic comparison
9.3 North America - Market size and forecast 2022-2027
Exhibit 65: Chart on North America - Market size and forecast 2022-2027 ($ million)
Exhibit 66: Data Table on North America - Market size and forecast 2022-2027 ($ million)
Exhibit 67: Chart on North America - Year-over-year growth 2022-2027 (%)
Exhibit 68: Data Table on North America - Year-over-year growth 2022-2027 (%)
9.4 Europe - Market size and forecast 2022-2027
Exhibit 69: Chart on Europe - Market size and forecast 2022-2027 ($ million)
Exhibit 70: Data Table on Europe - Market size and forecast 2022-2027 ($ million)
Exhibit 71: Chart on Europe - Year-over-year growth 2022-2027 (%)
Exhibit 72: Data Table on Europe - Year-over-year growth 2022-2027 (%)
9.5 APAC - Market size and forecast 2022-2027
Exhibit 73: Chart on APAC - Market size and forecast 2022-2027 ($ million)
Exhibit 74: Data Table on APAC - Market size and forecast 2022-2027 ($ million)
Exhibit 75: Chart on APAC - Year-over-year growth 2022-2027 (%)
Exhibit 76: Data Table on APAC - Year-over-year growth 2022-2027 (%)
9.6 Rest of World (ROW) - Market size and forecast 2022-2027
Exhibit 77: Chart on Rest of World (ROW) - Market size and forecast 2022-2027 ($ million)
Exhibit 78: Data Table on Rest of World (ROW) - Market size and forecast 2022-2027 ($ million)
Exhibit 79: Chart on Rest of World (ROW) - Year-over-year growth 2022-2027 (%)
Exhibit 80: Data Table on Rest of World (ROW) - Year-over-year growth 2022-2027 (%)
9.7 US - Market size and forecast 2022-2027
Exhibit 81: Chart on US - Market size and forecast 2022-2027 ($ million)
Exhibit 82: Data Table on US - Market size and forecast 2022-2027 ($ million)
Exhibit 83: Chart on US - Year-over-year growth 2022-2027 (%)
Exhibit 84: Data Table on US - Year-over-year growth 2022-2027 (%)
9.8 Germany - Market size and forecast 2022-2027
Exhibit 85: Chart on Germany - Market size and forecast 2022-2027 ($ million)
Exhibit 86: Data Table on Germany - Market size and forecast 2022-2027 ($ million)
Exhibit 87: Chart on Germany - Year-over-year growth 2022-2027 (%)
Exhibit 88: Data Table on Germany - Year-over-year growth 2022-2027 (%)
9.9 China - Market size and forecast 2022-2027
Exhibit 89: Chart on China - Market size and forecast 2022-2027 ($ million)
Exhibit 90: Data Table on China - Market size and forecast 2022-2027 ($ million)
Exhibit 91: Chart on China - Year-over-year growth 2022-2027 (%) 105
Exhibit 92: Data Table on China - Year-over-year growth 2022-2027 (%)
9.10 France - Market size and forecast 2022-2027
Exhibit 93: Chart on France - Market size and forecast 2022-2027 ($ million)
Exhibit 94: Data Table on France - Market size and forecast 2022-2027 ($ million)
Exhibit 95: Chart on France - Year-over-year growth 2022-2027 (%)
Exhibit 96: Data Table on France - Year-over-year growth 2022-2027 (%)
9.11 Japan - Market size and forecast 2022-2027
Exhibit 97: Chart on Japan - Market size and forecast 2022-2027 ($ million)
Exhibit 98: Data Table on Japan - Market size and forecast 2022-2027 ($ million)
Exhibit 99: Chart on Japan - Year-over-year growth 2022-2027 (%)
Exhibit 100: Data Table on Japan - Year-over-year growth 2022-2027 (%)
9.12 Market opportunity by geography
Exhibit 101: Market opportunity by geography ($ million)
10 Drivers, Challenges, and Trends
10.1 Market drivers
10.2 Market challenges
10.3 Impact of drivers and challenges
Exhibit 102: Impact of drivers and challenges in 2022 and 2027
10.4 Market trends
11 Vendor Landscape
11.1 Overview
11.2 Vendor landscape
Exhibit 103: Overview on Criticality of inputs and Factors of differentiation
11.3 Landscape disruption
Exhibit 104: Overview on factors of disruption
11.4 Industry risks
Exhibit 105: Impact of key risks on business
12 Vendor Analysis
12.1 Vendors covered
Exhibit 106: Vendors covered
12.2 Market positioning of vendors
Exhibit 107: Matrix on vendor position and classification
12.3 AbbVie Inc.
Exhibit 108: AbbVie Inc. - Overview
Exhibit 109: AbbVie Inc. - Product / Service
Exhibit 110: AbbVie Inc. - Key offerings
12.4 Bayer AG
Exhibit 111: Bayer AG - Overview
Exhibit 112: Bayer AG - Business segments
Exhibit 113: Bayer AG - Key offerings
Exhibit 114: Bayer AG - Segment focus
12.5 DKT International
Exhibit 115: DKT International - Overview
Exhibit 116: DKT International - Product / Service
Exhibit 117: DKT International - Key offerings
12.6 EUROGINE SL
Exhibit 118: EUROGINE SL - Overview
Exhibit 119: EUROGINE SL - Product / Service
Exhibit 120: EUROGINE SL - Key offerings
12.7 HLL Lifecare Ltd.
Exhibit 121: HLL Lifecare Ltd. - Overview
Exhibit 122: HLL Lifecare Ltd. - Product / Service
Exhibit 123: HLL Lifecare Ltd. - Key offerings
12.8 Krishco Medical Products Pvt. Ltd.
Exhibit 124: Krishco Medical Products Pvt. Ltd. - Overview
Exhibit 125: Krishco Medical Products Pvt. Ltd. - Product / Service
Exhibit 126: Krishco Medical Products Pvt. Ltd. - Key offerings
12.9 Laboratoire HRA Pharma SAS
Exhibit 127: Laboratoire HRA Pharma SAS - Overview
Exhibit 128: Laboratoire HRA Pharma SAS - Product / Service
Exhibit 129: Laboratoire HRA Pharma SAS - Key offerings
12.10 Melbea Innovations Ltd.
Exhibit 130: Melbea Innovations Ltd. - Overview
Exhibit 131: Melbea Innovations Ltd. - Product / Service
Exhibit 132: Melbea Innovations Ltd. - Key offerings
12.11 Ocon Medical Ltd.
Exhibit 133: Ocon Medical Ltd. - Overview
Exhibit 134: Ocon Medical Ltd. - Product / Service
Exhibit 135: Ocon Medical Ltd. - Key offerings
12.12 Pregna International Ltd
Exhibit 136: Pregna International Ltd - Overview
Exhibit 137: Pregna International Ltd - Product / Service
Exhibit 138: Pregna International Ltd - Key offerings
12.13 Prosan International BV
Exhibit 139: Prosan International BV - Overview
Exhibit 140: Prosan International BV - Product / Service
Exhibit 141: Prosan International BV - Key offerings
12.14 SMB Corp. of India
Exhibit: SMB Corp. of India - Overview
Exhibit 142: SMB Corp. of India - Product / Service
Exhibit 143: SMB Corp. of India - Key offerings
12.15 TESPRO LLC
Exhibit 144: TESPRO LLC - Overview
Exhibit 145: TESPRO LLC - Product / Service
Exhibit 146: TESPRO LLC - Key offerings
12.16 The Cooper Companies Inc.
Exhibit 147 : The Cooper Companies Inc. - Overview
Exhibit 148: The Cooper Companies Inc. - Business segments
Exhibit 149: The Cooper Companies Inc. - Key offerings
Exhibit 150: The Cooper Companies Inc. - Segment focus
12.17 TRIMEDIC SUPPLY NETWORK Ltd.
Exhibit 151: TRIMEDIC SUPPLY NETWORK Ltd. - Overview
Exhibit 152: TRIMEDIC SUPPLY NETWORK Ltd. - Product / Service
Exhibit 153: TRIMEDIC SUPPLY NETWORK Ltd. - Key offerings
13 Appendix
13.1 Scope of the report
13.2 Inclusions and exclusions checklist
Exhibit 154: Inclusions checklist
Exhibit 155 : Exclusions checklist
13.3 Currency conversion rates for US$
Exhibit 157: Currency conversion rates for US$
13.4 Research methodology
Exhibit 158: Research methodology
Exhibit 159: Validation techniques employed for market sizing
Exhibit 160: Information sources
13.5 List of abbreviations
Exhibit 161: List of abbreviations
About Us
Technavio is a leading global technology research and advisory company. Their research and analysis focus on emerging market trends and provide actionable insights to help businesses identify market opportunities and develop effective strategies to optimize their market positions. With over 500 specialized analysts, Technavio's report library consists of more than 17,000 reports and counting, covering 800 technologies, spanning 50 countries. Their client base consists of enterprises of all sizes, including more than 100 Fortune 500 companies. This growing client base relies on Technavio's comprehensive coverage, extensive research, and actionable market insights to identify opportunities in existing and potential markets and assess their competitive positions within changing market scenarios.
Contact
Technavio Research
Jesse Maida
US: +1 844 364 1100
UK: +44 203 893 3200
Email: [email protected]
Website: www.technavio.com
SOURCE Technavio
For more details,please visit the original website
The content of the article does not represent any opinions of Synapse and its affiliated companies. If there is any copyright infringement or error, please contact us, and we will deal with it within 24 hours.
Organizations
Targets
-Drugs
-Hot reports


Get started for free today!
Accelerate Strategic R&D decision making with Synapse, PatSnap’s AI-powered Connected Innovation Intelligence Platform Built for Life Sciences Professionals.
Start your data trial now!
Synapse data is also accessible to external entities via APIs or data packages. Leverages most recent intelligence information, enabling fullest potential.