The Pet Dental Health Market to grow at a CAGR of 6.02% from 2022 to 2027|Rise in the number of pet dental procedures is a major trend in the market - Technavio
25 Jul 2023
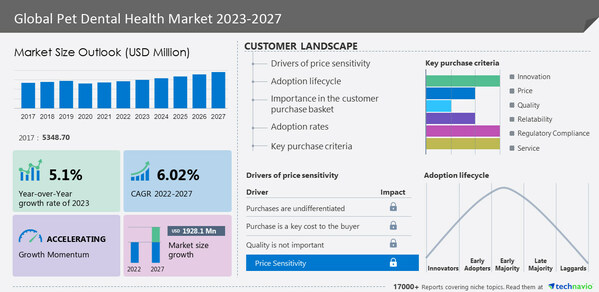
NEW YORK, July 24, 2023 /PRNewswire/ -- The
pet dental health market size is estimated to increase by
USD 1,928.1 million from 2022 to 2027, with a
CAGR of 6.02%, according to a recent market study by Technavio. This report also offers a 5-year historical (2017-2021) data projection of market size, segmentation, and region.
Discover some insights on market size before buying the full report -Request a sample report
Pet Dental Health Market 2023-2027 – Vendor Scope
Continue Reading
Preview
Source: PRNewswire
Technavio has announced its latest market research report titled Global Pet Dental Health Market
The pet dental health market report also offers information on the criticality of inputs, R&D, CAPEX, technology, and products of 15 vendors listed Below -
All4pets, AllAccem Inc., Animal Microbiome Analytics Inc., Ark Naturals Co., Bark Inc., Colgate Palmolive Co., Cosmos Corp., Dechra Pharmaceuticals Plc, Dentalaire International, ImRex Inc., Mars Inc., Nestle SA, PetIQ Inc., Petosan AS, Petsmile, Petzlife UK, Vetoquinol SA, Virbac Group, Zoetis Inc., and Central Garden and Pet Co.
Download a Sample
Report
Chart & Data Table on 5-Year Historic (2017-2021) Market Size, Comparative Analysis of Segments, and Y-O-Y Growth of Pet dental health market
Pet Dental Health Market 2023-2027: Segmentation
The market is segmented by
animal type (dogs, cats, and others), type (services and products), and geography (North America, Europe, APAC, South America, and Middle East and Africa).
The
services segment will account for a significant share of market growth during the forecast period. The various dental health services provided to pets, such as dental cleaning, check-ups, and treatments are included in this segment. Overall, health and well-being are the major concern in pets as for human beings. Furthermore, poor dental health can lead to a variety of health concerns such as gum disease, tooth decay, and infections. Hence, these factors are expected to drive segment growth during the forecast period.
North America is estimated to contribute 38% to the growth of the global market. The growth in the region is due to the expanding companion animal adoption and rising per capita animal healthcare and product expenditure among pet owners. Furthermore, the demand for these services is also increasing due to the awareness of pet health among pet owners and an increase in the frequency of dental treatments for pets. Hence, this awareness among pet owners is expected to drive market growth in the region during the forecast period.
To procure the data - Buy the report!
Pet Dental Health Market 2023-2027: –
Market Dynamics
Key Drivers
The high prevalence of pet dental diseases is a key factor driving market growth. The most frequent clinical condition found in cats and dogs is Periodontal disease. This can be avoided in pets by brushing their teeth. Furthermore, these diseases can cause serious health problems ranging from tooth loss to organ failure. As a result, the demand for various products such as dental cleaning, surgeries, dental treats, pet toothpaste, brush, and other materials is increasing. Hence, the rising frequency of a variety of dental health-related disorders in pets is expected to drive market growth during the forecast period.
Major Trends
The rise in the number of pet dental procedures is a major trend in the market. Pet owners are becoming aware of the link between oral health and overall pet health, due to which they are seeking veterinarian care to address dental issues in their pets. Furthermore, new instruments and techniques have been developed to clean and remove teeth, treat periodontal disease, and even perform root canals on animals. Hence, these rising procedures are expected to drive market growth during the forecast period.
Significant Challenges
The limited availability of qualified professionals in pet dental health is a major challenge restricting market growth. There is a shortage of veterinarians with specialized education and practical knowledge, which is important to offer superior dental treatment for animals. As a result, it increases the extended wait times for appointments. The qualified veterinarian is not available easily, and increased costs for pet care services. Hence, these factors are expected to restrict market growth during the forecast period.
For Insights on the market dynamics & segmentations VIEW PDF SAMPLE!
What are the key data covered in this Pet Dental Health Market report?
CAGR of the market during the forecast period
Detailed information on factors that will drive the growth of the pet dental health market between 2023 and 2027
Precise estimation of the size of the pet dental health market size and its contribution to the market in focus on the parent market
Accurate predictions about upcoming trends and changes in consumer behavior
Growth of the pet dental health market industry across North America, Europe, APAC, South America, and the Middle East and Africa
A thorough analysis of the market's competitive landscape and detailed information about vendors
Comprehensive analysis of factors that will challenge the growth of pet dental health market vendors
Gain instant access to 17,000+ market research reports.
Technavio SUBSCRIPTION platform
Related Reports
The
pet grooming products market size is estimated to grow at a CAGR of 5.85% between 2022 and 2027. The market size is forecast to increase by USD 6,989.14 million. Furthermore, this report extensively covers market segmentation by distribution channel (offline and online), product (pet shampoo and conditioner, pet brushes and combs, and others), and geography (North America, Europe, APAC, Middle East and Africa, and South America). The shifting preference toward natural and organic pet grooming products is the key factor driving the market growth during the forecast period.
The
chemical peel market size is projected to increase by USD 692.44 million and the market size is estimated to grow at a CAGR of 6.58% between 2022 and 2027. Furthermore, this report extensively covers market segmentation by end-user (hospital, recreation centers, and dermatology clinics), type (light peel, medium peel, and deep peel), and geography (North America, Europe, APAC, South America, and Middle East and Africa). Increasing demand for aesthetic procedures and technological advancement is the key factor driving the market growth during the forecast period.
Table of Contents
1 Executive Summary
1.1 Market overview
Exhibit 01: Executive Summary – Chart on Market Overview
Exhibit 02: Executive Summary – Data Table on Market Overview
Exhibit 03: Executive Summary – Chart on Global Market Characteristics
Exhibit 04: Executive Summary – Chart on Market by Geography
Exhibit 05: Executive Summary – Chart on Market Segmentation by Animal Type
Exhibit 06: Executive Summary – Chart on Market Segmentation by Type
Exhibit 07: Executive Summary – Chart on Incremental Growth
Exhibit 08: Executive Summary – Data Table on Incremental Growth
Exhibit 09: Executive Summary – Chart on Vendor Market Positioning
2 Market Landscape
2.1 Market ecosystem
Exhibit 10: Parent market
Exhibit 11: Market Characteristics
3 Market Sizing
3.1 Market definition
Exhibit 12: Offerings of vendors included in the market definition
3.2 Market segment analysis
Exhibit 13: Market segments
3.3 Market size 2022
3.4 Market outlook: Forecast for 2022-2027
Exhibit 14: Chart on Global - Market size and forecast 2022-2027 ($ million)
Exhibit 15: Data Table on Global - Market size and forecast 2022-2027 ($ million)
Exhibit 16: Chart on Global Market: Year-over-year growth 2022-2027 (%)
Exhibit 17: Data Table on Global Market: Year-over-year growth 2022-2027 (%)
4 Historic Market Size
4.1 Global pet dental health market 2017 - 2021
Exhibit 18: Historic Market Size – Data Table on global pet dental health market 2017 - 2021 ($ million)
4.2 Animal Type Segment Analysis 2017 - 2021
Exhibit 19: Historic Market Size – Animal Type Segment 2017 - 2021 ($ million)
4.3 Type Segment Analysis 2017 - 2021
Exhibit 20: Historic Market Size – Type Segment 2017 - 2021 ($ million)
4.4 Geography Segment Analysis 2017 - 2021
Exhibit 21: Historic Market Size – Geography Segment 2017 - 2021 ($ million)
4.5 Country Segment Analysis 2017 - 2021
Exhibit 22: Historic Market Size – Country Segment 2017 - 2021 ($ million)
5 Five Forces Analysis
5.1 Five forces summary
Exhibit 23: Five forces analysis - Comparison between 2022 and 2027
5.2 Bargaining power of buyers
Exhibit 24: Chart on Bargaining power of buyers – Impact of key factors 2022 and 2027
5.3 Bargaining power of suppliers
Exhibit 25: Bargaining power of suppliers – Impact of key factors in 2022 and 2027
5.4 Threat of new entrants
Exhibit 26: Threat of new entrants – Impact of key factors in 2022 and 2027
5.5 Threat of substitutes
Exhibit 27: Threat of substitutes – Impact of key factors in 2022 and 2027
5.6 Threat of rivalry
Exhibit 28: Threat of rivalry – Impact of key factors in 2022 and 2027
5.7 Market condition
Exhibit 29: Chart on Market condition - Five forces 2022 and 2027
6 Market Segmentation by Animal Type
6.1 Market segments
Exhibit 30: Chart on Animal Type - Market share 2022-2027 (%)
Exhibit 31: Data Table on Animal Type - Market share 2022-2027 (%)
6.2 Comparison by Animal Type
Exhibit 32: Chart on Comparison by Animal Type
Exhibit 33: Data Table on Comparison by Animal Type
6.3 Dogs - Market size and forecast 2022-2027
Exhibit 34: Chart on Dogs - Market size and forecast 2022-2027 ($ million)
Exhibit 35: Data Table on Dogs - Market size and forecast 2022-2027 ($ million)
Exhibit 36: Chart on Dogs - Year-over-year growth 2022-2027 (%)
Exhibit 37: Data Table on Dogs - Year-over-year growth 2022-2027 (%)
6.4 Cats - Market size and forecast 2022-2027
Exhibit 38: Chart on Cats - Market size and forecast 2022-2027 ($ million)
Exhibit 39: Data Table on Cats - Market size and forecast 2022-2027 ($ million)
Exhibit 40: Chart on Cats - Year-over-year growth 2022-2027 (%)
Exhibit 41: Data Table on Cats - Year-over-year growth 2022-2027 (%)
6.5 Others - Market size and forecast 2022-2027
Exhibit 42: Chart on Others - Market size and forecast 2022-2027 ($ million)
Exhibit 43: Data Table on Others - Market size and forecast 2022-2027 ($ million)
Exhibit 44: Chart on Others - Year-over-year growth 2022-2027 (%)
Exhibit 45: Data Table on Others - Year-over-year growth 2022-2027 (%)
6.6 Market opportunity by Animal Type
Exhibit 46: Market opportunity by Animal Type ($ million)
Exhibit 47: Data Table on Market opportunity by Animal Type ($ million)
7 Market Segmentation by Type
7.1 Market segments
Exhibit 48: Chart on Type - Market share 2022-2027 (%)
Exhibit 49: Data Table on Type - Market share 2022-2027 (%)
7.2 Comparison by Type
Exhibit 50: Chart on Comparison by Type
Exhibit 51: Data Table on Comparison by Type
7.3 Services - Market size and forecast 2022-2027
Exhibit 52: Chart on Services - Market size and forecast 2022-2027 ($ million)
Exhibit 53: Data Table on Services - Market size and forecast 2022-2027 ($ million)
Exhibit 54: Chart on Services - Year-over-year growth 2022-2027 (%)
Exhibit 55: Data Table on Services - Year-over-year growth 2022-2027 (%)
7.4 Product - Market size and forecast 2022-2027
Exhibit 56: Chart on Product - Market size and forecast 2022-2027 ($ million)
Exhibit 57: Data Table on Product - Market size and forecast 2022-2027 ($ million)
Exhibit 58: Chart on Product - Year-over-year growth 2022-2027 (%)
Exhibit 59: Data Table on Product - Year-over-year growth 2022-2027 (%)
7.5 Market opportunity by Type
Exhibit 60: Market opportunity by Type ($ million)
Exhibit 61: Data Table on Market opportunity by Type ($ million)
8 Customer Landscape
8.1 Customer landscape overview
Exhibit 62: Analysis of price sensitivity, lifecycle, customer purchase basket, adoption rates, and purchase criteria
9 Geographic Landscape
9.1 Geographic segmentation
Exhibit 63: Chart on Market share by geography 2022-2027 (%)
Exhibit 64: Data Table on Market share by geography 2022-2027 (%)
9.2 Geographic comparison
Exhibit 65: Chart on Geographic comparison
Exhibit 66: Data Table on Geographic comparison
9.3 North America - Market size and forecast 2022-2027
Exhibit 67: Chart on North America - Market size and forecast 2022-2027 ($ million)
Exhibit 68: Data Table on North America - Market size and forecast 2022-2027 ($ million)
Exhibit 69: Chart on North America - Year-over-year growth 2022-2027 (%)
Exhibit 70: Data Table on North America - Year-over-year growth 2022-2027 (%)
9.4 Europe - Market size and forecast 2022-2027
Exhibit 71: Chart on Europe - Market size and forecast 2022-2027 ($ million)
Exhibit 72: Data Table on Europe - Market size and forecast 2022-2027 ($ million)
Exhibit 73: Chart on Europe - Year-over-year growth 2022-2027 (%)
Exhibit 74: Data Table on Europe - Year-over-year growth 2022-2027 (%)
9.5 APAC - Market size and forecast 2022-2027
Exhibit 75: Chart on APAC - Market size and forecast 2022-2027 ($ million)
Exhibit 76: Data Table on APAC - Market size and forecast 2022-2027 ($ million)
Exhibit 77: Chart on APAC - Year-over-year growth 2022-2027 (%)
Exhibit 78: Data Table on APAC - Year-over-year growth 2022-2027 (%)
9.6 South America - Market size and forecast 2022-2027
Exhibit 79: Chart on South America - Market size and forecast 2022-2027 ($ million)
Exhibit 80: Data Table on South America - Market size and forecast 2022-2027 ($ million)
Exhibit 81: Chart on South America - Year-over-year growth 2022-2027 (%)
Exhibit 82: Data Table on South America - Year-over-year growth 2022-2027 (%)
9.7 Middle East and Africa - Market size and forecast 2022-2027
Exhibit 83: Chart on Middle East and Africa - Market size and forecast 2022-2027 ($ million)
Exhibit 84: Data Table on Middle East and Africa - Market size and forecast 2022-2027 ($ million)
Exhibit 85: Chart on Middle East and Africa - Year-over-year growth 2022-2027 (%)
Exhibit 86: Data Table on Middle East and Africa - Year-over-year growth 2022-2027 (%)
9.8 US - Market size and forecast 2022-2027
Exhibit 87: Chart on US - Market size and forecast 2022-2027 ($ million)
Exhibit 88: Data Table on US - Market size and forecast 2022-2027 ($ million)
Exhibit 89: Chart on US - Year-over-year growth 2022-2027 (%)
Exhibit 90: Data Table on US - Year-over-year growth 2022-2027 (%)
9.9 China - Market size and forecast 2022-2027
Exhibit 91: Chart on China - Market size and forecast 2022-2027 ($ million)
Exhibit 92: Data Table on China - Market size and forecast 2022-2027 ($ million)
Exhibit 93: Chart on China - Year-over-year growth 2022-2027 (%)
Exhibit 94: Data Table on China - Year-over-year growth 2022-2027 (%)
9.10 Germany - Market size and forecast 2022-2027
Exhibit 95: Chart on Germany - Market size and forecast 2022-2027 ($ million)
Exhibit 96: Data Table on Germany - Market size and forecast 2022-2027 ($ million)
Exhibit 97: Chart on Germany - Year-over-year growth 2022-2027 (%)
Exhibit 98: Data Table on Germany - Year-over-year growth 2022-2027 (%)
9.11 Canada - Market size and forecast 2022-2027
Exhibit 99: Chart on Canada - Market size and forecast 2022-2027 ($ million)
Exhibit 100: Data Table on Canada - Market size and forecast 2022-2027 ($ million)
Exhibit 101: Chart on Canada - Year-over-year growth 2022-2027 (%)
Exhibit 102: Data Table on Canada - Year-over-year growth 2022-2027 (%)
9.12 UK - Market size and forecast 2022-2027
Exhibit 103: Chart on UK - Market size and forecast 2022-2027 ($ million)
Exhibit 104: Data Table on UK - Market size and forecast 2022-2027 ($ million)
Exhibit 105: Chart on UK - Year-over-year growth 2022-2027 (%)
Exhibit 106: Data Table on UK - Year-over-year growth 2022-2027 (%)
9.13 Market opportunity by geography
Exhibit 107: Market opportunity by geography ($ million)
Exhibit 108: Data Tables on Market opportunity by geography ($ million)
10 Drivers, Challenges, and Trends
10.1 Market drivers
10.2 Market challenges
10.3 Impact of drivers and challenges
Exhibit 109: Impact of drivers and challenges in 2022 and 2027
10.4 Market trends
11 Vendor Landscape
11.1 Overview
11.2 Vendor landscape
Exhibit 110: Overview on Criticality of inputs and Factors of differentiation
11.3 Landscape disruption
Exhibit 111: Overview on factors of disruption
11.4 Industry risks
Exhibit 112: Impact of key risks on business
12 Vendor Analysis
12.1 Vendors covered
Exhibit 113: Vendors covered
12.2 Market positioning of vendors
Exhibit 114: Matrix on vendor position and classification
12.3 AllAccem Inc.
Exhibit 115: AllAccem Inc. - Overview
Exhibit 116: AllAccem Inc. - Product / Service
Exhibit 117: AllAccem Inc. - Key offerings
Exhibit 118: Animal Microbiome Analytics Inc. - Overview
Exhibit 119: Animal Microbiome Analytics Inc. - Product / Service
Exhibit 120: Animal Microbiome Analytics Inc. - Key offerings
12.5 Bark Inc.
Exhibit 121: Bark Inc. - Overview
Exhibit 122: Bark Inc. - Business segments
Exhibit 123: Bark Inc. - Key offerings
Exhibit 124: Bark Inc. - Segment focus
12.6 Central Garden and Pet Co.
Exhibit 125: Central Garden and Pet Co. - Overview
Exhibit 126: Central Garden and Pet Co. - Business segments
Exhibit 127: Central Garden and Pet Co. - Key offerings
Exhibit 128: Central Garden and Pet Co. - Segment focus
Exhibit 129: Colgate Palmolive Co. - Overview
Exhibit 130: Colgate Palmolive Co. - Business segments
Exhibit 131: Colgate Palmolive Co. - Key offerings
Exhibit 132: Colgate Palmolive Co. - Segment focus
Exhibit 133: Dechra Pharmaceuticals Plc - Overview
Exhibit 134: Dechra Pharmaceuticals Plc - Business segments
Exhibit 135: Dechra Pharmaceuticals Plc - Key offerings
Exhibit 136: Dechra Pharmaceuticals Plc - Segment focus
12.9 Dentalaire International
Exhibit 137: Dentalaire International - Overview
Exhibit 138: Dentalaire International - Product / Service
Exhibit 139: Dentalaire International - Key offerings
12.10 ImRex Inc.
Exhibit 140: ImRex Inc. - Overview
Exhibit 141: ImRex Inc. - Product / Service
Exhibit 142: ImRex Inc. - Key offerings
12.11 Mars Inc.
Exhibit 143: Mars Inc. - Overview
Exhibit 144: Mars Inc. - Product / Service
Exhibit 145: Mars Inc. - Key news
Exhibit 146: Mars Inc. - Key offerings
12.12 Nestle SA
Exhibit 147: Nestle SA - Overview
Exhibit 148: Nestle SA - Business segments
Exhibit 149: Nestle SA - Key news
Exhibit 150: Nestle SA - Key offerings
Exhibit 151: Nestle SA - Segment focus
12.13 PetIQ Inc.
Exhibit 152: PetIQ Inc. - Overview
Exhibit 153: PetIQ Inc. - Business segments
Exhibit 154: PetIQ Inc. - Key offerings
Exhibit 155: PetIQ Inc. - Segment focus
12.14 Petzlife UK
Exhibit 156: Petzlife UK - Overview
Exhibit 157: Petzlife UK - Product / Service
Exhibit 158: Petzlife UK - Key offerings
12.15 Vetoquinol SA
Exhibit 159: Vetoquinol SA - Overview
Exhibit 160: Vetoquinol SA - Business segments
Exhibit 161: Vetoquinol SA - Key news
Exhibit 162: Vetoquinol SA - Key offerings
Exhibit 163: Vetoquinol SA - Segment focus
12.16 Virbac Group
Exhibit 164: Virbac Group - Overview
Exhibit 165: Virbac Group - Business segments
Exhibit 166: Virbac Group - Key news
Exhibit 167: Virbac Group - Key offerings
Exhibit 168: Virbac Group - Segment focus
12.17 Zoetis Inc.
Exhibit 169: Zoetis Inc. - Overview
Exhibit 170: Zoetis Inc. - Business segments
Exhibit 171: Zoetis Inc. - Key news
Exhibit 172: Zoetis Inc. - Key offerings
Exhibit 173: Zoetis Inc. - Segment focus
13 Appendix
13.1 Scope of the report
13.2 Inclusions and exclusions checklist
Exhibit 174: Inclusions checklist
Exhibit 175: Exclusions checklist
13.3 Currency conversion rates for US$
Exhibit 176: Currency conversion rates for US$
13.4 Research methodology
Exhibit 177: Research methodology
Exhibit 178: Validation techniques employed for market sizing
Exhibit 179: Information sources
13.5 List of abbreviations
Exhibit 180: List of abbreviations
About Us
Technavio is a leading global technology research and advisory company. Their research and analysis focus on emerging market trends and provide actionable insights to help businesses identify market opportunities and develop effective strategies to optimize their market positions. With over 500 specialized analysts, Technavio's report library consists of more than 17,000 reports and counting, covering 800 technologies, spanning 50 countries. Their client base consists of enterprises of all sizes, including more than 100 Fortune 500 companies. This growing client base relies on Technavio's comprehensive coverage, extensive research, and actionable market insights to identify opportunities in existing and potential markets and assess their competitive positions within changing market scenarios.
Contact
Technavio Research
Jesse Maida
Media & Marketing Executive
US: +1 844 364 1100
UK: +44 203 893 3200
Email: [email protected]
Website: www.technavio.com
SOURCE Technavio
For more details,please visit the original website
The content of the article does not represent any opinions of Synapse and its affiliated companies. If there is any copyright infringement or error, please contact us, and we will deal with it within 24 hours.
Organizations
Indications
Targets
-Drugs
-Hot reports


Get started for free today!
Accelerate Strategic R&D decision making with Synapse, PatSnap’s AI-powered Connected Innovation Intelligence Platform Built for Life Sciences Professionals.
Start your data trial now!
Synapse data is also accessible to external entities via APIs or data packages. Leverages most recent intelligence information, enabling fullest potential.