Laboratory shaker market size to increase by USD 611.28 million; Analysis of major players as well as the key contributor region - Technavio
31 Jan 2023
NEW YORK, Jan. 30, 2023 /PRNewswire/ --
North America will account for 34% of the global Laboratory shaker market
Continue Reading
Preview
Source: PRNewswire
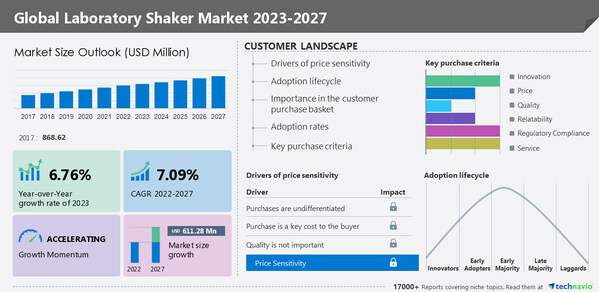
Technavio has announced its latest market research report titled Global Laboratory Shaker Market 2023-2027
North America will account for
34% of the market growth of the global laboratory shaker market. Factors such as the increased investments in R&D in the biomedical and life sciences industry and the presence of many established vendors are driving the growth of the laboratory shaker market in North America. The
Laboratory Shaker Market by Product, Application and Geography - Forecast and Analysis 2023-2027 report has been published by Technavio. Market size is forecast to grow by
USD 611.28 million between 2022 and 2027 at a
CAGR of 7.09%. The report provides a comprehensive analysis of growth opportunities at regional levels, new product launches, the latest trends, and the post-pandemic recovery of the global market.
Download A PDF Sample Report
Company Profiles
The laboratory shaker market report includes information on the key products and recent developments of leading vendors, including:
Bionics Scientific Technologies Pvt. Ltd. - The company offers laboratory shakers that include analog shakers that have a speed range of 30 - 250 RPM, and can carry a max load of 35lbs.
Biosan - The company offers laboratory shakers that come with choice of five (5) interchangeable platforms, a brushless motor with a guaranteed service life up to 35,000 hours and an automatic loading balancing system.
Boekel Scientific - The company offers laboratory shakers that provide gentle continuous mixing of specimens in blood tubes, microcentrifuge tubes, glass vials, or plates, and can operate in variable speeds from 4-24 rotations per minute.
Cole Parmer Instrument Co. LLC - The company offers laboratory shakers that offer orbital shaking action with 16-mm orbit that are ideal for larger samples and a built-in digital timer and variable speed control to 300 rpm.
To know about all vendor offerings -
Buy the report
Market Dynamics
The market is driven by factors such as the increased use of laboratory shakers in various applications, increased adoption of temperature-controlled laboratory mixing equipment, and rapid growth of laboratory automation systems. However, the high cost of shakers is hindering market growth.
Competitive Analysis
The competitive scenario categorizes companies based on various performance indicators. Some of the factors considered include the financial performance of companies over the past few years, growth strategies, product innovations, new product launches, investments, and growth in market share among others.
Request a Sample
Market Segmentation
By product, the market is segmented into orbital shakers, incubator shakers, and other shakers. The orbital shakers segment accounted for the largest share of the market in 2022.
By geography, the market is segmented into North America, Europe, Asia, and Rest of World (ROW). North America held the largest share of the market in 2022.
Related Reports:
The
lateral flow assay components market is estimated to grow at a CAGR of 5.22% between 2022 and 2027. The size of the market is forecast to increase by USD 97.76 million. The rising efforts in research and development are notably driving the market growth, although factors such as the increase in regulations and inconsistency in test results may impede the market growth.
The
bioprocess technology market size is expected to increase to USD 55.84 billion from 2021 to 2026, and the market's growth momentum will accelerate at a CAGR of 12.27%. The increase in infectious diseases is notably driving the bioprocess technology market growth, although factors such as the lack of trained laboratory professionals may impede the market growth.
Technavio's library includes over 17,000+ reports, covering more than 2,000 emerging technologies.
Subscribe to our "Basic Plan" at just USD 5,000 and get lifetime access to Technavio Insights
What are the key data covered in this laboratory shaker market report?
CAGR of the market during the forecast period.
Detailed information on factors that will drive the growth of the market between 2023 and 2027
Precise estimation of the size of the laboratory shaker market and its contribution to the parent market.
Accurate predictions about upcoming trends and changes in consumer behavior.
Growth of the market across North America, Europe, Asia, and Rest of World (ROW).
A thorough analysis of the market's competitive landscape and detailed information about vendors.
Comprehensive analysis of factors that will challenge the growth of laboratory shaker market vendors.
Table of contents:
1 Executive Summary
1.1 Market overview
Exhibit 01: Executive Summary – Chart on Market Overview
Exhibit 02: Executive Summary – Data Table on Market Overview
Exhibit 03: Executive Summary – Chart on Global Market Characteristics
Exhibit 04: Executive Summary – Chart on Market by Geography
Exhibit 05: Executive Summary – Chart on Market Segmentation by Product
Exhibit 06: Executive Summary – Chart on Market Segmentation by Application
Exhibit 07: Executive Summary – Chart on Incremental Growth
Exhibit 08: Executive Summary – Data Table on Incremental Growth
Exhibit 09: Executive Summary – Chart on Vendor Market Positioning
2 Market Landscape
2.1 Market ecosystem
Exhibit 10: Parent market
Exhibit 11: Market Characteristics
3 Market Sizing
3.1 Market definition
Exhibit 12: Offerings of vendors included in the market definition
3.2 Market segment analysis
Exhibit 13: Market segments
3.3 Market size 2022
3.4 Market outlook: Forecast for 2022-2027
Exhibit 14: Chart on Global - Market size and forecast 2022-2027 ($ million)
Exhibit 15: Data Table on Global - Market size and forecast 2022-2027 ($ million)
Exhibit 16: Chart on Global Market: Year-over-year growth 2022-2027 (%)
Exhibit 17: Data Table on Global Market: Year-over-year growth 2022-2027 (%)
4 Five Forces Analysis
4.1 Five forces summary
Exhibit 18: Five forces analysis - Comparison between 2022 and 2027
4.2 Bargaining power of buyers
Exhibit 19: Chart on Bargaining power of buyers – Impact of key factors 2022 and 2027
4.3 Bargaining power of suppliers
Exhibit 20: Bargaining power of suppliers – Impact of key factors in 2022 and 2027
4.4 Threat of new entrants
Exhibit 21: Threat of new entrants – Impact of key factors in 2022 and 2027
4.5 Threat of substitutes
Exhibit 22: Threat of substitutes – Impact of key factors in 2022 and 2027
4.6 Threat of rivalry
Exhibit 23: Threat of rivalry – Impact of key factors in 2022 and 2027
4.7 Market condition
Exhibit 24: Chart on Market condition - Five forces 2022 and 2027
5 Market Segmentation by Product
5.1 Market segments
Exhibit 25: Chart on Product - Market share 2022-2027 (%)
Exhibit 26: Data Table on Product - Market share 2022-2027 (%)
5.2 Comparison by Product
Exhibit 27: Chart on Comparison by Product
Exhibit 28: Data Table on Comparison by Product
5.3 Orbital shakers - Market size and forecast 2022-2027
Exhibit 29: Chart on Orbital shakers - Market size and forecast 2022-2027 ($ million)
Exhibit 30: Data Table on Orbital shakers - Market size and forecast 2022-2027 ($ million)
Exhibit 31: Chart on Orbital shakers - Year-over-year growth 2022-2027 (%)
Exhibit 32: Data Table on Orbital shakers - Year-over-year growth 2022-2027 (%)
5.4 Incubator shakers - Market size and forecast 2022-2027
Exhibit 33: Chart on Incubator shakers - Market size and forecast 2022-2027 ($ million)
Exhibit 34: Data Table on Incubator shakers - Market size and forecast 2022-2027 ($ million)
Exhibit 35: Chart on Incubator shakers - Year-over-year growth 2022-2027 (%)
Exhibit 36: Data Table on Incubator shakers - Year-over-year growth 2022-2027 (%)
5.5 Other shakers - Market size and forecast 2022-2027
Exhibit 37: Chart on Other shakers - Market size and forecast 2022-2027 ($ million)
Exhibit 38: Data Table on Other shakers - Market size and forecast 2022-2027 ($ million)
Exhibit 39: Chart on Other shakers - Year-over-year growth 2022-2027 (%)
Exhibit 40: Data Table on Other shakers - Year-over-year growth 2022-2027 (%)
5.6 Market opportunity by Product
Exhibit 41: Market opportunity by Product ($ million)
6 Market Segmentation by Application
6.1 Market segments
Exhibit 42: Chart on Application - Market share 2022-2027 (%)
Exhibit 43: Data Table on Application - Market share 2022-2027 (%)
6.2 Comparison by Application
Exhibit 44: Chart on Comparison by Application
Exhibit 45: Data Table on Comparison by Application
6.3 Microbiology - Market size and forecast 2022-2027
Exhibit 46: Chart on Microbiology - Market size and forecast 2022-2027 ($ million)
Exhibit 47: Data Table on Microbiology - Market size and forecast 2022-2027 ($ million)
Exhibit 48: Chart on Microbiology - Year-over-year growth 2022-2027 (%)
Exhibit 49: Data Table on Microbiology - Year-over-year growth 2022-2027 (%)
6.4 Molecular biology - Market size and forecast 2022-2027
Exhibit 50: Chart on Molecular biology - Market size and forecast 2022-2027 ($ million)
Exhibit 51: Data Table on Molecular biology - Market size and forecast 2022-2027 ($ million)
Exhibit 52: Chart on Molecular biology - Year-over-year growth 2022-2027 (%)
Exhibit 53: Data Table on Molecular biology - Year-over-year growth 2022-2027 (%)
6.5 Others - Market size and forecast 2022-2027
Exhibit 54: Chart on Others - Market size and forecast 2022-2027 ($ million)
Exhibit 55: Data Table on Others - Market size and forecast 2022-2027 ($ million)
Exhibit 56: Chart on Others - Year-over-year growth 2022-2027 (%)
Exhibit 57: Data Table on Others - Year-over-year growth 2022-2027 (%)
6.6 Market opportunity by Application
Exhibit 58: Market opportunity by Application ($ million)
7 Customer Landscape
7.1 Customer landscape overview
Exhibit 59: Analysis of price sensitivity, lifecycle, customer purchase basket, adoption rates, and purchase criteria
8 Geographic Landscape
8.1 Geographic segmentation
Exhibit 60: Chart on Market share by geography 2022-2027 (%)
Exhibit 61: Data Table on Market share by geography 2022-2027 (%)
8.2 Geographic comparison
Exhibit 62: Chart on Geographic comparison
Exhibit 63: Data Table on Geographic comparison
8.3 North America - Market size and forecast 2022-2027
Exhibit 64: Chart on North America - Market size and forecast 2022-2027 ($ million)
Exhibit 65: Data Table on North America - Market size and forecast 2022-2027 ($ million)
Exhibit 66: Chart on North America - Year-over-year growth 2022-2027 (%)
Exhibit 67: Data Table on North America - Year-over-year growth 2022-2027 (%)
8.4 Europe - Market size and forecast 2022-2027
Exhibit 68: Chart on Europe - Market size and forecast 2022-2027 ($ million)
Exhibit 69: Data Table on Europe - Market size and forecast 2022-2027 ($ million)
Exhibit 70: Chart on Europe - Year-over-year growth 2022-2027 (%)
Exhibit 71: Data Table on Europe - Year-over-year growth 2022-2027 (%)
8.5 Asia - Market size and forecast 2022-2027
Exhibit 72: Chart on Asia - Market size and forecast 2022-2027 ($ million)
Exhibit 73: Data Table on Asia - Market size and forecast 2022-2027 ($ million)
Exhibit 74: Chart on Asia - Year-over-year growth 2022-2027 (%)
Exhibit 75: Data Table on Asia - Year-over-year growth 2022-2027 (%)
8.6 Rest of World (ROW) - Market size and forecast 2022-2027
Exhibit 76: Chart on Rest of World (ROW) - Market size and forecast 2022-2027 ($ million)
Exhibit 77: Data Table on Rest of World (ROW) - Market size and forecast 2022-2027 ($ million)
Exhibit 78: Chart on Rest of World (ROW) - Year-over-year growth 2022-2027 (%)
Exhibit 79: Data Table on Rest of World (ROW) - Year-over-year growth 2022-2027 (%)
8.7 US - Market size and forecast 2022-2027
Exhibit 80: Chart on US - Market size and forecast 2022-2027 ($ million)
Exhibit 81: Data Table on US - Market size and forecast 2022-2027 ($ million)
Exhibit 82: Chart on US - Year-over-year growth 2022-2027 (%)
Exhibit 83: Data Table on US - Year-over-year growth 2022-2027 (%)
8.8 UK - Market size and forecast 2022-2027
Exhibit 84: Chart on UK - Market size and forecast 2022-2027 ($ million)
Exhibit 85: Data Table on UK - Market size and forecast 2022-2027 ($ million)
Exhibit 86: Chart on UK - Year-over-year growth 2022-2027 (%)
Exhibit 87: Data Table on UK - Year-over-year growth 2022-2027 (%)
8.9 China - Market size and forecast 2022-2027
Exhibit 88: Chart on China - Market size and forecast 2022-2027 ($ million)
Exhibit 89: Data Table on China - Market size and forecast 2022-2027 ($ million)
Exhibit 90: Chart on China - Year-over-year growth 2022-2027 (%)
Exhibit 91: Data Table on China - Year-over-year growth 2022-2027 (%)
8.10 Canada - Market size and forecast 2022-2027
Exhibit 92: Chart on Canada - Market size and forecast 2022-2027 ($ million)
Exhibit 93: Data Table on Canada - Market size and forecast 2022-2027 ($ million)
Exhibit 94: Chart on Canada - Year-over-year growth 2022-2027 (%)
Exhibit 95: Data Table on Canada - Year-over-year growth 2022-2027 (%)
8.11 Germany - Market size and forecast 2022-2027
Exhibit 96: Chart on Germany - Market size and forecast 2022-2027 ($ million)
Exhibit 97: Data Table on Germany - Market size and forecast 2022-2027 ($ million)
Exhibit 98: Chart on Germany - Year-over-year growth 2022-2027 (%)
Exhibit 99: Data Table on Germany - Year-over-year growth 2022-2027 (%)
8.12 Market opportunity by geography
Exhibit 100: Market opportunity by geography ($ million)
9 Drivers, Challenges, and Trends
9.1 Market drivers
9.2 Market challenges
9.3 Impact of drivers and challenges
Exhibit 101: Impact of drivers and challenges in 2022 and 2027
9.4 Market trends
10 Vendor Landscape
10.1 Overview
10.2 Vendor landscape
Exhibit 102: Overview on Criticality of inputs and Factors of differentiation
10.3 Landscape disruption
Exhibit 103: Overview on factors of disruption
10.4 Industry risks
Exhibit 104: Impact of key risks on business
11 Vendor Analysis
11.1 Vendors covered
Exhibit 105: Vendors covered
11.2 Market positioning of vendors
Exhibit 106: Matrix on vendor position and classification
Exhibit 107: Benchmark Scientific Inc. - Overview
Exhibit 108: Benchmark Scientific Inc. - Product / Service
Exhibit 109: Benchmark Scientific Inc. - Key offerings
Exhibit 110: Bionics Scientific Technologies Pvt. Ltd. - Overview
Exhibit 111: Bionics Scientific Technologies Pvt. Ltd. - Product / Service
Exhibit 112: Bionics Scientific Technologies Pvt. Ltd. - Key offerings
11.5 Biosan
Exhibit 113: Biosan - Overview
Exhibit 114: Biosan - Product / Service
Exhibit 115: Biosan - Key offerings
11.6 Boekel Scientific
Exhibit 116: Boekel Scientific - Overview
Exhibit 117: Boekel Scientific - Product / Service
Exhibit 118: Boekel Scientific - Key offerings
Exhibit 119: Cole Parmer Instrument Co. LLC - Overview
Exhibit 120: Cole Parmer Instrument Co. LLC - Product / Service
Exhibit 121: Cole Parmer Instrument Co. LLC - Key news
Exhibit 122: Cole Parmer Instrument Co. LLC - Key offerings
11.8 Corning Inc.
Exhibit 123: Corning Inc. - Overview
Exhibit 124: Corning Inc. - Business segments
Exhibit 125: Corning Inc. - Key news
Exhibit 126: Corning Inc. - Key offerings
Exhibit 127: Corning Inc. - Segment focus
11.9 Eppendorf SE
Exhibit 128: Eppendorf SE - Overview
Exhibit 129: Eppendorf SE - Product / Service
Exhibit 130: Eppendorf SE - Key news
Exhibit 131: Eppendorf SE - Key offerings
11.10 Esco Micro Pte. Ltd.
Exhibit 132: Esco Micro Pte. Ltd. - Overview
Exhibit 133: Esco Micro Pte. Ltd. - Product / Service
Exhibit 134: Esco Micro Pte. Ltd. - Key offerings
Exhibit 135: Grant Instruments (Cambridge) Ltd. - Overview
Exhibit 136: Grant Instruments (Cambridge) Ltd. - Product / Service
Exhibit 137: Grant Instruments (Cambridge) Ltd. - Key offerings
Exhibit 138: Heidolph Instruments GmbH and CO. KG - Overview
Exhibit 139: Heidolph Instruments GmbH and CO. KG - Product / Service
Exhibit 140: Heidolph Instruments GmbH and CO. KG - Key offerings
11.13 IKA Werke GmbH and CO. KG
Exhibit 141: IKA Werke GmbH and CO. KG - Overview
Exhibit 142: IKA Werke GmbH and CO. KG - Product / Service
Exhibit 143: IKA Werke GmbH and CO. KG - Key offerings
11.14 JEIOTECH
Exhibit 144: JEIOTECH - Overview
Exhibit 145: JEIOTECH - Product / Service
Exhibit 146: JEIOTECH - Key offerings
11.15 Perkin Elmer Inc
Exhibit 147: Perkin Elmer Inc - Overview
Exhibit 148: Perkin Elmer Inc - Business segments
Exhibit 149: Perkin Elmer Inc - Key news
Exhibit 150: Perkin Elmer Inc - Key offerings
Exhibit 151: Perkin Elmer Inc - Segment focus
Exhibit 152: Santa Cruz Biotechnology Inc. - Overview
Exhibit 153: Santa Cruz Biotechnology Inc. - Product / Service
Exhibit 154: Santa Cruz Biotechnology Inc. - Key offerings
11.17 VWR International LLC
Exhibit 155: VWR International LLC - Overview
Exhibit 156: VWR International LLC - Product / Service
Exhibit 157: VWR International LLC - Key offerings
12 Appendix
12.1 Scope of the report
12.2 Inclusions and exclusions checklist
Exhibit 158: Inclusions checklist
Exhibit 159: Exclusions checklist
12.3 Currency conversion rates for US$
Exhibit 160: Currency conversion rates for US$
12.4 Research methodology
Exhibit 161: Research methodology
Exhibit 162: Validation techniques employed for market sizing
Exhibit 163: Information sources
12.5 List of abbreviations
Exhibit 164: List of abbreviations
About Us
Technavio is a leading global technology research and advisory company. Their research and analysis focus on emerging market trends and provides actionable insights to help businesses identify market opportunities and develop effective strategies to optimize their market positions. With over 500 specialized analysts, Technavio's report library consists of more than 17,000 reports and counting, covering 800 technologies, spanning across 50 countries. Their client base consists of enterprises of all sizes, including more than 100 Fortune 500 companies. This growing client base relies on Technavio's comprehensive coverage, extensive research, and actionable market insights to identify opportunities in existing and potential markets and assess their competitive positions within changing market scenarios.
Contact
Technavio Research
Jesse Maida
Media & Marketing Executive
US: +1 844 364 1100
UK: +44 203 893 3200
Email: [email protected]
Website: www.technavio.com/
SOURCE Technavio
For more details,please visit the original website
The content of the article does not represent any opinions of Synapse and its affiliated companies. If there is any copyright infringement or error, please contact us, and we will deal with it within 24 hours.
Organizations
Indications
Targets
-Drugs
-Chat with Hiro
Hot reports


Get started for free today!
Accelerate Strategic R&D decision making with Synapse, PatSnap’s AI-powered Connected Innovation Intelligence Platform Built for Life Sciences Professionals.
Start your data trial now!
Synapse data is also accessible to external entities via APIs or data packages. Empower better decisions with the latest in pharmaceutical intelligence.