Fertility Testing Devices Market: 40% of Growth to Originate from North America, Ovulation Predictor Kits Segment to be Significant for Revenue Generation - Technavio
26 Aug 2022
NEW YORK, Aug. 26, 2022 /PRNewswire/ -- The "
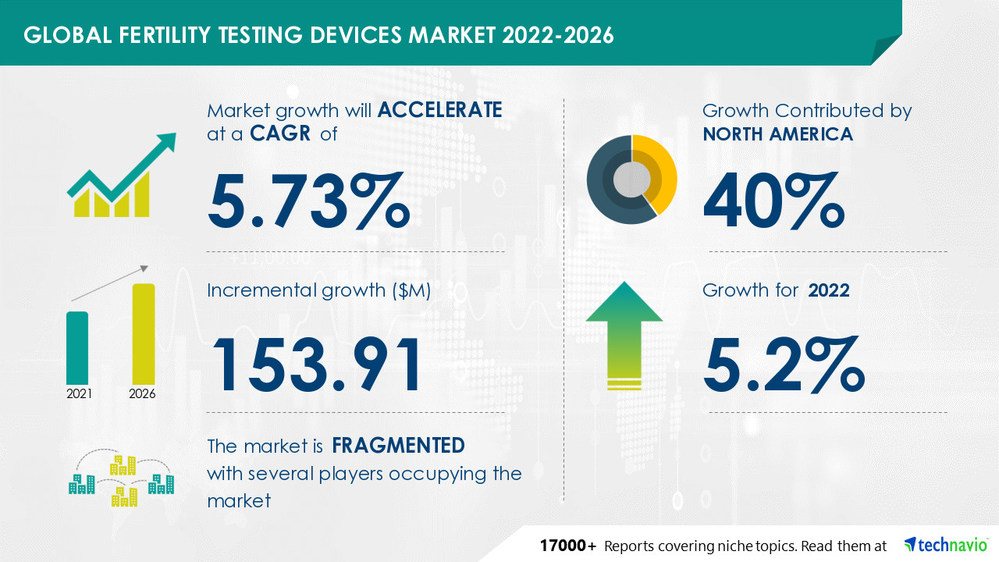
Fertility Testing Devices Market Forecast and Analysis 2022-2026" report has been added to Technavio's offering. With ISO 9001:2015 certification, Technavio is proudly partnering with more than 100 Fortune 500 companies for over 16 years. The fertility testing devices market share is expected to increase to
USD 153.91 million from 2021 to 2026, and the market's growth momentum will accelerate at a
CAGR of 5.73%. Technavio categorizes the global fertility testing devices market as a part of the
global healthcare equipment market. Our research report has extensively covered external factors influencing the parent market growth potential in the coming years, which will determine the levels of growth of the fertility testing devices market during the forecast period.
Preview
Source: PRNewswire
Attractive Opportunities in Fertility Testing Devices Market by Product and Geography - Forecast and Analysis 2022-2026
To know more about the parent market analysis - Request a FREE Sample Now!
Fertility Testing Devices Market: Segmentation Analysis
The fertility testing devices market report is segmented by Product (Ovulation predictor kits, Fertility monitors, and Male fertility testing devices) and Geography (North America, Europe, Asia, and the Rest of the World (ROW)).
Revenue Generating Segment :
The fertility testing devices market share growth in the
ovulation predictor kits segment will be significant for revenue generation.
The rising median age of first-time pregnancies in women, the increasing preference for ovulation predictor kits due to the convenience they offer, their high efficacy and low-cost benefits, rapid technological advances, and the innovations in the development of such kits are expected to drive the growth of this segment during the forecast period.
40% of the market's growth will originate from
North America during the forecast period.
US and Canada are the key markets for fertility testing devices in North America. Market growth in this region will be slower than the growth of the market in the European and Asian regions.
The rising prevalence of PCOS, the increasing age of first-time pregnancy, and the declining fertility rate in the region will facilitate the fertility testing devices market growth in North America over the forecast period.
Grab a sample report
for additional insights into the contribution of all the segments & regional opportunities in the report.
Fertility Testing Devices Market - Key Market Dynamics
Market Driver - The key factor driving growth in the fertility testing devices market is the rising median age of first-time pregnancies in women. In Mexico, the mean age of women at first childbirth was 20-24 years. In Ireland, Italy, South Korea, Spain, and Switzerland, the average age of women at first childbirth was 30-34 years. In Hungary, Latvia, Lithuania, Poland, the Slovak Republic, Turkey, and the US, the average age of women at first childbirth was 25-29 years. Delayed childbearing due to the high prevalence of polycystic ovary syndrome (PCOS), ruptured uterus, amniotic fluid embolism, and delayed parenting are some of the reasons for late pregnancies.
Market Challenges - The stringent regulatory bodies will be a major challenge for the fertility testing devices market during the forecast period. Factors such as faulty device designs, malfunction of the devices, and precision and accuracy error rates are some of the issues associated with fertility testing devices, causing misdiagnosis and improper patient management and treatment. Hence, stringent government regulations are imposed on the manufacturing of fertility testing devices. Different regulatory bodies are appointed to guide fertility testing device manufacturers and marketers. Regulatory bodies such as the US Food and Drug Administration (FDA) and the European Union (EU) authorities play a major role in approving these devices and their components.
To learn about additional key drivers, trends, and challenges - Request a FREE Sample Report right now!
Fertility Testing Devices Market - Vendor Analysis
The fertility testing devices market is
fragmented and the vendors are deploying growth strategies such as introducing innovative products to compete in the market.
Babystart Ltd.
Church and Dwight Co. Inc.
Medical Electronic Systems LLC
PREGMATE
The Procter and Gamble Co.
To gain access to more vendor profiles with their key offerings available with Technavio, Click Here
The competitive scenario provided in the
Fertility Testing Devices Market report analyzes, evaluates, and positions companies based on various performance indicators. Some of the factors considered for this analysis include the financial performance of companies over the past few years, growth strategies, product innovations, new product launches, investments, growth in market share, etc.Don't wait, Make a strategic approach & boost your business goals with our Fertility Testing Devices Market Forecast Report -
Related Reports:
The
transcatheter pulmonary valve market share is expected to increase by USD 51.74 million from 2021 to 2026, and the market's growth momentum will accelerate at a CAGR of 6.1%.
The
ureteroscopy devices market share is expected to increase to USD 210.84 million from 2021 to 2026, and the market's growth momentum will accelerate at a CAGR of 4.3%.
Browse for Technavio "Healthcare Market" Research Reports
Key Topics Covered:
1 Executive Summary
1.1 Market Overview
Exhibit 01: Executive Summary – Chart on Market Overview
Exhibit 02: Executive Summary – Data Table on Market Overview
Exhibit 03: Executive Summary – Chart on Global Market Characteristics
Exhibit 04: Executive Summary – Chart on Market by Geography
Exhibit 05: Executive Summary – Chart on Market Segmentation by Product
Exhibit 06: Executive Summary – Chart on Incremental Growth
Exhibit 07: Executive Summary – Data Table on Incremental Growth
Exhibit 08: Executive Summary – Chart on Vendor Market Positioning
2 Market Landscape
2.1 Market ecosystem
Exhibit 09: Parent market
Exhibit 10: Market Characteristics
3 Market Sizing
3.1 Market definition
Exhibit 11: Offerings of vendors included in the market definition
3.2 Market segment analysis
Exhibit 12: Market segments
3.3 Market size 2021
3.4 Market outlook: Forecast for 2021-2026
Exhibit 13: Chart on Global - Market size and forecast 2021-2026 ($ million)
Exhibit 14: Data Table on Global - Market size and forecast 2021-2026 ($ million)
Exhibit 15: Chart on Global Market: Year-over-year growth 2021-2026 (%)
Exhibit 16: Data Table on Global Market: Year-over-year growth 2021-2026 (%)
4 Five Forces Analysis
4.1 Five forces summary
Exhibit 17: Five forces analysis - Comparison between 2021 and 2026
4.2 Bargaining power of buyers
Exhibit 18: Chart on Bargaining power of buyers – Impact of key factors 2021 and 2026
4.3 Bargaining power of suppliers
Exhibit 19: Bargaining power of suppliers – Impact of key factors in 2021 and 2026
4.4 Threat of new entrants
Exhibit 20: Threat of new entrants – Impact of key factors in 2021 and 2026
4.5 Threat of substitutes
Exhibit 21: Threat of substitutes – Impact of key factors in 2021 and 2026
4.6 Threat of rivalry
Exhibit 22: Threat of rivalry – Impact of key factors in 2021 and 2026
4.7 Market condition
Exhibit 23: Chart on Market condition - Five forces 2021 and 2026
5 Market Segmentation by Product
5.1 Market segments
Exhibit 24: Chart on Product - Market share 2021-2026 (%)
Exhibit 25: Data Table on Product - Market share 2021-2026 (%)
5.2 Comparison by Product
Exhibit 26: Chart on Comparison by Product
Exhibit 27: Data Table on Comparison by Product
5.3 Ovulation predictor kits - Market size and forecast 2021-2026
Exhibit 28: Chart on Ovulation predictor kits - Market size and forecast 2021-2026 ($ million)
Exhibit 29: Data Table on Ovulation predictor kits - Market size and forecast 2021-2026 ($ million)
Exhibit 30: Chart on Ovulation predictor kits - Year-over-year growth 2021-2026 (%)
Exhibit 31: Data Table on Ovulation predictor kits - Year-over-year growth 2021-2026 (%)
5.4 Fertility monitors - Market size and forecast 2021-2026
Exhibit 32: Chart on Fertility monitors - Market size and forecast 2021-2026 ($ million)
Exhibit 33: Data Table on Fertility monitors - Market size and forecast 2021-2026 ($ million)
Exhibit 34: Chart on Fertility monitors - Year-over-year growth 2021-2026 (%)
Exhibit 35: Data Table on Fertility monitors - Year-over-year growth 2021-2026 (%)
5.5 Male fertility testing devices - Market size and forecast 2021-2026
Exhibit 36: Chart on Male fertility testing devices - Market size and forecast 2021-2026 ($ million)
Exhibit 37: Data Table on Male fertility testing devices - Market size and forecast 2021-2026 ($ million)
Exhibit 38: Chart on Male fertility testing devices - Year-over-year growth 2021-2026 (%)
Exhibit 39: Data Table on Male fertility testing devices - Year-over-year growth 2021-2026 (%)
5.6 Market opportunity by Product
Exhibit 40: Market opportunity by Product ($ million)
6 Customer Landscape
6.1 Customer landscape overview
Exhibit 41: Analysis of price sensitivity, lifecycle, customer purchase basket, adoption rates, and purchase criteria
7 Geographic Landscape
7.1 Geographic segmentation
Exhibit 42: Chart on Market share by geography 2021-2026 (%)
Exhibit 43: Data Table on Market share by geography 2021-2026 (%)
7.2 Geographic comparison
Exhibit 44: Chart on Geographic comparison
Exhibit 45: Data Table on Geographic comparison
7.3 North America - Market size and forecast 2021-2026
Exhibit 46: Chart on North America - Market size and forecast 2021-2026 ($ million)
Exhibit 47: Data Table on North America - Market size and forecast 2021-2026 ($ million)
Exhibit 48: Chart on North America - Year-over-year growth 2021-2026 (%)
Exhibit 49: Data Table on North America - Year-over-year growth 2021-2026 (%)
7.4 Europe - Market size and forecast 2021-2026
Exhibit 50: Chart on Europe - Market size and forecast 2021-2026 ($ million)
Exhibit 51: Data Table on Europe - Market size and forecast 2021-2026 ($ million)
Exhibit 52: Chart on Europe - Year-over-year growth 2021-2026 (%)
Exhibit 53: Data Table on Europe - Year-over-year growth 2021-2026 (%)
7.5 Asia - Market size and forecast 2021-2026
Exhibit 54: Chart on Asia - Market size and forecast 2021-2026 ($ million)
Exhibit 55: Data Table on Asia - Market size and forecast 2021-2026 ($ million)
Exhibit 56: Chart on Asia - Year-over-year growth 2021-2026 (%)
Exhibit 57: Data Table on Asia - Year-over-year growth 2021-2026 (%)
7.6 Rest of World (ROW) - Market size and forecast 2021-2026
Exhibit 58: Chart on Rest of World (ROW) - Market size and forecast 2021-2026 ($ million)
Exhibit 59: Data Table on Rest of World (ROW) - Market size and forecast 2021-2026 ($ million)
Exhibit 60: Chart on Rest of World (ROW) - Year-over-year growth 2021-2026 (%)
Exhibit 61: Data Table on Rest of World (ROW) - Year-over-year growth 2021-2026 (%)
7.7 US - Market size and forecast 2021-2026
Exhibit 62: Chart on US - Market size and forecast 2021-2026 ($ million)
Exhibit 63: Data Table on US - Market size and forecast 2021-2026 ($ million)
Exhibit 64: Chart on US - Year-over-year growth 2021-2026 (%)
Exhibit 65: Data Table on US - Year-over-year growth 2021-2026 (%)
7.8 Germany - Market size and forecast 2021-2026
Exhibit 66: Chart on Germany - Market size and forecast 2021-2026 ($ million)
Exhibit 67: Data Table on Germany - Market size and forecast 2021-2026 ($ million)
Exhibit 68: Chart on Germany - Year-over-year growth 2021-2026 (%)
Exhibit 69: Data Table on Germany - Year-over-year growth 2021-2026 (%)
7.9 UK - Market size and forecast 2021-2026
Exhibit 70: Chart on UK - Market size and forecast 2021-2026 ($ million)
Exhibit 71: Data Table on UK - Market size and forecast 2021-2026 ($ million)
Exhibit 72: Chart on UK - Year-over-year growth 2021-2026 (%)
Exhibit 73: Data Table on UK - Year-over-year growth 2021-2026 (%)
7.10 Canada - Market size and forecast 2021-2026
Exhibit 74: Chart on Canada - Market size and forecast 2021-2026 ($ million)
Exhibit 75: Data Table on Canada - Market size and forecast 2021-2026 ($ million)
Exhibit 76: Chart on Canada - Year-over-year growth 2021-2026 (%)
Exhibit 77: Data Table on Canada - Year-over-year growth 2021-2026 (%)
7.11 China - Market size and forecast 2021-2026
Exhibit 78: Chart on China - Market size and forecast 2021-2026 ($ million)
Exhibit 79: Data Table on China - Market size and forecast 2021-2026 ($ million)
Exhibit 80: Chart on China - Year-over-year growth 2021-2026 (%)
Exhibit 81: Data Table on China - Year-over-year growth 2021-2026 (%)
7.12 Market opportunity by geography
Exhibit 82: Market opportunity by geography ($ million)
8 Drivers, Challenges, and Trends
8.1 Market drivers
8.2 Market challenges
8.3 Impact of drivers and challenges
Exhibit 83: Impact of drivers and challenges in 2021 and 2026
8.4 Market trends
9 Vendor Landscape
9.1 Overview
9.2 Vendor landscape
Exhibit 84: Overview on Criticality of inputs and Factors of differentiation
9.3 Landscape disruption
Exhibit 85: Overview on factors of disruption
9.4 Industry risks
Exhibit 86: Impact of key risks on business
10 Vendor Analysis
10.1 Vendors covered
Exhibit 87: Vendors covered
10.2 Market positioning of vendors
Exhibit 88: Matrix on vendor position and classification
10.3 Abbott Laboratories
Exhibit 89: Abbott Laboratories - Overview
Exhibit 90: Abbott Laboratories - Business segments
Exhibit 91: Abbott Laboratories - Key news
Exhibit 92: Abbott Laboratories - Key offerings
Exhibit 93: Abbott Laboratories - Segment focus
Exhibit 94: Alfa Scientific Designs Inc - Overview
Exhibit 95: Alfa Scientific Designs Inc - Product / Service
Exhibit 96: Alfa Scientific Designs Inc - Key offerings
10.5 Ava AG
Exhibit 97: Ava AG - Overview
Exhibit 98: Ava AG - Key offerings
10.6 Church and Dwight Co. Inc.
Exhibit 99: Church and Dwight Co. Inc. - Overview
Exhibit 100: Church and Dwight Co. Inc. - Business segments
Exhibit 101: Church and Dwight Co. Inc. - Key news
Exhibit 102: Church and Dwight Co. Inc. - Key offerings
Exhibit 103: Church and Dwight Co. Inc. - Segment focus
10.7 Geratherm Medical AG
Exhibit 104: Geratherm Medical AG - Overview
Exhibit 105: Geratherm Medical AG - Business segments
Exhibit 106: Geratherm Medical AG - Key offerings
Exhibit 107: Geratherm Medical AG - Segment focus
10.8 Quanovate Tech Inc.
Exhibit 108: Quanovate Tech Inc. - Overview
Exhibit 109: Quanovate Tech Inc. - Key offerings
10.9 Quidel Corp.
Exhibit 110: Quidel Corp. - Overview
Exhibit 111: Quidel Corp. - Product / Service
Exhibit 112: Quidel Corp. - Key offerings
10.10 The Procter and Gamble Co.
Exhibit 113: The Procter and Gamble Co. - Overview
Exhibit 114: The Procter and Gamble Co. - Product / Service
Exhibit 115: The Procter and Gamble Co. - Key news
Exhibit 116: The Procter and Gamble Co. - Key offerings
10.11 UEBE Medical GmbH
Exhibit 117: UEBE Medical GmbH - Overview
Exhibit 118: UEBE Medical GmbH - Product / Service
Exhibit 119: UEBE Medical GmbH - Key offerings
10.12 Valley Electronics AG
Exhibit 120: Valley Electronics AG - Overview
Exhibit 121: Valley Electronics AG - Product / Service
Exhibit 122: Valley Electronics AG - Key offerings
11.1 Scope of the report
11.2 Inclusions and exclusions checklist
Exhibit 123: Inclusions checklist
Exhibit 124: Exclusions checklist
11.3 Currency conversion rates for US$
Exhibit 125: Currency conversion rates for US$
11.4 Research methodology
Exhibit 126: Research methodology
Exhibit 127: Validation techniques employed for market sizing
Exhibit 128: Information sources
11.5 List of abbreviations
Exhibit 129: List of abbreviations
About Us
Technavio is a leading global technology research and advisory company. Their research and analysis focus on emerging market trends and provide actionable insights to help businesses identify market opportunities and develop effective strategies to optimize their market positions.
With over 500 specialized analysts, Technavio's report library consists of more than 17,000 reports and counting, covering 800 technologies, spanning 50 countries. Their client base consists of enterprises of all sizes, including more than 100 Fortune 500 companies. This growing client base relies on Technavio's comprehensive coverage, extensive research, and actionable market insights to identify opportunities in existing and potential markets and assess their competitive positions within changing market scenarios.
Contact
Technavio Research
Jesse Maida
US: +1 844 364 1100
UK: +44 203 893 3200
Email:[email protected]
Website: www.technavio.com/
SOURCE Technavio
For more details,please visit the original website
The content of the article does not represent any opinions of Synapse and its affiliated companies. If there is any copyright infringement or error, please contact us, and we will deal with it within 24 hours.
Organizations
Targets
-Drugs
-Hot reports


Get started for free today!
Accelerate Strategic R&D decision making with Synapse, PatSnap’s AI-powered Connected Innovation Intelligence Platform Built for Life Sciences Professionals.
Start your data trial now!
Synapse data is also accessible to external entities via APIs or data packages. Leverages most recent intelligence information, enabling fullest potential.