Neurology Devices Market to grow by USD 10.98 Bn by 2026, 40% of the growth to originate from North America - Technavio
27 Oct 2022
NEW YORK, Oct. 27, 2022 /PRNewswire/ -- Technavio has been monitoring the
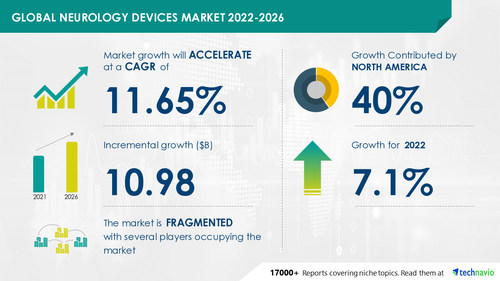
neurology devices market, operating in the healthcare industry. The report estimates the market to register an incremental growth of
USD 10.98 billion, at a
CAGR of 11.65% during the forecast period. The report offers an up-to-date analysis regarding the current market scenario, the latest trends and drivers, and the overall market environment.
Request the Latest Free sample report
Neurology Devices Market: Parent Market Analysis
Continue Reading
Preview
Source: PRNewswire
Technavio has announced its latest market research report titled Global Neurology Devices Market 2022-2026
Technavio categorizes the global neurology devices market as a part of the global healthcare equipment market within the global healthcare industry. External factors influencing the parent market's growth potential in the coming years have been thoroughly investigated in our research analysis.
The market is
fragmented, and the degree of fragmentation will accelerate during the forecast period. Competitors must focus on differentiating their product offerings with unique value propositions to strengthen their foothold in the market. Market vendors also have to leverage the existing growth prospects in the fast-growing segments, while maintaining their positions in the slow-growing segments.
Online Fashion Retail Market in US Value Chain Analysis
An overall understanding of the value chain is critical for optimizing profit margins and evaluating business strategies. The data available in our value chain analysis segment can help vendors drive costs and enhance customer services during the forecast period.
The value chain of the internet and direct marketing retail market includes the following core components:
Inputs
Inbound logistics
Operations
Outbound logistics
Support activities
Innovation
To unlock information about vendor drive costs and customer service,
download a free sample report.
Neurology Devices Market: Segmentation Analysis
Product
Neurostimulation Devices
To treat persistent, uncontrollable nausea and vomiting linked to gastroparesis a programmable implantable gastric neurostimulator provided by Medtronic (ENTERRA II NEUROSTIMULATOR) are positioned in the lower abdomen of the patient. Persons with uncontrollable epilepsy and treatment-resistant depression can activate their vagus nerves using vagus nerve stimulators. Due to the availability of a wide range of uses for stomach neurostimulators and vagus nerve stimulators this segment will boost growth during the forecasted period.
Interventional Neurology Devices
Cerebrospinal Fluid Management Devices
Others
Geography
North America
North America will contribute 40% of market growth. The North American market for neurology devices is mostly centered in the US. Over the forecast period, the North American neurology devices market is expected to increase due to rising capital spending on treating patients with neurological disorders including epilepsy and dementia, and rising demand for neurology devices.
Europe
Asia
Rest Of World (ROW)
To know additional highlights and key points on various market segments and their impact in coming years, Buy Sample Report.
Neurology Devices Market: Scope Analysis
Technavio presents a detailed picture of the market by way of study, synthesis, and summation of data from multiple sources. The neurology devices market report covers the following areas:
Neurology Devices Market Size
Neurology Devices Market Trends
Neurology Devices Market Industry Analysis
This study identifies
the rising prevalence of neurological disorders and the introduction of new technologies and products as the prime reasons driving the Neurology Devices Market growth during the next few years.
Neurology Devices Market: Key Highlights
CAGR of the market during the forecast period
Detailed information on factors that will assist neurology devices market growth during the next five years
Estimation of the neurology devices market size and its contribution to the parent market
Predictions on upcoming trends and changes in consumer behavior
The growth of the neurology devices market
Analysis of the market's competitive landscape and detailed information on vendors
Comprehensive details of factors that will challenge the growth of the neurology devices market, vendors
Get lifetime access to our Technavio Insights! Subscribe to our "Basic Plan" billed annually at USD 5000.
Related Reports
Surgical Drains Wound Drainage Market by Type and Geography - Forecast and Analysis 2022-2026: The report extensively covers the surgical drains wound drainage market segmentation by type (active drains and passive drains) and geography (North America, Europe, Asia, and the Rest of the World (ROW)).
Bilevel Positive Airway Pressure (BiPAP) Market in US Product, Distribution Channel, and Revenue Stream - Forecast and Analysis 2022-2026: The report extensively covers the bilevel positive airway pressure (BiPAP) market in US segmentation by product (devices, masks, and aftermarket parts and accessories), distribution channel (offline and online), and revenue stream (insurance and cash pay).
Table of Contents:
1 Executive Summary
1.1 Market overview
Exhibit 01: Executive Summary – Chart on Market Overview
Exhibit 02: Executive Summary – Data Table on Market Overview
Exhibit 03: Executive Summary – Chart on Global Market Characteristics
Exhibit 04: Executive Summary – Chart on Market by Geography
Exhibit 05: Executive Summary – Chart on Market Segmentation by Product
Exhibit 06: Executive Summary – Chart on Incremental Growth
Exhibit 07: Executive Summary – Data Table on Incremental Growth
Exhibit 08: Executive Summary – Chart on Vendor Market Positioning
2 Market Landscape
2.1 Market ecosystem
Exhibit 09: Parent market
Exhibit 10: Market Characteristics
3 Market Sizing
3.1 Market definition
Exhibit 11: Offerings of vendors included in the market definition
3.2 Market segment analysis
Exhibit 12: Market segments
3.3 Market size 2021
3.4 Market outlook: Forecast for 2021-2026
Exhibit 13: Chart on Global - Market size and forecast 2021-2026 ($ million)
Exhibit 14: Data Table on Global - Market size and forecast 2021-2026 ($ million)
Exhibit 15: Chart on Global Market: Year-over-year growth 2021-2026 (%)
Exhibit 16: Data Table on Global Market: Year-over-year growth 2021-2026 (%)
4 Five Forces Analysis
4.1 Five forces summary
Exhibit 17: Five forces analysis - Comparison between 2021 and 2026
4.2 Bargaining power of buyers
Exhibit 18: Chart on Bargaining power of buyers – Impact of key factors 2021 and 2026
4.3 Bargaining power of suppliers
Exhibit 19: Bargaining power of suppliers – Impact of key factors in 2021 and 2026
4.4 Threat of new entrants
Exhibit 20: Threat of new entrants – Impact of key factors in 2021 and 2026
4.5 Threat of substitutes
Exhibit 21: Threat of substitutes – Impact of key factors in 2021 and 2026
4.6 Threat of rivalry
Exhibit 22: Threat of rivalry – Impact of key factors in 2021 and 2026
4.7 Market condition
Exhibit 23: Chart on Market condition - Five forces 2021 and 2026
5 Market Segmentation by Product
5.1 Market segments
Exhibit 24: Chart on Product - Market share 2021-2026 (%)
Exhibit 25: Data Table on Product - Market share 2021-2026 (%)
5.2 Comparison by Product
Exhibit 26: Chart on Comparison by Product
Exhibit 27: Data Table on Comparison by Product
5.3 Neurostimulation devices - Market size and forecast 2021-2026
Exhibit 28: Chart on Neurostimulation devices - Market size and forecast 2021-2026 ($ million)
Exhibit 29: Data Table on Neurostimulation devices - Market size and forecast 2021-2026 ($ million)
Exhibit 30: Chart on Neurostimulation devices - Year-over-year growth 2021-2026 (%)
Exhibit 31: Data Table on Neurostimulation devices - Year-over-year growth 2021-2026 (%)
5.4 Interventional neurology devices - Market size and forecast 2021-2026
Exhibit 32: Chart on Interventional neurology devices - Market size and forecast 2021-2026 ($ million)
Exhibit 33: Data Table on Interventional neurology devices - Market size and forecast 2021-2026 ($ million)
Exhibit 34: Chart on Interventional neurology devices - Year-over-year growth 2021-2026 (%)
Exhibit 35: Data Table on Interventional neurology devices - Year-over-year growth 2021-2026 (%)
5.5 Neurosurgery devices - Market size and forecast 2021-2026
Exhibit 36: Chart on Neurosurgery devices - Market size and forecast 2021-2026 ($ million)
Exhibit 37: Data Table on Neurosurgery devices - Market size and forecast 2021-2026 ($ million)
Exhibit 38: Chart on Neurosurgery devices - Year-over-year growth 2021-2026 (%)
Exhibit 39: Data Table on Neurosurgery devices - Year-over-year growth 2021-2026 (%)
5.6 Cerebrospinal fluid management devices - Market size and forecast 2021-2026
Exhibit 40: Chart on Cerebrospinal fluid management devices - Market size and forecast 2021-2026 ($ million)
Exhibit 41: Data Table on Cerebrospinal fluid management devices - Market size and forecast 2021-2026 ($ million)
Exhibit 42: Chart on Cerebrospinal fluid management devices - Year-over-year growth 2021-2026 (%)
Exhibit 43: Data Table on Cerebrospinal fluid management devices - Year-over-year growth 2021-2026 (%)
5.7 Others - Market size and forecast 2021-2026
Exhibit 44: Chart on Others - Market size and forecast 2021-2026 ($ million)
Exhibit 45: Data Table on Others - Market size and forecast 2021-2026 ($ million)
Exhibit 46: Chart on Others - Year-over-year growth 2021-2026 (%)
Exhibit 47: Data Table on Others - Year-over-year growth 2021-2026 (%)
5.8 Market opportunity by Product
Exhibit 48: Market opportunity by Product ($ million)
6 Customer Landscape
6.1 Customer landscape overview
Exhibit 49: Analysis of price sensitivity, lifecycle, customer purchase basket, adoption rates, and purchase criteria
7 Geographic Landscape
7.1 Geographic segmentation
Exhibit 50: Chart on Market share by geography 2021-2026 (%)
Exhibit 51: Data Table on Market share by geography 2021-2026 (%)
7.2 Geographic comparison
Exhibit 52: Chart on Geographic comparison
Exhibit 53: Data Table on Geographic comparison
7.3 North America - Market size and forecast 2021-2026
Exhibit 54: Chart on North America - Market size and forecast 2021-2026 ($ million)
Exhibit 55: Data Table on North America - Market size and forecast 2021-2026 ($ million)
Exhibit 56: Chart on North America - Year-over-year growth 2021-2026 (%)
Exhibit 57: Data Table on North America - Year-over-year growth 2021-2026 (%)
7.4 Europe - Market size and forecast 2021-2026
Exhibit 58: Chart on Europe - Market size and forecast 2021-2026 ($ million)
Exhibit 59: Data Table on Europe - Market size and forecast 2021-2026 ($ million)
Exhibit 60: Chart on Europe - Year-over-year growth 2021-2026 (%)
Exhibit 61: Data Table on Europe - Year-over-year growth 2021-2026 (%)
7.5 Asia - Market size and forecast 2021-2026
Exhibit 62: Chart on Asia - Market size and forecast 2021-2026 ($ million)
Exhibit 63: Data Table on Asia - Market size and forecast 2021-2026 ($ million)
Exhibit 64: Chart on Asia - Year-over-year growth 2021-2026 (%)
Exhibit 65: Data Table on Asia - Year-over-year growth 2021-2026 (%)
7.6 Rest of World (ROW) - Market size and forecast 2021-2026
Exhibit 66: Chart on Rest of World (ROW) - Market size and forecast 2021-2026 ($ million)
Exhibit 67: Data Table on Rest of World (ROW) - Market size and forecast 2021-2026 ($ million)
Exhibit 68: Chart on Rest of World (ROW) - Year-over-year growth 2021-2026 (%)
Exhibit 69: Data Table on Rest of World (ROW) - Year-over-year growth 2021-2026 (%)
7.7 US - Market size and forecast 2021-2026
Exhibit 70: Chart on US - Market size and forecast 2021-2026 ($ million)
Exhibit 71: Data Table on US - Market size and forecast 2021-2026 ($ million)
Exhibit 72: Chart on US - Year-over-year growth 2021-2026 (%)
Exhibit 73: Data Table on US - Year-over-year growth 2021-2026 (%)
7.8 Germany - Market size and forecast 2021-2026
Exhibit 74: Chart on Germany - Market size and forecast 2021-2026 ($ million)
Exhibit 75: Data Table on Germany - Market size and forecast 2021-2026 ($ million)
Exhibit 76: Chart on Germany - Year-over-year growth 2021-2026 (%)
Exhibit 77: Data Table on Germany - Year-over-year growth 2021-2026 (%)
7.9 Japan - Market size and forecast 2021-2026
Exhibit 78: Chart on Japan - Market size and forecast 2021-2026 ($ million)
Exhibit 79: Data Table on Japan - Market size and forecast 2021-2026 ($ million)
Exhibit 80: Chart on Japan - Year-over-year growth 2021-2026 (%)
Exhibit 81: Data Table on Japan - Year-over-year growth 2021-2026 (%)
7.10 China - Market size and forecast 2021-2026
Exhibit 82: Chart on China - Market size and forecast 2021-2026 ($ million)
Exhibit 83: Data Table on China - Market size and forecast 2021-2026 ($ million)
Exhibit 84: Chart on China - Year-over-year growth 2021-2026 (%)
Exhibit 85: Data Table on China - Year-over-year growth 2021-2026 (%)
7.11 France - Market size and forecast 2021-2026
Exhibit 86: Chart on France - Market size and forecast 2021-2026 ($ million)
Exhibit 87: Data Table on France - Market size and forecast 2021-2026 ($ million)
Exhibit 88: Chart on France - Year-over-year growth 2021-2026 (%)
Exhibit 89: Data Table on France - Year-over-year growth 2021-2026 (%)
7.12 Market opportunity by geography
Exhibit 90: Market opportunity by geography ($ million)
8 Drivers, Challenges, and Trends
8.1 Market drivers
8.2 Market challenges
8.3 Impact of drivers and challenges
Exhibit 91: Impact of drivers and challenges in 2021 and 2026
8.4 Market trends
9 Vendor Landscape
9.1 Overview
9.2 Vendor landscape
Exhibit 92: Overview on Criticality of inputs and Factors of differentiation
9.3 Landscape disruption
Exhibit 93: Overview on factors of disruption
9.4 Industry risks
Exhibit 94: Impact of key risks on business
10 Vendor Analysis
10.1 Vendors covered
Exhibit 95: Vendors covered
10.2 Market positioning of vendors
Exhibit 96: Matrix on vendor position and classification
10.3 Abbott Laboratories
Exhibit 97: Abbott Laboratories - Overview
Exhibit 98: Abbott Laboratories - Business segments
Exhibit 99: Abbott Laboratories - Key news
Exhibit 100: Abbott Laboratories - Key offerings
Exhibit 101: Abbott Laboratories - Segment focus
10.4 B. Braun SE
Exhibit 102: B. Braun SE - Overview
Exhibit 103: B. Braun SE - Business segments
Exhibit 104: B. Braun SE - Key news
Exhibit 105: B. Braun SE - Key offerings
Exhibit 106: B. Braun SE - Segment focus
10.5 Becton Dickinson and Co.
Exhibit 107: Becton Dickinson and Co. - Overview
Exhibit 108: Becton Dickinson and Co. - Business segments
Exhibit 109: Becton Dickinson and Co. - Key news
Exhibit 110: Becton Dickinson and Co. - Key offerings
Exhibit 111: Becton Dickinson and Co. - Segment focus
Exhibit 112: Boston Scientific Corp. - Overview
Exhibit 113: Boston Scientific Corp. - Business segments
Exhibit 114: Boston Scientific Corp. - Key news
Exhibit 115: Boston Scientific Corp. - Key offerings
Exhibit 116: Boston Scientific Corp. - Segment focus
10.7 Johnson and Johnson
Exhibit 117: Johnson and Johnson - Overview
Exhibit 118: Johnson and Johnson - Business segments
Exhibit 119: Johnson and Johnson - Key news
Exhibit 120: Johnson and Johnson - Key offerings
Exhibit 121: Johnson and Johnson - Segment focus
10.8 Medtronic Plc
Exhibit 122: Medtronic Plc - Overview
Exhibit 123: Medtronic Plc - Business segments
Exhibit 124: Medtronic Plc - Key news
Exhibit 125: Medtronic Plc - Key offerings
Exhibit 126: Medtronic Plc - Segment focus
Exhibit 127: MicroPort Scientific Corp - Overview
Exhibit 128: MicroPort Scientific Corp - Business segments
Exhibit 129: MicroPort Scientific Corp - Key offerings
Exhibit 130: MicroPort Scientific Corp - Segment focus
10.10 Nihon Kohden Corp
Exhibit 131: Nihon Kohden Corp - Overview
Exhibit 132: Nihon Kohden Corp - Product / Service
Exhibit 133: Nihon Kohden Corp - Key news
Exhibit 134: Nihon Kohden Corp - Key offerings
Exhibit 135: Penumbra Inc. - Overview
Exhibit 136: Penumbra Inc. - Product / Service
Exhibit 137: Penumbra Inc. - Key news
Exhibit 138: Penumbra Inc. - Key offerings
10.12 Stryker Corp.
Exhibit 139: Stryker Corp. - Overview
Exhibit 140: Stryker Corp. - Business segments
Exhibit 141: Stryker Corp. - Key news
Exhibit 142: Stryker Corp. - Key offerings
Exhibit 143: Stryker Corp. - Segment focus
11.1 Scope of the report
11.2 Inclusions and exclusions checklist
Exhibit 144: Inclusions checklist
Exhibit 145: Exclusions checklist
11.3 Currency conversion rates for US$
Exhibit 146: Currency conversion rates for US$
11.4 Research methodology
Exhibit 147: Research methodology
Exhibit 148: Validation techniques employed for market sizing
Exhibit 149: Information sources
11.5 List of abbreviations
Exhibit 150: List of abbreviations
About Us
Technavio is a leading global technology research and advisory company. Their research and analysis focus on emerging market trends and provides actionable insights to help businesses identify market opportunities and develop effective strategies to optimize their market positions. With over 500 specialized analysts, Technavio's report library consists of more than 17,000 reports and counting, covering 800 technologies, spanning across 50 countries. Their client base consists of enterprises of all sizes, including more than 100 Fortune 500 companies. This growing client base relies on Technavio's comprehensive coverage, extensive research, and actionable market insights to identify opportunities in existing and potential markets and assess their competitive positions within changing market scenarios.
Contact
Technavio Research
Jesse Maida
US: +1 844 364 1100
UK: +44 203 893 3200
Email: [email protected]
Website: www.technavio.com/
SOURCE Technavio
For more details,please visit the original website
The content of the article does not represent any opinions of Synapse and its affiliated companies. If there is any copyright infringement or error, please contact us, and we will deal with it within 24 hours.
Organizations

Indications
Targets
-Drugs
-Chat with Hiro
Hot reports


Get started for free today!
Accelerate Strategic R&D decision making with Synapse, PatSnap’s AI-powered Connected Innovation Intelligence Platform Built for Life Sciences Professionals.
Start your data trial now!
Synapse data is also accessible to external entities via APIs or data packages. Empower better decisions with the latest in pharmaceutical intelligence.