Physiotherapy Market Size to Grow by USD 6.00 Billion | Segmented by Therapy and Geography - Global Forecast to 2026
29 Jun 2022
Collaborate
NEW YORK, June 29, 2022 /PRNewswire/ -- The
Physiotherapy Market report analyzes the market's competitive landscape and offers information on several market vendors, including-
A. Algeo Ltd., Accord Medical Products Pvt. Ltd., AmeriCare Physical Therapy, BTL Group, CB Physiotherapy, Colfax Corp., Dynatronics Corp., Elam Sports Inc., EMS Physio Ltd., Enraf Nonius BV, FullMotion Physical Therapy, Gryt Inc., GymnaUniphy NV, HMS Group, Mettler Electronics Corp., Minsu Healing Oasis LLC, Patterson Companies Inc., PT Health, Rehab Alternatives PLLC, and Zynex Inc.
Preview
Source: PRNewswire
Technavio has announced its latest market research report titled Physiotherapy Market by Therapy and Geography - Forecast and Analysis 2022-2026
Algeos.com - The company offers physiotherapy products such as foot orthotics and mobile podiatry.
Accordmedicalproducts.com - The company offers physiotherapy products such as hydro therapy equipments, heat and cold therapy, and electrotherapy equipments.
Americarept.com - The company offers physiotherapy services such as occupational therapy, home care, and telehealth.
Moreover, the physiotherapy market is
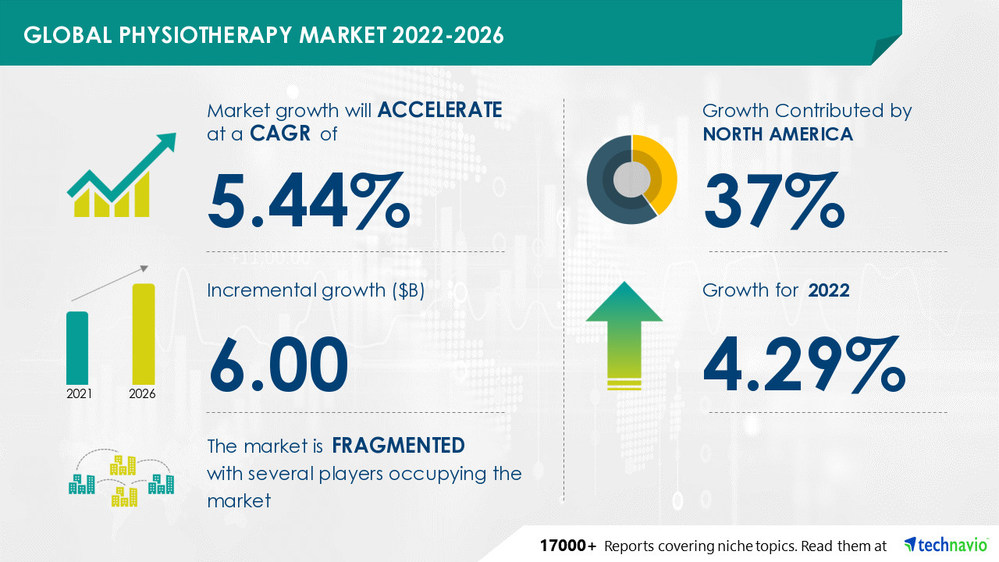
fragmented and the vendors are deploying growth strategies such as
focusing on M&A activities to compete in the market.
Learn more about the additional insights impacting the future of the market and the positive and negative consequences on the businesses.
Download Sample Report
The Physiotherapy Market value is set to
grow by USD 6.00 billion, progressing at a CAGR of 5.44% from 2021 to 2026, as per the latest report by Technavio.
Physiotherapy Market: Growing Number of Healthcare Providers to Drive the Market Growth
The rising cases of chronic diseases, medical emergencies, epidemics, and short-term and long-term disabilities that are increasing with the growth of the population are creating an increase in the number of healthcare providers.
The physiotherapy products and therapies are used in hospitals and healthcare services for the treatment of various medical conditions during the recovery phase. To meet the increased demand, healthcare providers are expanding their capabilities in terms of services, equipment, and products leading to higher opportunities for the manufacturers and suppliers of these products.
The suppliers and manufacturers are investing funds to enter new markets or to expand the existing ones to cater to these end-users. Thus, the increased revenue will drive the physiotherapy market during the forecast period.
Physiotherapy Market: Less Insurance Coverage and Medical Reimbursement to Challenge the Market Growth
Less structured government policies in developing countries prevent patients and healthcare users from availing of medical reimbursements and modern healthcare facilities.
The low patient count reduces the use of physiotherapy services owing to the reduced consumption of physiotherapy equipment. The private healthcare providers, having collaborations with insurance providers, find an opportunity in this market in terms of the reimbursement policies, which include payment for part of the medical bill or total medical expenses by the insurance providers.
The marginal presence of companies, corporates, and private organizations that provide medical reimbursements reduces the patient pool. This factor will impede the physiotherapy market growth during the forecast period.
More insights on the latest drivers, trends, and challenges with recommendations of relevant topics from Technavio's library of +17,000 Reports.
Buy Now
Physiotherapy Market 2022-2026: Segmentation
Geography
North America
Europe
Asia
Rest of World (ROW)
37% of the market's growth will originate from North America during the forecast period.
The US and Canada are the key markets for the physiotherapy market in North America. Market growth in this region will be faster than the growth of the market in Rest of World (ROW).
The presence of well-developed healthcare facilities and the higher disposable income of people will facilitate the physiotherapy market growth in North America over the forecast period.
Therapy
Therapies
Others
The physiotherapy market share growth by the therapies segment will be significant during the forecast period.
Physiotherapy practitioners use various therapies such as hydrotherapy, cryotherapy, and heat therapy. These practitioners not only operate through hospitals but also through various independent clinics to address patient problems and provide the required services.
The number of healthcare service providers is increasing in developed countries, such as the US and Canada, due to the higher demand for advanced healthcare facilities. Such an increasing demand for advanced healthcare facilities will drive the therapy segment growth during the forecast period.
Gain further insights on the market contribution & share of various segments & regions –
View Sample Report
Physiotherapy Market 2022-2026: Scope
Our market report covers the following areas:
Physiotherapy Market size
Physiotherapy Market trends
Physiotherapy Market analysis
Physiotherapy Market 2022-2026: Key Highlights
CAGR of the market during the forecast period 2022-2026
Detailed information on factors that will assist physiotherapy market growth during the next five years
Estimation of the physiotherapy market size and its contribution to the parent market
Predictions on upcoming trends and changes in consumer behavior
The growth of the physiotherapy market
Analysis of the market's competitive landscape and detailed information on vendors
Comprehensive details of factors that will challenge the growth of physiotherapy market vendors
Related Reports:
Physiotherapy Equipment Market by Application and Geography - Forecast and Analysis 2021-2025: The physiotherapy equipment market share should rise by USD 7.32 million from 2021 to 2025 at a CAGR of 7.40%. Furthermore, this report extensively covers market segmentation by application (musculoskeletal, cardiovascular and pulmonary, neurological, pediatric, and others) and geography (North America, Europe, Asia, and ROW).
Find More Exclusive Research Insights Here
Lateral Epicondylitis Treatment Market by Type and Geography - Forecast and Analysis 2021-2025: The lateral epicondylitis treatment market share is expected to increase by USD 1.91 billion from 2020 to 2025, and the market's growth momentum will accelerate at a CAGR of 4%. The rising awareness about lateral epicondylitis is notably driving the lateral epicondylitis treatment market growth, although factors such as lack of approved treatment may impede the market growth.
Find More Exclusive Research Insights Here
Table of Contents:
1 Executive Summary
1.1 Market overview
Exhibit 01: Executive Summary – Chart on Market Overview
Exhibit 02: Executive Summary – Data Table on Market Overview
Exhibit 03: Executive Summary – Chart on Global Market Characteristics
Exhibit 04: Executive Summary – Chart on Market by Geography
Exhibit 05: Executive Summary – Chart on Market Segmentation by Therapy
Exhibit 06: Executive Summary – Chart on Incremental Growth
Exhibit 07: Executive Summary – Data Table on Incremental Growth
Exhibit 08: Executive Summary – Chart on Vendor Market Positioning
2 Market Landscape
2.1 Market ecosystem
Exhibit 09: Parent market
Exhibit 10: Market Characteristics
3 Market Sizing
3.1 Market definition
Exhibit 11: Offerings of vendors included in the market definition
3.2 Market segment analysis
Exhibit 12: Market segments
3.3 Market size 2021
3.4 Market outlook: Forecast for 2021-2026
Exhibit 13: Chart on Global - Market size and forecast 2021-2026 ($ million)
Exhibit 14: Data Table on Global - Market size and forecast 2021-2026 ($ million)
Exhibit 15: Chart on Global Market: Year-over-year growth 2021-2026 (%)
Exhibit 16: Data Table on Global Market: Year-over-year growth 2021-2026 (%)
4 Five Forces Analysis
4.1 Five forces summary
Exhibit 17: Five forces analysis - Comparison between 2021 and 2026
4.2 Bargaining power of buyers
Exhibit 18: Chart on Bargaining power of buyers – Impact of key factors 2021 and 2026
4.3 Bargaining power of suppliers
Exhibit 19: Bargaining power of suppliers – Impact of key factors in 2021 and 2026
4.4 Threat of new entrants
Exhibit 20: Threat of new entrants – Impact of key factors in 2021 and 2026
4.5 Threat of substitutes
Exhibit 21: Threat of substitutes – Impact of key factors in 2021 and 2026
4.6 Threat of rivalry
Exhibit 22: Threat of rivalry – Impact of key factors in 2021 and 2026
4.7 Market condition
Exhibit 23: Chart on Market condition - Five forces 2021 and 2026
5 Market Segmentation by Therapy
5.1 Market segments
Exhibit 24: Chart on Therapy - Market share 2021-2026 (%)
Exhibit 25: Data Table on Therapy - Market share 2021-2026 (%)
5.2 Comparison by Therapy
Exhibit 26: Chart on Comparison by Therapy
Exhibit 27: Data Table on Comparison by Therapy
5.3 Therapies - Market size and forecast 2021-2026
Exhibit 28: Chart on Therapies - Market size and forecast 2021-2026 ($ million)
Exhibit 29: Data Table on Therapies - Market size and forecast 2021-2026 ($ million)
Exhibit 30: Chart on Therapies - Year-over-year growth 2021-2026 (%)
Exhibit 31: Data Table on Therapies - Year-over-year growth 2021-2026 (%)
5.4 Equipment - Market size and forecast 2021-2026
Exhibit 32: Chart on Equipment - Market size and forecast 2021-2026 ($ million)
Exhibit 33: Data Table on Equipment - Market size and forecast 2021-2026 ($ million)
Exhibit 34: Chart on Equipment - Year-over-year growth 2021-2026 (%)
Exhibit 35: Data Table on Equipment - Year-over-year growth 2021-2026 (%)
5.5 Others - Market size and forecast 2021-2026
Exhibit 36: Chart on Others - Market size and forecast 2021-2026 ($ million)
Exhibit 37: Data Table on Others - Market size and forecast 2021-2026 ($ million)
Exhibit 38: Chart on Others - Year-over-year growth 2021-2026 (%)
Exhibit 39: Data Table on Others - Year-over-year growth 2021-2026 (%)
5.6 Market opportunity by Therapy
Exhibit 40: Market opportunity by Therapy ($ million)
6 Customer Landscape
6.1 Customer landscape overview
Exhibit 41: Analysis of price sensitivity, lifecycle, customer purchase basket, adoption rates, and purchase criteria
7 Geographic Landscape
7.1 Geographic segmentation
Exhibit 42: Chart on Market share by geography 2021-2026 (%)
Exhibit 43: Data Table on Market share by geography 2021-2026 (%)
7.2 Geographic comparison
Exhibit 44: Chart on Geographic comparison
Exhibit 45: Data Table on Geographic comparison
7.3 North America - Market size and forecast 2021-2026
Exhibit 46: Chart on North America - Market size and forecast 2021-2026 ($ million)
Exhibit 47: Data Table on North America - Market size and forecast 2021-2026 ($ million)
Exhibit 48: Chart on North America - Year-over-year growth 2021-2026 (%)
Exhibit 49: Data Table on North America - Year-over-year growth 2021-2026 (%)
7.4 Europe - Market size and forecast 2021-2026
Exhibit 50: Chart on Europe - Market size and forecast 2021-2026 ($ million)
Exhibit 51: Data Table on Europe - Market size and forecast 2021-2026 ($ million)
Exhibit 52: Chart on Europe - Year-over-year growth 2021-2026 (%)
Exhibit 53: Data Table on Europe - Year-over-year growth 2021-2026 (%)
7.5 Asia - Market size and forecast 2021-2026
Exhibit 54: Chart on Asia - Market size and forecast 2021-2026 ($ million)
Exhibit 55: Data Table on Asia - Market size and forecast 2021-2026 ($ million)
Exhibit 56: Chart on Asia - Year-over-year growth 2021-2026 (%)
Exhibit 57: Data Table on Asia - Year-over-year growth 2021-2026 (%)
7.6 Rest of World (ROW) - Market size and forecast 2021-2026
Exhibit 58: Chart on Rest of World (ROW) - Market size and forecast 2021-2026 ($ million)
Exhibit 59: Data Table on Rest of World (ROW) - Market size and forecast 2021-2026 ($ million)
Exhibit 60: Chart on Rest of World (ROW) - Year-over-year growth 2021-2026 (%)
Exhibit 61: Data Table on Rest of World (ROW) - Year-over-year growth 2021-2026 (%)
7.7 US - Market size and forecast 2021-2026
Exhibit 62: Chart on US - Market size and forecast 2021-2026 ($ million)
Exhibit 63: Data Table on US - Market size and forecast 2021-2026 ($ million)
Exhibit 64: Chart on US - Year-over-year growth 2021-2026 (%)
Exhibit 65: Data Table on US - Year-over-year growth 2021-2026 (%)
7.8 Denmark - Market size and forecast 2021-2026
Exhibit 66: Chart on Denmark - Market size and forecast 2021-2026 ($ million)
Exhibit 67: Data Table on Denmark - Market size and forecast 2021-2026 ($ million)
Exhibit 68: Chart on Denmark - Year-over-year growth 2021-2026 (%)
Exhibit 69: Data Table on Denmark - Year-over-year growth 2021-2026 (%)
7.9 China - Market size and forecast 2021-2026
Exhibit 70: Chart on China - Market size and forecast 2021-2026 ($ million)
Exhibit 71: Data Table on China - Market size and forecast 2021-2026 ($ million)
Exhibit 72: Chart on China - Year-over-year growth 2021-2026 (%)
Exhibit 73: Data Table on China - Year-over-year growth 2021-2026 (%)
7.10 Canada - Market size and forecast 2021-2026
Exhibit 74: Chart on Canada - Market size and forecast 2021-2026 ($ million)
Exhibit 75: Data Table on Canada - Market size and forecast 2021-2026 ($ million)
Exhibit 76: Chart on Canada - Year-over-year growth 2021-2026 (%)
Exhibit 77: Data Table on Canada - Year-over-year growth 2021-2026 (%)
7.11 India - Market size and forecast 2021-2026
Exhibit 78: Chart on India - Market size and forecast 2021-2026 ($ million)
Exhibit 79: Data Table on India - Market size and forecast 2021-2026 ($ million)
Exhibit 80: Chart on India - Year-over-year growth 2021-2026 (%)
Exhibit 81: Data Table on India - Year-over-year growth 2021-2026 (%)
7.12 Market opportunity by geography
Exhibit 82: Market opportunity by geography ($ million)
8 Drivers, Challenges, and Trends
8.1 Market drivers
8.2 Market challenges
8.3 Impact of drivers and challenges
Exhibit 83: Impact of drivers and challenges in 2021 and 2026
8.4 Market trends
9 Vendor Landscape
9.1 Overview
9.2 Vendor landscape
Exhibit 84: Overview on Criticality of inputs and Factors of differentiation
9.3 Landscape disruption
Exhibit 85: Overview on factors of disruption
9.4 Industry risks
Exhibit 86: Impact of key risks on business
10 Vendor Analysis
10.1 Vendors covered
Exhibit 87: Vendors covered
10.2 Market positioning of vendors
Exhibit 88: Matrix on vendor position and classification
10.3 A. Algeo Ltd.
Exhibit 89: A. Algeo Ltd. - Overview
Exhibit 90: A. Algeo Ltd. - Product / Service
Exhibit 91: A. Algeo Ltd. - Key offerings
10.4 Accord Medical Products Pvt. Ltd.
Exhibit 92: Accord Medical Products Pvt. Ltd. - Overview
Exhibit 93: Accord Medical Products Pvt. Ltd. - Product / Service
Exhibit 94: Accord Medical Products Pvt. Ltd. - Key offerings
10.5 AmeriCare Physical Therapy
Exhibit 95: AmeriCare Physical Therapy - Overview
Exhibit 96: AmeriCare Physical Therapy - Product / Service
Exhibit 97: AmeriCare Physical Therapy - Key offerings
10.6 BTL Group
Exhibit 98: BTL Group - Overview
Exhibit 99: BTL Group - Product / Service
Exhibit 100: BTL Group - Key offerings
10.7 Colfax Corp.
Exhibit 101: Colfax Corp. - Overview
Exhibit 102: Colfax Corp. - Business segments
Exhibit 103: Colfax Corp. - Key news
Exhibit 104: Colfax Corp. - Key offerings
Exhibit 105: Colfax Corp. - Segment focus
10.8 Dynatronics Corp.
Exhibit 106: Dynatronics Corp. - Overview
Exhibit 107: Dynatronics Corp. - Business segments
Exhibit 108: Dynatronics Corp. - Key offerings
Exhibit 109: Dynatronics Corp. - Segment focus
10.9 Elam Sports Inc.
Exhibit 110: Elam Sports Inc. - Overview
Exhibit 111: Elam Sports Inc. - Product / Service
Exhibit 112: Elam Sports Inc. - Key offerings
10.10 EMS Physio Ltd.
Exhibit 113: EMS Physio Ltd. - Overview
Exhibit 114: EMS Physio Ltd. - Product / Service
Exhibit 115: EMS Physio Ltd. - Key offerings
10.11 Enraf Nonius BV
Exhibit 116: Enraf Nonius BV - Overview
Exhibit 117: Enraf Nonius BV - Product / Service
Exhibit 118: Enraf Nonius BV - Key offerings
10.12 FullMotion Physical Therapy
Exhibit 119: FullMotion Physical Therapy - Overview
Exhibit 120: FullMotion Physical Therapy - Product / Service
Exhibit 121: FullMotion Physical Therapy - Key offerings
11.1 Scope of the report
11.2 Inclusions and exclusions checklist
Exhibit 122: Inclusions checklist
Exhibit 123: Exclusions checklist
11.3 Currency conversion rates for US$
Exhibit 124: Currency conversion rates for US$
11.4 Research methodology
Exhibit 125: Research methodology
Exhibit 126: Validation techniques employed for market sizing
Exhibit 127: Information sources
11.5 List of abbreviations
Exhibit 128: List of abbreviations
About Us
Technavio is a leading global technology research and advisory company. Their research and analysis focus on emerging market trends and provides actionable insights to help businesses identify market opportunities and develop effective strategies to optimize their market positions. With over 500 specialized analysts, Technavio's report library consists of more than 17,000 reports and counting, covering 800 technologies, spanning across 50 countries. Their client base consists of enterprises of all sizes, including more than 100 Fortune 500 companies. This growing client base relies on Technavio's comprehensive coverage, extensive research, and actionable market insights to identify opportunities in existing and potential markets and assess their competitive positions within changing market scenarios.
Contact
Technavio Research
Jesse Maida
US: +1 844 364 1100
UK: +44 203 893 3200
Email: [email protected]
Website: www.technavio.com/
SOURCE Technavio
For more details,please visit the original website
The content of the article does not represent any opinions of Synapse and its affiliated companies. If there is any copyright infringement or error, please contact us, and we will deal with it within 24 hours.
Organizations
Indications
Targets
-Drugs
-Chat with Hiro
Hot reports


Get started for free today!
Accelerate Strategic R&D decision making with Synapse, PatSnap’s AI-powered Connected Innovation Intelligence Platform Built for Life Sciences Professionals.
Start your data trial now!
Synapse data is also accessible to external entities via APIs or data packages. Empower better decisions with the latest in pharmaceutical intelligence.