Marine Pharmaceuticals Market to grow by USD 1.56 Bn; Oncology to be the largest revenue generating segment - Technavio
28 Oct 2022
AntibodyVaccine
NEW YORK, Oct. 28, 2022 /PRNewswire/ -- The "
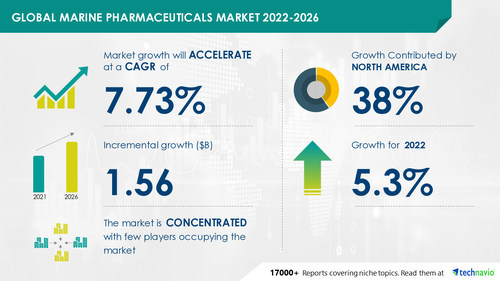
Marine Pharmaceuticals Market by Product and Geography - Forecast and Analysis 2022-2026" report has been added to Technavio's offering. The market size is expected to grow by USD 1.56 billion between 2021 and 2026. In addition, the growth momentum is expected to accelerate at a CAGR of 7.73% during the forecast period, according to Techanavio's latest market report estimates. This market study offers complete insights into the key revenue-generating segments, major growth regions, factors impacting the market size, and much more.
Continue Reading
Preview
Source: PRNewswire
Technavio has announced its latest market research report titled Global Marine Pharmaceuticals Market 2022-2026
This report offers an up-to-date analysis regarding the latest trends and drivers, the current market scenario, and the overall market environment. Read our FREE PDF Sample Report
Marine Pharmaceuticals Market 2022-2026: Vendor Analysis and Scope
To help businesses improve their market position, the marine pharmaceuticals market provides a detailed analysis of around 25 vendors operating in the market. Some of these vendors include Amway Corp., BASF SE, BeyondSpring Inc., BioMarin Pharmaceutical Inc., Bristol Myers Squibb Co., Eisai Co. Ltd., GlaxoSmithKline Plc, Guardian Industries Corp., Jazz Pharmaceuticals Plc, Koninklijke DSM NV, Merck KGaA, Nordic Naturals Inc., Pelagia EPAX, Pfizer Inc., Pharma Marine AS, PharmaMar SA, Seagen Inc., and Croda International Plc.
The report also covers the following areas:
Marine Pharmaceuticals Market Size
Marine Pharmaceuticals Market Trends
Marine Pharmaceuticals Market Industry Analysis
Get lifetime access to our Technavio Insights. Subscribe now to our most popular "Basic Plan" billed annually at USD 5000. View 100 reports monthly and download 5 reports per month!
Marine Pharmaceuticals Market 2022-2026: Segmentation
Product
Oncology
Others
The oncology segment will be the largest contributor to market growth during the forecast period. Currently, the development of checkpoint inhibitors is gaining momentum. These are therapeutic antibodies that facilitate or enhance an immune response against tumor cells. Also, there are several drug candidates in clinical trials, which are expected to drive the growth of the market during the forecast period. In addition, the increasing availability and expansion of the indications by the US FDA are expected to drive the growth of the oncology segment of the global marine pharmaceuticals market during the forecast period.
Geography
North America
Europe
Asia
Rest Of World (ROW)
North America will account for 38% of the market's growth during the forecast period. The growth of the regional market can be attributed to the high prevalence of various types of cancer and the increased availability of various marine pharmaceutical drugs for the treatment of different forms of carcinoma, pain, and CVD. The US and Canada are the key markets for marine pharmaceuticals in North America. Market growth in this region will be faster than the growth of the market in the Rest of the World (ROW).
Learn about the contribution of each segment summarized in concise infographics and thorough descriptions. View a FREE PDF Sample Report
Marine Pharmaceuticals Market 2022-2026: Key Highlights
CAGR of the market during the forecast period 2022-2026
Detailed information on factors that will assist marine pharmaceuticals market growth during the next five years
Estimation of the marine pharmaceuticals market size and its contribution to the parent market
Predictions on upcoming trends and changes in consumer behavior
The growth of the marine pharmaceuticals market
Analysis of the market's competitive landscape and detailed information on vendors
Comprehensive details of factors that will challenge the growth of marine pharmaceuticals market vendors
Buy Report Now
Related Reports:
Global Mono Vaccine Market 2022-2026: The global mono vaccine market is segmented by type (meningococcal vaccine, Japanese encephalitis vaccine, hepatitis vaccine, yellow fever vaccine, and others) and geography (North America, Europe, Asia, and the Rest of the World (ROW)). The meningococcal vaccine segment will generate maximum revenue in the market. North America will account for a significant market share.
View Report Snapshot Here
Global Nootropics Market 2022-2026: The global nootropics market is segmented by formulation (capsules, powder, drinks, and others) and geography (North America, Europe, Asia, and the Rest of the World (ROW)). The capsules segment will generate maximum revenue in the market. North America will account for a significant market share.
View Report Snapshot Here
Table of contents:
1 Executive Summary
1.1 Market overview
Exhibit 01: Executive Summary – Chart on Market Overview
Exhibit 02: Executive Summary – Data Table on Market Overview
Exhibit 03: Executive Summary – Chart on Global Market Characteristics
Exhibit 04: Executive Summary – Chart on Market by Geography
Exhibit 05: Executive Summary – Chart on Market Segmentation by Product
Exhibit 06: Executive Summary – Chart on Incremental Growth
Exhibit 07: Executive Summary – Data Table on Incremental Growth
Exhibit 08: Executive Summary – Chart on Vendor Market Positioning
2 Market Landscape
2.1 Market ecosystem
Exhibit 09: Parent market
Exhibit 10: Market Characteristics
3 Market Sizing
3.1 Market definition
Exhibit 11: Offerings of vendors included in the market definition
3.2 Market segment analysis
Exhibit 12: Market segments
3.3 Market size 2021
3.4 Market outlook: Forecast for 2021-2026
Exhibit 13: Chart on Global - Market size and forecast 2021-2026 ($ million)
Exhibit 14: Data Table on Global - Market size and forecast 2021-2026 ($ million)
Exhibit 15: Chart on Global Market: Year-over-year growth 2021-2026 (%)
Exhibit 16: Data Table on Global Market: Year-over-year growth 2021-2026 (%)
4 Five Forces Analysis
4.1 Five forces summary
Exhibit 17: Five forces analysis - Comparison between 2021 and 2026
4.2 Bargaining power of buyers
Exhibit 18: Chart on Bargaining power of buyers – Impact of key factors 2021 and 2026
4.3 Bargaining power of suppliers
Exhibit 19: Bargaining power of suppliers – Impact of key factors in 2021 and 2026
4.4 Threat of new entrants
Exhibit 20: Threat of new entrants – Impact of key factors in 2021 and 2026
4.5 Threat of substitutes
Exhibit 21: Threat of substitutes – Impact of key factors in 2021 and 2026
4.6 Threat of rivalry
Exhibit 22: Threat of rivalry – Impact of key factors in 2021 and 2026
4.7 Market condition
Exhibit 23: Chart on Market condition - Five forces 2021 and 2026
5 Market Segmentation by Product
5.1 Market segments
Exhibit 24: Chart on Product - Market share 2021-2026 (%)
Exhibit 25: Data Table on Product - Market share 2021-2026 (%)
5.2 Comparison by Product
Exhibit 26: Chart on Comparison by Product
Exhibit 27: Data Table on Comparison by Product
5.3 Oncology - Market size and forecast 2021-2026
Exhibit 28: Chart on Oncology - Market size and forecast 2021-2026 ($ million)
Exhibit 29: Data Table on Oncology - Market size and forecast 2021-2026 ($ million)
Exhibit 30: Chart on Oncology - Year-over-year growth 2021-2026 (%)
Exhibit 31: Data Table on Oncology - Year-over-year growth 2021-2026 (%)
5.4 Cardiovascular - Market size and forecast 2021-2026
Exhibit 32: Chart on Cardiovascular - Market size and forecast 2021-2026 ($ million)
Exhibit 33: Data Table on Cardiovascular - Market size and forecast 2021-2026 ($ million)
Exhibit 34: Chart on Cardiovascular - Year-over-year growth 2021-2026 (%)
Exhibit 35: Data Table on Cardiovascular - Year-over-year growth 2021-2026 (%)
5.5 Anti-infectives - Market size and forecast 2021-2026
Exhibit 36: Chart on Anti-infectives - Market size and forecast 2021-2026 ($ million)
Exhibit 37: Data Table on Anti-infectives - Market size and forecast 2021-2026 ($ million)
Exhibit 38: Chart on Anti-infectives - Year-over-year growth 2021-2026 (%)
Exhibit 39: Data Table on Anti-infectives - Year-over-year growth 2021-2026 (%)
5.6 Others - Market size and forecast 2021-2026
Exhibit 40: Chart on Others - Market size and forecast 2021-2026 ($ million)
Exhibit 41: Data Table on Others - Market size and forecast 2021-2026 ($ million)
Exhibit 42: Chart on Others - Year-over-year growth 2021-2026 (%)
Exhibit 43: Data Table on Others - Year-over-year growth 2021-2026 (%)
5.7 Market opportunity by Product
Exhibit 44: Market opportunity by Product ($ million)
6 Customer Landscape
6.1 Customer landscape overview
Exhibit 45: Analysis of price sensitivity, lifecycle, customer purchase basket, adoption rates, and purchase criteria
7 Geographic Landscape
7.1 Geographic segmentation
Exhibit 46: Chart on Market share by geography 2021-2026 (%)
Exhibit 47: Data Table on Market share by geography 2021-2026 (%)
7.2 Geographic comparison
Exhibit 48: Chart on Geographic comparison
Exhibit 49: Data Table on Geographic comparison
7.3 North America - Market size and forecast 2021-2026
Exhibit 50: Chart on North America - Market size and forecast 2021-2026 ($ million)
Exhibit 51: Data Table on North America - Market size and forecast 2021-2026 ($ million)
Exhibit 52: Chart on North America - Year-over-year growth 2021-2026 (%)
Exhibit 53: Data Table on North America - Year-over-year growth 2021-2026 (%)
7.4 Europe - Market size and forecast 2021-2026
Exhibit 54: Chart on Europe - Market size and forecast 2021-2026 ($ million)
Exhibit 55: Data Table on Europe - Market size and forecast 2021-2026 ($ million)
Exhibit 56: Chart on Europe - Year-over-year growth 2021-2026 (%)
Exhibit 57: Data Table on Europe - Year-over-year growth 2021-2026 (%)
7.5 Asia - Market size and forecast 2021-2026
Exhibit 58: Chart on Asia - Market size and forecast 2021-2026 ($ million)
Exhibit 59: Data Table on Asia - Market size and forecast 2021-2026 ($ million)
Exhibit 60: Chart on Asia - Year-over-year growth 2021-2026 (%)
Exhibit 61: Data Table on Asia - Year-over-year growth 2021-2026 (%)
7.6 Rest of World (ROW) - Market size and forecast 2021-2026
Exhibit 62: Chart on Rest of World (ROW) - Market size and forecast 2021-2026 ($ million)
Exhibit 63: Data Table on Rest of World (ROW) - Market size and forecast 2021-2026 ($ million)
Exhibit 64: Chart on Rest of World (ROW) - Year-over-year growth 2021-2026 (%)
Exhibit 65: Data Table on Rest of World (ROW) - Year-over-year growth 2021-2026 (%)
7.7 US - Market size and forecast 2021-2026
Exhibit 66: Chart on US - Market size and forecast 2021-2026 ($ million)
Exhibit 67: Data Table on US - Market size and forecast 2021-2026 ($ million)
Exhibit 68: Chart on US - Year-over-year growth 2021-2026 (%)
Exhibit 69: Data Table on US - Year-over-year growth 2021-2026 (%)
7.8 Germany - Market size and forecast 2021-2026
Exhibit 70: Chart on Germany - Market size and forecast 2021-2026 ($ million)
Exhibit 71: Data Table on Germany - Market size and forecast 2021-2026 ($ million)
Exhibit 72: Chart on Germany - Year-over-year growth 2021-2026 (%)
Exhibit 73: Data Table on Germany - Year-over-year growth 2021-2026 (%)
7.9 China - Market size and forecast 2021-2026
Exhibit 74: Chart on China - Market size and forecast 2021-2026 ($ million)
Exhibit 75: Data Table on China - Market size and forecast 2021-2026 ($ million)
Exhibit 76: Chart on China - Year-over-year growth 2021-2026 (%)
Exhibit 77: Data Table on China - Year-over-year growth 2021-2026 (%)
7.10 UK - Market size and forecast 2021-2026
Exhibit 78: Chart on UK - Market size and forecast 2021-2026 ($ million)
Exhibit 79: Data Table on UK - Market size and forecast 2021-2026 ($ million)
Exhibit 80: Chart on UK - Year-over-year growth 2021-2026 (%)
Exhibit 81: Data Table on UK - Year-over-year growth 2021-2026 (%)
7.11 Canada - Market size and forecast 2021-2026
Exhibit 82: Chart on Canada - Market size and forecast 2021-2026 ($ million)
Exhibit 83: Data Table on Canada - Market size and forecast 2021-2026 ($ million)
Exhibit 84: Chart on Canada - Year-over-year growth 2021-2026 (%)
Exhibit 85: Data Table on Canada - Year-over-year growth 2021-2026 (%)
7.12 Market opportunity by geography
Exhibit 86: Market opportunity by geography ($ million)
8 Drivers, Challenges, and Trends
8.1 Market drivers
8.2 Market challenges
8.3 Impact of drivers and challenges
Exhibit 87: Impact of drivers and challenges in 2021 and 2026
8.4 Market trends
9 Vendor Landscape
9.1 Overview
9.2 Vendor landscape
Exhibit 88: Overview on Criticality of inputs and Factors of differentiation
9.3 Landscape disruption
Exhibit 89: Overview on factors of disruption
9.4 Industry risks
Exhibit 90: Impact of key risks on business
10 Vendor Analysis
10.1 Vendors covered
Exhibit 91: Vendors covered
10.2 Market positioning of vendors
Exhibit 92: Matrix on vendor position and classification
10.3 BeyondSpring Inc.
Exhibit 93: BeyondSpring Inc. - Overview
Exhibit 94: BeyondSpring Inc. - Product / Service
Exhibit 95: BeyondSpring Inc. - Key offerings
Exhibit 96: BioMarin Pharmaceutical Inc. - Overview
Exhibit 97: BioMarin Pharmaceutical Inc. - Product / Service
Exhibit 98: BioMarin Pharmaceutical Inc. - Key offerings
Exhibit 99: Bristol Myers Squibb Co. - Overview
Exhibit 100: Bristol Myers Squibb Co. - Product / Service
Exhibit 101: Bristol Myers Squibb Co. - Key offerings
10.6 Eisai Co. Ltd.
Exhibit 102: Eisai Co. Ltd. - Overview
Exhibit 103: Eisai Co. Ltd. - Business segments
Exhibit 104: Eisai Co. Ltd. - Key offerings
Exhibit 105: Eisai Co. Ltd. - Segment focus
10.7 GlaxoSmithKline Plc
Exhibit 106: GlaxoSmithKline Plc - Overview
Exhibit 107: GlaxoSmithKline Plc - Business segments
Exhibit 108: GlaxoSmithKline Plc - Key news
Exhibit 109: GlaxoSmithKline Plc - Key offerings
Exhibit 110: GlaxoSmithKline Plc - Segment focus
Exhibit 111: Jazz Pharmaceuticals Plc - Overview
Exhibit 112: Jazz Pharmaceuticals Plc - Product / Service
Exhibit 113: Jazz Pharmaceuticals Plc - Key news
Exhibit 114: Jazz Pharmaceuticals Plc - Key offerings
10.9 Nordic Naturals Inc.
Exhibit 115: Nordic Naturals Inc. - Overview
Exhibit 116: Nordic Naturals Inc. - Product / Service
Exhibit 117: Nordic Naturals Inc. - Key offerings
10.10 Pfizer Inc.
Exhibit 118: Pfizer Inc. - Overview
Exhibit 119: Pfizer Inc. - Product / Service
Exhibit 120: Pfizer Inc. - Key news
Exhibit 121: Pfizer Inc. - Key offerings
10.11 PharmaMar SA
Exhibit 122: PharmaMar SA - Overview
Exhibit 123: PharmaMar SA - Business segments
Exhibit 124: PharmaMar SA - Key news
Exhibit 125: PharmaMar SA - Key offerings
Exhibit 126: PharmaMar SA - Segment focus
10.12 Seagen Inc.
Exhibit 127: Seagen Inc. - Overview
Exhibit 128: Seagen Inc. - Product / Service
Exhibit 129: Seagen Inc. - Key offerings
11.1 Scope of the report
11.2 Inclusions and exclusions checklist
Exhibit 130: Inclusions checklist
Exhibit 131: Exclusions checklist
11.3 Currency conversion rates for US$
Exhibit 132: Currency conversion rates for US$
11.4 Research methodology
Exhibit 133: Research methodology
Exhibit 134: Validation techniques employed for market sizing
Exhibit 135: Information sources
11.5 List of abbreviations
Exhibit 136: List of abbreviations
About Us
Technavio is a leading global technology research and advisory company. Their research and analysis focus on emerging market trends and provides actionable insights to help businesses identify market opportunities and develop effective strategies to optimize their market positions. With over 500 specialized analysts, Technavio's report library consists of more than 17,000 reports and counting, covering 800 technologies, spanning across 50 countries. Their client base consists of enterprises of all sizes, including more than 100 Fortune 500 companies. This growing client base relies on Technavio's comprehensive coverage, extensive research, and actionable market insights to identify opportunities in existing and potential markets and assess their competitive positions within changing market scenarios.
Contact
Technavio Research
Jesse Maida
US: +1 844 364 1100
UK: +44 203 893 3200
Email: [email protected]
Website: www.technavio.com/
SOURCE Technavio
For more details,please visit the original website
The content of the article does not represent any opinions of Synapse and its affiliated companies. If there is any copyright infringement or error, please contact us, and we will deal with it within 24 hours.
Organizations
Targets
-Drugs
Hot reports


Get started for free today!
Accelerate Strategic R&D decision making with Synapse, PatSnap’s AI-powered Connected Innovation Intelligence Platform Built for Life Sciences Professionals.
Start your data trial now!
Synapse data is also accessible to external entities via APIs or data packages. Leverages most recent intelligence information, enabling fullest potential.