Non-melanoma Skin Cancer Market size to grow by USD 180.97 Mn with 36% of the growth to originate from North America - Technavio
19 Oct 2022
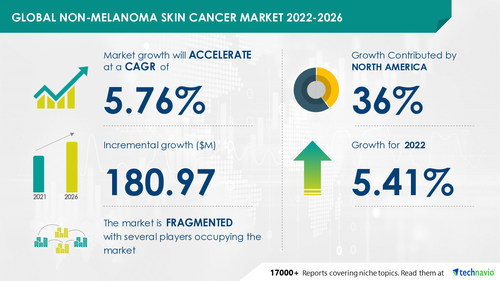
NEW YORK, Oct. 19, 2022 /PRNewswire/ -- According to the research report, the
Non-melanoma Skin Cancer Market will witness a YOY growth of 5.41 % in 2022 at a CAGR of 5.76% during the forecast period. The report is segmented by type (BCC and SCC) and geography (North America, Europe, Asia, and Rest of World (ROW)).
For more insights on YOY and CAGR,
Read FREE Sample Report.
Continue Reading
Preview
Source: PRNewswire
Technavio has announced its latest market research report titled Global Non-melanoma Skin Cancer Market 2022-2026
Non-melanoma Skin Cancer Market - Major Vendors
Non-melanoma Skin Cancer Market is fragmented and the vendors are deploying various organic and inorganic growth strategies to compete in the market.
Vendors are being driven by the intensifying market rivalry to implement a variety of growth methods, such as promotional efforts and spending on advertising, to increase the exposure of their services. In order to remain competitive in the market, several suppliers are also implementing inorganic expansion tactics like M&As.
The report analyzes the market's competitive landscape and offers information on several market vendors, including:
Eli Lilly and Co.
Merck and Co. Inc.
Find additional highlights on the growth strategies adopted by vendors and their product offerings,
Buy Sample Report
.
Non-melanoma Skin Cancer Market - Geographical Analysis
One of the most prevalent malignancies in the US is skin cancer. It is responsible for between 35% and 45% of all malignancies in Caucasians. The most prevalent form of cancer in the US and Canada is NMSC. During the projected period, the strong prevalence of BCC is anticipated to play a significant role in the market's expansion in the area.
Numerous organizations in North America, including the Skin Cancer Foundation and the American Academy of Dermatology (AAD), launch projects and campaigns to raise public awareness of the prevention and early detection of skin cancer. During the anticipated period, these variables are anticipated to fuel market expansion.
Furthermore, countries such as the US, Canada, UK, Germany, Japan, and China are expected to emerge as prominent markets for Non-melanoma Skin Cancer Market during the forecast period.
Download Free Sample Report.
Non-melanoma Skin Cancer Market - Key Segment Analysis
The BCC segment's market share rise in non-melanoma skin cancer will be high. About 80% of NMSC is made up of BCC. According to estimates, the incidence of BCC has been increasing by 5% annually in Europe and 2% annually in the US during the previous few years. Australia has the greatest proportion of BCC patients who have received a diagnosis by the age of 70 in APAC. Surgical procedures have become more common in recent years, and both the general public and doctors are becoming more aware of BCC. Despite having a low death rate, BCCs can cause significant physical damage.
Non-melanoma Skin Cancer Market - Key Drivers & Challenges
The
NMSC coverage and support is one of the major drivers fueling growth in the non-melanoma skin cancer market. Direct medical expenses for treating NMSC include pathology fees, facility fees, diagnosis fees, treatment fees, repair fees, and other incidentals. Medicare and the majority of payers reimburse the costs of Mohs surgery, excision, and destruction as part of treatment. Compared to surgery, the majority of pharmacological techniques demand significant effort and several doctor visits. Most of the medications for NMSC are paid for by the manufacturing business in the form of patient support and discount vouchers for low-income populations.
However, the market for non-melanoma skin cancer will face significant challenges due to the small number of NMSC-specific medicines in development.
Get a free sample
for highlights on market Drivers & Challenges affecting the Non-melanoma Skin Cancer Market.
Related Reports:
Polycystic Kidney Disease Drugs Market by Type and Geography - Forecast and Analysis 2022-2026: The high prevalence of chronic kidney diseases is notably driving the polycystic kidney disease drugs market growth. The report extensively covers polycystic kidney disease drugs market segmentation by type (ADPKD and ARPKD) and geography (North America, Europe, Asia, and Rest of World (ROW)).
Breast Cancer Therapeutics Market by Product and Geography - 2022-2026: The rising prevalence of breast cancer is notably driving the breast cancer therapeutics market growth. The report extensively covers the breast cancer therapeutics market segmentation by product (targeted therapy, hormonal therapy, and chemotherapy) and geography (North America, Europe, Asia, and the Rest of the World (ROW)).
Table of Contents
1 Executive Summary
1.1 Market Overview
Exhibit 01: Executive Summary – Chart on Market Overview
Exhibit 02: Executive Summary – Data Table on Market Overview
Exhibit 03: Executive Summary – Chart on Global Market Characteristics
Exhibit 04: Executive Summary – Chart on Market by Geography
Exhibit 05: Executive Summary – Chart on Market Segmentation by Type
Exhibit 06: Executive Summary – Chart on Incremental Growth
Exhibit 07: Executive Summary – Data Table on Incremental Growth
Exhibit 08: Executive Summary – Chart on Vendor Market Positioning
2 Market Landscape
2.1 Market ecosystem
Exhibit 09: Parent market
Exhibit 10: Market Characteristics
3 Market Sizing
3.1 Market definition
Exhibit 11: Offerings of vendors included in the market definition
3.2 Market segment analysis
Exhibit 12: Market segments
3.3 Market size 2021
3.4 Market outlook: Forecast for 2021-2026
Exhibit 13: Chart on Global - Market size and forecast 2021-2026 ($ million)
Exhibit 14: Data Table on Global - Market size and forecast 2021-2026 ($ million)
Exhibit 15: Chart on Global Market: Year-over-year growth 2021-2026 (%)
Exhibit 16: Data Table on Global Market: Year-over-year growth 2021-2026 (%)
4 Five Forces Analysis
4.1 Five forces summary
Exhibit 17: Five forces analysis - Comparison between2021 and 2026
4.2 Bargaining power of buyers
Exhibit 18: Chart on Bargaining power of buyers – Impact of key factors 2021 and 2026
4.3 Bargaining power of suppliers
Exhibit 19: Bargaining power of suppliers – Impact of key factors in 2021 and 2026
4.4 Threat of new entrants
Exhibit 20: Threat of new entrants – Impact of key factors in 2021 and 2026
4.5 Threat of substitutes
Exhibit 21: Threat of substitutes – Impact of key factors in 2021 and 2026
4.6 Threat of rivalry
Exhibit 22: Threat of rivalry – Impact of key factors in 2021 and 2026
4.7 Market condition
Exhibit 23: Chart on Market condition - Five forces 2021 and 2026
5 Market Segmentation by Type
5.1 Market segments
Exhibit 24: Chart on Type - Market share 2021-2026 (%)
Exhibit 25: Data Table on Type - Market share 2021-2026 (%)
5.2 Comparison by Type
Exhibit 26: Chart on Comparison by Type
Exhibit 27: Data Table on Comparison by Type
5.3 BCC - Market size and forecast 2021-2026
Exhibit 28: Chart on BCC - Market size and forecast 2021-2026 ($ million)
Exhibit 29: Data Table on BCC - Market size and forecast 2021-2026 ($ million)
Exhibit 30: Chart on BCC - Year-over-year growth 2021-2026 (%)
Exhibit 31: Data Table on BCC - Year-over-year growth 2021-2026 (%)
5.4 SCC - Market size and forecast 2021-2026
Exhibit 32: Chart on SCC - Market size and forecast 2021-2026 ($ million)
Exhibit 33: Data Table on SCC - Market size and forecast 2021-2026 ($ million)
Exhibit 34: Chart on SCC - Year-over-year growth 2021-2026 (%)
Exhibit 35: Data Table on SCC - Year-over-year growth 2021-2026 (%)
5.5 Market opportunity by Type
Exhibit 36: Market opportunity by Type ($ million)
6 Customer Landscape
6.1 Customer landscape overview
Exhibit 37: Analysis of price sensitivity, lifecycle, customer purchase basket, adoption rates, and purchase criteria
7 Geographic Landscape
7.1 Geographic segmentation
Exhibit 38: Chart on Market share by geography 2021-2026 (%)
Exhibit 39: Data Table on Market share by geography 2021-2026 (%)
7.2 Geographic comparison
Exhibit 40: Chart on Geographic comparison
Exhibit 41: Data Table on Geographic comparison
7.3 North America - Market size and forecast 2021-2026
Exhibit 42: Chart on North America - Market size and forecast 2021-2026 ($ million)
Exhibit 43: Data Table on North America - Market size and forecast 2021-2026 ($ million)
Exhibit 44: Chart on North America - Year-over-year growth 2021-2026 (%)
Exhibit 45: Data Table on North America - Year-over-year growth 2021-2026 (%)
7.4 Europe - Market size and forecast 2021-2026
Exhibit 46: Chart on Europe - Market size and forecast 2021-2026 ($ million)
Exhibit 47: Data Table on Europe - Market size and forecast 2021-2026 ($ million)
Exhibit 48: Chart on Europe - Year-over-year growth 2021-2026 (%)
Exhibit 49: Data Table on Europe - Year-over-year growth 2021-2026 (%)
7.5 Asia - Market size and forecast 2021-2026
Exhibit 50: Chart on Asia - Market size and forecast 2021-2026 ($ million)
Exhibit 51: Data Table on Asia - Market size and forecast 2021-2026 ($ million)
Exhibit 52: Chart on Asia - Year-over-year growth 2021-2026 (%)
Exhibit 53: Data Table on Asia - Year-over-year growth 2021-2026 (%)
7.6 Rest of World (ROW) - Market size and forecast 2021-2026
Exhibit 54: Chart on Rest of World (ROW) - Market size and forecast 2021-2026 ($ million)
Exhibit 55: Data Table on Rest of World (ROW) - Market size and forecast 2021-2026 ($ million)
Exhibit 56: Chart on Rest of World (ROW) - Year-over-year growth 2021-2026 (%)
Exhibit 57: Data Table on Rest of World (ROW) - Year-over-year growth 2021-2026 (%)
7.7 US - Market size and forecast 2021-2026
Exhibit 58: Chart on US - Market size and forecast 2021-2026 ($ million)
Exhibit 59: Data Table on US - Market size and forecast 2021-2026 ($ million)
Exhibit 60: Chart on US - Year-over-year growth 2021-2026 (%)
Exhibit 61: Data Table on US - Year-over-year growth 2021-2026 (%)
7.8 Canada - Market size and forecast 2021-2026
Exhibit 62: Chart on Canada - Market size and forecast 2021-2026 ($ million)
Exhibit 63: Data Table on Canada - Market size and forecast 2021-2026 ($ million)
Exhibit 64: Chart on Canada - Year-over-year growth 2021-2026 (%)
Exhibit 65: Data Table on Canada - Year-over-year growth 2021-2026 (%)
7.9 UK - Market size and forecast 2021-2026
Exhibit 66: Chart on UK - Market size and forecast 2021-2026 ($ million)
Exhibit 67: Data Table on UK - Market size and forecast 2021-2026 ($ million)
Exhibit 68: Chart on UK - Year-over-year growth 2021-2026 (%)
Exhibit 69: Data Table on UK - Year-over-year growth 2021-2026 (%)
7.10 Germany - Market size and forecast 2021-2026
Exhibit 70: Chart on Germany - Market size and forecast 2021-2026 ($ million)
Exhibit 71: Data Table on Germany - Market size and forecast 2021-2026 ($ million)
Exhibit 72: Chart on Germany - Year-over-year growth 2021-2026 (%)
Exhibit 73: Data Table on Germany - Year-over-year growth 2021-2026 (%)
7.11 Japan - Market size and forecast 2021-2026
Exhibit 74: Chart on Japan - Market size and forecast 2021-2026 ($ million)
Exhibit 75: Data Table on Japan - Market size and forecast 2021-2026 ($ million)
Exhibit 76: Chart on Japan - Year-over-year growth 2021-2026 (%)
Exhibit 77: Data Table on Japan - Year-over-year growth 2021-2026 (%)
7.12 China - Market size and forecast 2021-2026
Exhibit 78: Chart on China - Market size and forecast 2021-2026 ($ million)
Exhibit 79: Data Table on China - Market size and forecast 2021-2026 ($ million)
Exhibit 80: Chart on China - Year-over-year growth 2021-2026 (%)
Exhibit 81: Data Table on China - Year-over-year growth 2021-2026 (%)
7.13 Market opportunity by geography
Exhibit 82: Market opportunity by geography ($ million)
8 Drivers, Challenges, and Trends
8.1 Market drivers
8.2 Market challenges
8.3 Impact of drivers and challenges
Exhibit 83: Impact of drivers and challenges in 2021 and 2026
8.4 Market trends
9 Vendor Landscape
9.1 Overview
9.2 Vendor landscape
Exhibit 84: Overview on Criticality of inputs and Factors of differentiation
9.3 Landscape disruption
Exhibit 85: Overview on factors of disruption
9.4 Industry risks
Exhibit 86: Impact of key risks on business
10 Vendor Analysis
10.1 Vendors covered
Exhibit 87: Vendors covered
10.2 Market positioning of vendors
Exhibit 88: Matrix on vendor position and classification
10.3 3M Corp.
Exhibit 89: 3M Corp. - Overview
Exhibit 90: 3M Corp. - Business segments
Exhibit 91: 3M Corp. - Key news
Exhibit 92: 3M Corp. - Key offerings
Exhibit 93: 3M Corp. - Segment focus
10.4 Almirall SA
Exhibit 94: Almirall SA - Overview
Exhibit 95: Almirall SA - Product / Service
Exhibit 96: Almirall SA - Key news
Exhibit 97: Almirall SA - Key offerings
Exhibit 98: Bausch Health Companies Inc. - Overview
Exhibit 99: Bausch Health Companies Inc. - Business segments
Exhibit 100: Bausch Health Companies Inc. - Key news
Exhibit 101: Bausch Health Companies Inc. - Key offerings
Exhibit 102: Bausch Health Companies Inc. - Segment focus
Exhibit 103: Bristol Myers Squibb Co. - Overview
Exhibit 104: Bristol Myers Squibb Co. - Product / Service
Exhibit 105: Bristol Myers Squibb Co. - Key offerings
10.7 Elekta AB
Exhibit 106: Elekta AB - Overview
Exhibit 107: Elekta AB - Business segments
Exhibit 108: Elekta AB - Key news
Exhibit 109: Elekta AB - Key offerings
Exhibit 110: Elekta AB - Segment focus
10.8 F. Hoffmann La Roche Ltd.
Exhibit 111: F. Hoffmann La Roche Ltd. - Overview
Exhibit 112: F. Hoffmann La Roche Ltd. - Business segments
Exhibit 113: F. Hoffmann La Roche Ltd. - Key news
Exhibit 114: F. Hoffmann La Roche Ltd. - Key offerings
Exhibit 115: F. Hoffmann La Roche Ltd. - Segment focus
10.9 Mylan N.V
Exhibit 116: Mylan N.V - Overview
Exhibit 117: Mylan N.V - Product / Service
Exhibit 118: Mylan N.V - Key offerings
Exhibit 119: Sun Pharmaceutical Industries Ltd. - Overview
Exhibit 120: Sun Pharmaceutical Industries Ltd. - Product / Service
Exhibit 121: Sun Pharmaceutical Industries Ltd. - Key offerings
Exhibit 122: Varian Medical Systems Inc. - Overview
Exhibit 123: Varian Medical Systems Inc. - Business segments
Exhibit 124: Varian Medical Systems Inc. - Key offerings
Exhibit 125: Varian Medical Systems Inc. - Segment focus
Exhibit 126: Vidac Pharma - Overview
Exhibit 127: Vidac Pharma - Product / Service
Exhibit 128: Vidac Pharma - Key offerings
11.1 Scope of the report
11.2 Inclusions and exclusions checklist
Exhibit 129: Inclusions checklist
Exhibit 130: Exclusions checklist
11.3 Currency conversion rates for US$
Exhibit 131: Currency conversion rates for US$
11.4 Research methodology
Exhibit 132: Research methodology
Exhibit 133: Validation techniques employed for market sizing
Exhibit 134: Information sources
11.5 List of abbreviations
Exhibit 135: List of abbreviations
About Us:
Technavio is a leading global technology research and advisory company. Their research and analysis focus on emerging market trends and provides actionable insights to help businesses identify market opportunities and develop effective strategies to optimize their market positions. With over 500 specialized analysts, Technavio's report library consists of more than 17,000 reports and counting, covering 800 technologies, spanning across 50 countries. Their client base consists of enterprises of all sizes, including more than 100 Fortune 500 companies. This growing client base relies on Technavio's comprehensive coverage, extensive research, and actionable market insights to identify opportunities in existing and potential markets and assess their competitive positions within changing market scenarios.
Contact
Technavio Research
Jesse Maida
US: +1 844 364 1100
UK: +44 203 893 3200
Email: [email protected]
Website: www.technavio.com/
SOURCE Technavio
For more details,please visit the original website
The content of the article does not represent any opinions of Synapse and its affiliated companies. If there is any copyright infringement or error, please contact us, and we will deal with it within 24 hours.
Organizations
Indications
Targets
-Drugs
-Hot reports


Get started for free today!
Accelerate Strategic R&D decision making with Synapse, PatSnap’s AI-powered Connected Innovation Intelligence Platform Built for Life Sciences Professionals.
Start your data trial now!
Synapse data is also accessible to external entities via APIs or data packages. Leverages most recent intelligence information, enabling fullest potential.