Antacids Market Size to Grow by USD 712.45 Million | 41% of the market growth will originate from North America| Technavio
24 Jun 2022
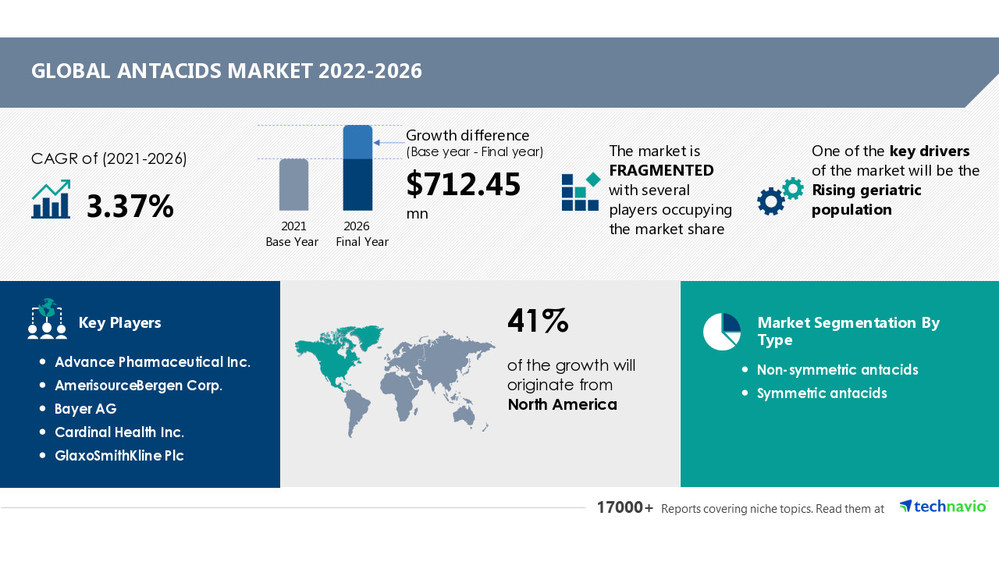
Antacids market will have AmerisourceBergen Corp., Bayer AG, and Cardinal Health Inc. as major participants
NEW YORK, June 24, 2022 /PRNewswire/ -- The latest market analysis report titled
Antacids Market by Type and Geography - Forecast and Analysis 2022-2026 has been recently added to Technavio's catalog. The report also predicts the market to witness a potential growth difference of USD 712.45 million from 2021 to 2026. The antacids market will witness an accelerating growth momentum at a CAGR of 3.37% during the forecast period. The rising geriatric population is one of the key factors influencing the market growth. In addition, growing e-commerce market is one of the key antacids market trends that is expected to impact the industry positively in the forecast period. However, one of the key challenges to the global antacids market growth is the adverse effect of prolonged use of antacids.
Preview
Source: PRNewswire
Technavio has announced its latest market research report titled Antacids Market by Type and Geography - Forecast and Analysis 2022-2026
View Market Report Sample
to get YOY and growth variance analysis
Buy Report Now
to Know more about the market scope and parent market analysis
Key Considerations for Market Forecast:
Impact of lockdowns, supply chain disruptions, demand destruction, and change in customer behavior
Optimistic, probable, and pessimistic scenarios for all markets as the impact of pandemic unfolds
Pre- as well as post-COVID-19 market estimates
Quarterly impact analysis and updates on market estimates
Top 5 Vendor Analysis of Antacids Market
The company offers various products including pharmaceuticals, over-the-counter healthcare products, home healthcare supplies, and relates equipment and services to various healthcare providers. The company offers antacids that is a naturally made water dissolving formula to cure acidity and heartburn, under the brand name of American Health Packaging.
The company offers antacids that help neutralize excess stomach acids, offering fast, effective relief from indigestion and heartburn, under the brand name of Rennie.
The company offers antacids that give relief of heartburn, sour stomach, acid indigestion and to alleviate or relieve the symptoms of gas, under the brand name of Cardinal Health.
The company offers products such as active pharmaceutical ingredients, drug delivery vehicles, hormone concentrates and over-the-counter medicines. The company offers antacids that deliver clinically proven heartburn relief, under the brand name of Humco.
Download Sample Report
for additional product offerings from each contributing vendor
Antacids Market Segment Highlights
Type
Non-symmetric Antacids: The non-systemic antacids segment is expected to grow at a moderate rate in the coming years owing to better efficacy demonstrated when used in combination. In addition, the drugs used as combination therapies minimize the adverse effects and effectively treat GERD and acid reflux.
Symmetric Antacids
Geography
North America: 41% of the market's growth will originate from North America during the forecast period. US and Canada are the key markets for antacids in North America. Market growth in this region will be faster than the growth of the market in Europe and ROW. The high prevalence of GERD for which antacids are predominantly used, the increasing preference for OTC medications, and the practice of self-medication among the population will fuel the antacids market growth in North America over the forecast period.
Europe
Asia
Rest Of World (ROW)
Request Sample Report
for more insights on each contributing segment
Reports that might interest you:
Genetic Testing Market by Product, Application, and Geography - Forecast and Analysis 2021-2025
Gene Panel Market by Product and Geography - Forecast and Analysis 2021-2025
Table of Content
1 Executive Summary
1.1 Market overview
Exhibit 01: Executive Summary – Chart on Market Overview
Exhibit 02: Executive Summary – Data Table on Market Overview
Exhibit 03: Executive Summary – Chart on Global Market Characteristics
Exhibit 04: Executive Summary – Chart on Market by Geography
Exhibit 05: Executive Summary – Chart on Market Segmentation by Type
Exhibit 06: Executive Summary – Chart on Incremental Growth
Exhibit 07: Executive Summary – Data Table on Incremental Growth
Exhibit 08: Executive Summary – Chart on Vendor Market Positioning
2 Market Landscape
2.1 Market ecosystem
Exhibit 09: Parent market
Exhibit 10: Market Characteristics
3 Market Sizing
3.1 Market definition
Exhibit 11: Offerings of vendors included in the market definition
3.2 Market segment analysis
Exhibit 12: Market segments
3.3 Market size 2021
3.4 Market outlook: Forecast for 2021-2026
Exhibit 13: Chart on Global - Market size and forecast 2021-2026 ($ million)
Exhibit 14: Data Table on Global - Market size and forecast 2021-2026 ($ million)
Exhibit 15: Chart on Global Market: Year-over-year growth 2021-2026 (%)
Exhibit 16: Data Table on Global Market: Year-over-year growth 2021-2026 (%)
4 Five Forces Analysis
4.1 Five forces summary
Exhibit 17: Five forces analysis - Comparison between 2021 and 2026
4.2 Bargaining power of buyers
Exhibit 18: Bargaining power of buyers – Impact of key factors in 2021 and 2026
4.3 Bargaining power of suppliers
Exhibit 19: Bargaining power of suppliers – Impact of key factors in 2021 and 2026
4.4 Threat of new entrants
Exhibit 20: Threat of new entrants – Impact of key factors in 2021 and 2026
4.5 Threat of substitutes
Exhibit 21: Threat of substitutes – Impact of key factors in 2021 and 2026
4.6 Threat of rivalry
Exhibit 22: Threat of rivalry – Impact of key factors in 2021 and 2026
4.7 Market condition
Exhibit 23: Chart on Market condition - Five forces 2021 and 2026
5 Market Segmentation by Type
5.1 Market segments
Exhibit 24: Chart on Type - Market share 2021-2026 (%)
Exhibit 25: Data Table on Type - Market share 2021-2026 (%)
5.2 Comparison by Type
Exhibit 26: Chart on Comparison by Type
Exhibit 27: Data Table on Comparison by Type
5.3 Non-symmetric antacids - Market size and forecast 2021-2026
Exhibit 28: Chart on Non-symmetric antacids - Market size and forecast 2021-2026 ($ million)
Exhibit 29: Data Table on Non-symmetric antacids - Market size and forecast 2021-2026 ($ million)
Exhibit 30: Chart on Non-symmetric antacids - Year-over-year growth 2021-2026 (%)
Exhibit 31: Data Table on Non-symmetric antacids - Year-over-year growth 2021-2026 (%)
5.4 Symmetric antacids - Market size and forecast 2021-2026
Exhibit 32: Chart on Symmetric antacids - Market size and forecast 2021-2026 ($ million)
Exhibit 33: Data Table on Symmetric antacids - Market size and forecast 2021-2026 ($ million)
Exhibit 34: Chart on Symmetric antacids - Year-over-year growth 2021-2026 (%)
Exhibit 35: Data Table on Symmetric antacids - Year-over-year growth 2021-2026 (%)
5.5 Market opportunity by Type
Exhibit 36: Market opportunity by Type ($ million)
6 Customer Landscape
6.1 Customer landscape overview
Exhibit 37: Analysis of price sensitivity, lifecycle, customer purchase basket, adoption rates, and purchase criteria
7 Geographic Landscape
7.1 Geographic segmentation
Exhibit 38: Chart on Market share by geography 2021-2026 (%)
Exhibit 39: Data Table on Market share by geography 2021-2026 (%)
7.2 Geographic comparison
Exhibit 40: Chart on Geographic comparison
Exhibit 41: Data Table on Geographic comparison
7.3 North America - Market size and forecast 2021-2026
Exhibit 42: Chart on North America - Market size and forecast 2021-2026 ($ million)
Exhibit 43: Data Table on North America - Market size and forecast 2021-2026 ($ million)
Exhibit 44: Chart on North America - Year-over-year growth 2021-2026 (%)
Exhibit 45: Data Table on North America - Year-over-year growth 2021-2026 (%)
7.4 Europe - Market size and forecast 2021-2026
Exhibit 46: Chart on Europe - Market size and forecast 2021-2026 ($ million)
Exhibit 47: Data Table on Europe - Market size and forecast 2021-2026 ($ million)
Exhibit 48: Chart on Europe - Year-over-year growth 2021-2026 (%)
Exhibit 49: Data Table on Europe - Year-over-year growth 2021-2026 (%)
7.5 Asia - Market size and forecast 2021-2026
Exhibit 50: Chart on Asia - Market size and forecast 2021-2026 ($ million)
Exhibit 51: Data Table on Asia - Market size and forecast 2021-2026 ($ million)
Exhibit 52: Chart on Asia - Year-over-year growth 2021-2026 (%)
Exhibit 53: Data Table on Asia - Year-over-year growth 2021-2026 (%)
7.6 Rest of World (ROW) - Market size and forecast 2021-2026
Exhibit 54: Chart on Rest of World (ROW) - Market size and forecast 2021-2026 ($ million)
Exhibit 55: Data Table on Rest of World (ROW) - Market size and forecast 2021-2026 ($ million)
Exhibit 56: Chart on Rest of World (ROW) - Year-over-year growth 2021-2026 (%)
Exhibit 57: Data Table on Rest of World (ROW) - Year-over-year growth 2021-2026 (%)
7.7 US - Market size and forecast 2021-2026
Exhibit 58: Chart on US - Market size and forecast 2021-2026 ($ million)
Exhibit 59: Data Table on US - Market size and forecast 2021-2026 ($ million)
Exhibit 60: Chart on US - Year-over-year growth 2021-2026 (%)
Exhibit 61: Data Table on US - Year-over-year growth 2021-2026 (%)
7.8 Germany - Market size and forecast 2021-2026
Exhibit 62: Chart on Germany - Market size and forecast 2021-2026 ($ million)
Exhibit 63: Data Table on Germany - Market size and forecast 2021-2026 ($ million)
Exhibit 64: Chart on Germany - Year-over-year growth 2021-2026 (%)
Exhibit 65: Data Table on Germany - Year-over-year growth 2021-2026 (%)
7.9 Canada - Market size and forecast 2021-2026
Exhibit 66: Chart on Canada - Market size and forecast 2021-2026 ($ million)
Exhibit 67: Data Table on Canada - Market size and forecast 2021-2026 ($ million)
Exhibit 68: Chart on Canada - Year-over-year growth 2021-2026 (%)
Exhibit 69: Data Table on Canada - Year-over-year growth 2021-2026 (%)
7.10 UK - Market size and forecast 2021-2026
Exhibit 70: Chart on UK - Market size and forecast 2021-2026 ($ million)
Exhibit 71: Data Table on UK - Market size and forecast 2021-2026 ($ million)
Exhibit 72: Chart on UK - Year-over-year growth 2021-2026 (%)
Exhibit 73: Data Table on UK - Year-over-year growth 2021-2026 (%)
7.11 Brazil - Market size and forecast 2021-2026
Exhibit 74: Chart on Brazil - Market size and forecast 2021-2026 ($ million)
Exhibit 75: Data Table on Brazil - Market size and forecast 2021-2026 ($ million)
Exhibit 76: Chart on Brazil - Year-over-year growth 2021-2026 (%)
Exhibit 77: Data Table on Brazil - Year-over-year growth 2021-2026 (%)
7.12 Market opportunity by geography
Exhibit 78: Market opportunity by geography ($ million)
8 Drivers, Challenges, and Trends
8.1 Market drivers
8.2 Market challenges
8.3 Impact of drivers and challenges
Exhibit 79: Impact of drivers and challenges in 2021 and 2026
8.4 Market trends
9 Vendor Landscape
9.1 Overview
9.2 Vendor landscape
Exhibit 80: Overview on Criticality of inputs and Factors of differentiation
9.3 Landscape disruption
Exhibit 81: Overview on factors of disruption
9.4 Industry risks
Exhibit 82: Impact of key risks on business
10 Vendor Analysis
10.1 Vendors covered
Exhibit 83: Vendors covered
10.2 Market positioning of vendors
Exhibit 84: Matrix on vendor position and classification
Exhibit 85: AmerisourceBergen Corp. - Overview
Exhibit 86: AmerisourceBergen Corp. - Business segments
Exhibit 87: AmerisourceBergen Corp. - Key offerings
Exhibit 88: AmerisourceBergen Corp. - Segment focus
10.4 Bayer AG
Exhibit 89: Bayer AG - Overview
Exhibit 90: Bayer AG - Business segments
Exhibit 91: Bayer AG - Key offerings
Exhibit 92: Bayer AG - Segment focus
10.5 Cardinal Health Inc.
Exhibit 93: Cardinal Health Inc. - Overview
Exhibit 94: Cardinal Health Inc. - Business segments
Exhibit 95: Cardinal Health Inc. - Key news
Exhibit 96: Cardinal Health Inc. - Key offerings
Exhibit 97: Cardinal Health Inc. - Segment focus
10.6 GlaxoSmithKline Plc
Exhibit 98: GlaxoSmithKline Plc - Overview
Exhibit 99: GlaxoSmithKline Plc - Business segments
Exhibit 100: GlaxoSmithKline Plc - Key news
Exhibit 101: GlaxoSmithKline Plc - Key offerings
Exhibit 102: GlaxoSmithKline Plc - Segment focus
Exhibit 103: Humco Holding Group Inc. - Overview
Exhibit 104: Humco Holding Group Inc. - Product / Service
Exhibit 105: Humco Holding Group Inc. - Key offerings
10.8 Johnson and Johnson
Exhibit 106: Johnson and Johnson - Overview
Exhibit 107: Johnson and Johnson - Business segments
Exhibit 108: Johnson and Johnson - Key news
Exhibit 109: Johnson and Johnson - Key offerings
Exhibit 110: Johnson and Johnson - Segment focus
10.9 Novartis AG
Exhibit 111: Novartis AG - Overview
Exhibit 112: Novartis AG - Business segments
Exhibit 113: Novartis AG - Key offerings
Exhibit 114: Novartis AG - Segment focus
10.10 Sanofi SA
Exhibit 115: Sanofi SA - Overview
Exhibit 116: Sanofi SA - Business segments
Exhibit 117: Sanofi SA - Key news
Exhibit 118: Sanofi SA - Key offerings
Exhibit 119: Sanofi SA - Segment focus
Exhibit 120: Sun Pharmaceutical Industries Ltd. - Overview
Exhibit 121: Sun Pharmaceutical Industries Ltd. - Product / Service
Exhibit 122: Sun Pharmaceutical Industries Ltd. - Key offerings
Exhibit 123: WellSpring Pharmaceutical Corp. - Overview
Exhibit 124: WellSpring Pharmaceutical Corp. - Product / Service
Exhibit 125: WellSpring Pharmaceutical Corp. - Key offerings
11.1 Scope of the report
11.2 Inclusions and exclusions checklist
Exhibit 126: Inclusions checklist
Exhibit 127: Exclusions checklist
11.3 Currency conversion rates for US$
Exhibit 128: Currency conversion rates for US$
11.4 Research methodology
Exhibit 129: Research methodology
Exhibit 130: Validation techniques employed for market sizing
Exhibit 131: Information sources
11.5 List of abbreviations
Exhibit 132: List of abbreviations
About Us
Technavio is a leading global technology research and advisory company. Their research and analysis focuses on emerging market trends and provides actionable insights to help businesses identify market opportunities and develop effective strategies to optimize their market positions. With over 500 specialized analysts, Technavio's report library consists of more than 17,000 reports and counting, covering 800 technologies, spanning across 50 countries. Their client base consists of enterprises of all sizes, including more than 100 Fortune 500 companies. This growing client base relies on Technavio's comprehensive coverage, extensive research, and actionable market insights to identify opportunities in existing and potential markets and assess their competitive positions within changing market scenarios.
Contact
Technavio Research
Jesse Maida
US: +1 844 364 1100
UK: +44 203 893 3200
Email: [email protected]
Website: www.technavio.com/
SOURCE Technavio
For more details,please visit the original website
The content of the article does not represent any opinions of Synapse and its affiliated companies. If there is any copyright infringement or error, please contact us, and we will deal with it within 24 hours.
Organizations
Targets
-Drugs
-Chat with Hiro
Hot reports


Get started for free today!
Accelerate Strategic R&D decision making with Synapse, PatSnap’s AI-powered Connected Innovation Intelligence Platform Built for Life Sciences Professionals.
Start your data trial now!
Synapse data is also accessible to external entities via APIs or data packages. Empower better decisions with the latest in pharmaceutical intelligence.