Label-free Detection (LFD) Market to grow by USD 362.6 Mn; Pharmaceutical and biotechnology companies to exhibit significant demand - Technavio
15 Nov 2022
NEW YORK, Nov. 15, 2022 /PRNewswire/ -- The "
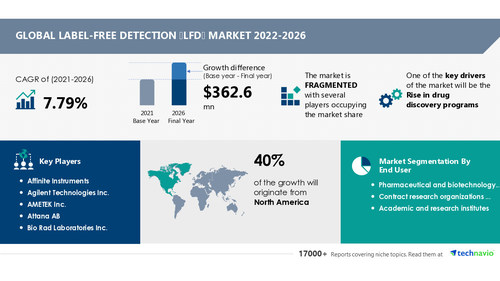
Label-free Detection (LFD) Market by End-user, Product and Geography - Forecast and Analysis 2022-2026" report has been added to Technavio's offering. The report expects the market size to grow by USD 362.6 million, accelerating at a CAGR of 7.79% during the forecast period. The report provides an up-to-date analysis regarding the current market scenario, the latest trends and drivers, and the overall market environment. Technavio offers in-depth market insights that assist global businesses to obtain growth opportunities.
Download a Free PDF Sample Report
Continue Reading
Preview
Source: PRNewswire
Technavio has announced its latest market research report titled Global Label-free Detection (LFD) Market 2022-2026
Label-free Detection (LFD) Market 2022-2026: Scope
To help businesses improve their market position, Technavio's report provides a detailed analysis of around 25 vendors operating in the market. The rise in drug discovery programs will offer immense growth opportunities. To leverage the current opportunities, market vendors must strengthen their foothold in the fast-growing segments while maintaining their positions in the slow-growing segments.
The report also covers the following areas
:
Label-Free Detection (LFD) Market Size
Label-Free Detection (LFD) Market Trends
Label-Free Detection (LFD) Market Industry Analysis
Label-free Detection (LFD) Market 2022-2026: Segmentation
End-user
Pharmaceutical and Biotechnology Companies
Academic And Research Institutes
Pharmaceutical and biotechnology companies are the prime end-users in the market. Pharmaceutical and biopharmaceutical companies develop drug molecules for a wide array of therapeutic applications. The pharmacology study of the drug molecules is an integral part of the drug discovery process, and it is performed to understand the molecular mechanism of action of the drug molecules in the biological fluids. LFD technique is widely used by pharmaceutical and biopharmaceutical companies to analyze and determine the drug action during the drug discovery process, prior to the manufacturing of drugs. Thus, increasing drug discoveries will drive the growth of the segment during the forecast period.
Product
Cell-based Assays
By product, the market will observe the maximum growth in the biochemical assay segment during the forecast period. Biochemical assays are one of the conventional methods used for LFD. The adoption rate of biochemical assays is high due to their cost-effectiveness, high competition, and higher efficacy. In addition, there has been continuous development in the field of oncology. Thus, the growing R&D in oncology will drive the growth of the biochemical assays segment.
Learn more about the growth contribution of other segments in the market. Download a Free Sample Report Now
Label-free Detection (LFD) Market 2022-2026: Vendor Analysis
The global LFD market is competitive and is dominated by the presence of major vendors that mainly focus on R&D activities for developing advanced and high-quality products. Prominent vendors are trying to establish a strong customer base by marketing and distributing their products globally to remain competitive and garner significant market revenue. They mainly compete in terms of quality and reliability. The market in focus witnesses high competition due to the presence of various global and regional vendors. Technavio identifies the following as the key vendors in the market.
Agilent Technologies Inc.: The company offers a label-free detection system namely Seahorse XF Analyzers.
Bio Rad Laboratories Inc.: The company offers a label-free detection system namely ProteOn XPR36 protein interaction array system.
Corning Inc.: The company offers a label-free detection system namely Corning Epic Label Free detection system.
Danaher Corp.: The company offers a label-free detection system through its subsidiary Cytiva Life Science.
HORIBA Ltd.: The company offers a label-free detection system namely Biacore 8K.
Affinite Instruments:
Gain access to more vendor profiles available with Technavio. Buy Now!
Technavio's library includes over 17,000+ reports covering more than 2,000 emerging technologies. Subscribe to our "Basic Plan" at just USD 5,000 and get lifetime access to our Technavio Insights
Label-free Detection (LFD) Market 2022-2026: Key Highlights
CAGR of the market during the forecast period 2022-2026
Detailed information on factors that will assist label-free detection (LFD) market growth during the next five years
Estimation of the label-free detection (LFD) market size and its contribution to the parent market
Predictions on upcoming trends and changes in consumer behavior
The growth of the label-free detection (LFD) market
Analysis of the market's competitive landscape and detailed information on vendors
Comprehensive details of factors that will challenge the growth of label-free detection (LFD) market vendors
Related Reports:
The
spatial genomics and transcriptomics market share is expected to increase to USD 401.47 million from 2021 to 2026, and the market's growth momentum will accelerate at a CAGR of 9.06%. The surge in the adoption of spatial genomics and transcriptomics in drug discovery and development is notably driving the spatial genomics and transcriptomics market growth, although factors such as lack of skilled workforce to handle may impede the market growth.
The
direct-to-consumer genetic testing market share is expected to increase by USD 1.26 billion from 2021 to 2026, and the market's growth momentum will accelerate at a CAGR of 13.36%. One of the key factors driving the direct-to-consumer genetic testing market growth is the growing adoption of direct-to-consumer genetic testing for early disease diagnosis.
Table of contents:
1 Executive Summary
1.1 Market overview
Exhibit 01: Executive Summary – Chart on Market Overview
Exhibit 02: Executive Summary – Data Table on Market Overview
Exhibit 03: Executive Summary – Chart on Global Market Characteristics
Exhibit 04: Executive Summary – Chart on Market by Geography
Exhibit 05: Executive Summary – Chart on Market Segmentation by End-user
Exhibit 06: Executive Summary – Chart on Market Segmentation by Product
Exhibit 07: Executive Summary – Chart on Incremental Growth
Exhibit 08: Executive Summary – Data Table on Incremental Growth
Exhibit 09: Executive Summary – Chart on Vendor Market Positioning
2 Market Landscape
2.1 Market ecosystem
Exhibit 10: Parent market
Exhibit 11: Market Characteristics
3 Market Sizing
3.1 Market definition
Exhibit 12: Offerings of vendors included in the market definition
3.2 Market segment analysis
Exhibit 13: Market segments
3.3 Market size 2021
3.4 Market outlook: Forecast for 2021-2026
Exhibit 14: Chart on Global - Market size and forecast 2021-2026 ($ million)
Exhibit 15: Data Table on Global - Market size and forecast 2021-2026 ($ million)
Exhibit 16: Chart on Global Market: Year-over-year growth 2021-2026 (%)
Exhibit 17: Data Table on Global Market: Year-over-year growth 2021-2026 (%)
4 Five Forces Analysis
4.1 Five forces summary
Exhibit 18: Five forces analysis - Comparison between 2021 and 2026
4.2 Bargaining power of buyers
Exhibit 19: Chart on Bargaining power of buyers – Impact of key factors 2021 and 2026
4.3 Bargaining power of suppliers
Exhibit 20: Bargaining power of suppliers – Impact of key factors in 2021 and 2026
4.4 Threat of new entrants
Exhibit 21: Threat of new entrants – Impact of key factors in 2021 and 2026
4.5 Threat of substitutes
Exhibit 22: Threat of substitutes – Impact of key factors in 2021 and 2026
4.6 Threat of rivalry
Exhibit 23: Threat of rivalry – Impact of key factors in 2021 and 2026
4.7 Market condition
Exhibit 24: Chart on Market condition - Five forces 2021 and 2026
5 Market Segmentation by End-user
5.1 Market segments
Exhibit 25: Chart on End-user - Market share 2021-2026 (%)
Exhibit 26: Data Table on End-user - Market share 2021-2026 (%)
5.2 Comparison by End-user
Exhibit 27: Chart on Comparison by End-user
Exhibit 28: Data Table on Comparison by End-user
5.3 Pharmaceutical and biotechnology companies - Market size and forecast 2021-2026
Exhibit 29: Chart on Pharmaceutical and biotechnology companies - Market size and forecast 2021-2026 ($ million)
Exhibit 30: Data Table on Pharmaceutical and biotechnology companies - Market size and forecast 2021-2026 ($ million)
Exhibit 31: Chart on Pharmaceutical and biotechnology companies - Year-over-year growth 2021-2026 (%)
Exhibit 32: Data Table on Pharmaceutical and biotechnology companies - Year-over-year growth 2021-2026 (%)
5.4 Contract research organizations (CROs) - Market size and forecast 2021-2026
Exhibit 33: Chart on Contract research organizations (CROs) - Market size and forecast 2021-2026 ($ million)
Exhibit 34: Data Table on Contract research organizations (CROs) - Market size and forecast 2021-2026 ($ million)
Exhibit 35: Chart on Contract research organizations (CROs) - Year-over-year growth 2021-2026 (%)
Exhibit 36: Data Table on Contract research organizations (CROs) - Year-over-year growth 2021-2026 (%)
5.5 Academic and research institutes - Market size and forecast 2021-2026
Exhibit 37: Chart on Academic and research institutes - Market size and forecast 2021-2026 ($ million)
Exhibit 38: Data Table on Academic and research institutes - Market size and forecast 2021-2026 ($ million)
Exhibit 39: Chart on Academic and research institutes - Year-over-year growth 2021-2026 (%)
Exhibit 40: Data Table on Academic and research institutes - Year-over-year growth 2021-2026 (%)
5.6 Market opportunity by End-user
Exhibit 41: Market opportunity by End-user ($ million)
6 Market Segmentation by Product
6.1 Market segments
Exhibit 42: Chart on Product - Market share 2021-2026 (%)
Exhibit 43: Data Table on Product - Market share 2021-2026 (%)
6.2 Comparison by Product
Exhibit 44: Chart on Comparison by Product
Exhibit 45: Data Table on Comparison by Product
6.3 Biochemical assays - Market size and forecast 2021-2026
Exhibit 46: Chart on Biochemical assays - Market size and forecast 2021-2026 ($ million)
Exhibit 47: Data Table on Biochemical assays - Market size and forecast 2021-2026 ($ million)
Exhibit 48: Chart on Biochemical assays - Year-over-year growth 2021-2026 (%)
Exhibit 49: Data Table on Biochemical assays - Year-over-year growth 2021-2026 (%)
6.4 Cell-based assays - Market size and forecast 2021-2026
Exhibit 50: Chart on Cell-based assays - Market size and forecast 2021-2026 ($ million)
Exhibit 51: Data Table on Cell-based assays - Market size and forecast 2021-2026 ($ million)
Exhibit 52: Chart on Cell-based assays - Year-over-year growth 2021-2026 (%)
Exhibit 53: Data Table on Cell-based assays - Year-over-year growth 2021-2026 (%)
6.5 Market opportunity by Product
Exhibit 54: Market opportunity by Product ($ million)
7 Customer Landscape
7.1 Customer landscape overview
Exhibit 55: Analysis of price sensitivity, lifecycle, customer purchase basket, adoption rates, and purchase criteria
8 Geographic Landscape
8.1 Geographic segmentation
Exhibit 56: Chart on Market share by geography 2021-2026 (%)
Exhibit 57: Data Table on Market share by geography 2021-2026 (%)
8.2 Geographic comparison
Exhibit 58: Chart on Geographic comparison
Exhibit 59: Data Table on Geographic comparison
8.3 North America - Market size and forecast 2021-2026
Exhibit 60: Chart on North America - Market size and forecast 2021-2026 ($ million)
Exhibit 61: Data Table on North America - Market size and forecast 2021-2026 ($ million)
Exhibit 62: Chart on North America - Year-over-year growth 2021-2026 (%)
Exhibit 63: Data Table on North America - Year-over-year growth 2021-2026 (%)
8.4 Europe - Market size and forecast 2021-2026
Exhibit 64: Chart on Europe - Market size and forecast 2021-2026 ($ million)
Exhibit 65: Data Table on Europe - Market size and forecast 2021-2026 ($ million)
Exhibit 66: Chart on Europe - Year-over-year growth 2021-2026 (%)
Exhibit 67: Data Table on Europe - Year-over-year growth 2021-2026 (%)
8.5 Asia - Market size and forecast 2021-2026
Exhibit 68: Chart on Asia - Market size and forecast 2021-2026 ($ million)
Exhibit 69: Data Table on Asia - Market size and forecast 2021-2026 ($ million)
Exhibit 70: Chart on Asia - Year-over-year growth 2021-2026 (%)
Exhibit 71: Data Table on Asia - Year-over-year growth 2021-2026 (%)
8.6 Rest of World (ROW) - Market size and forecast 2021-2026
Exhibit 72: Chart on Rest of World (ROW) - Market size and forecast 2021-2026 ($ million)
Exhibit 73: Data Table on Rest of World (ROW) - Market size and forecast 2021-2026 ($ million)
Exhibit 74: Chart on Rest of World (ROW) - Year-over-year growth 2021-2026 (%)
Exhibit 75: Data Table on Rest of World (ROW) - Year-over-year growth 2021-2026 (%)
8.7 US - Market size and forecast 2021-2026
Exhibit 76: Chart on US - Market size and forecast 2021-2026 ($ million)
Exhibit 77: Data Table on US - Market size and forecast 2021-2026 ($ million)
Exhibit 78: Chart on US - Year-over-year growth 2021-2026 (%)
Exhibit 79: Data Table on US - Year-over-year growth 2021-2026 (%)
8.8 Germany - Market size and forecast 2021-2026
Exhibit 80: Chart on Germany - Market size and forecast 2021-2026 ($ million)
Exhibit 81: Data Table on Germany - Market size and forecast 2021-2026 ($ million)
Exhibit 82: Chart on Germany - Year-over-year growth 2021-2026 (%)
Exhibit 83: Data Table on Germany - Year-over-year growth 2021-2026 (%)
8.9 China - Market size and forecast 2021-2026
Exhibit 84: Chart on China - Market size and forecast 2021-2026 ($ million)
Exhibit 85: Data Table on China - Market size and forecast 2021-2026 ($ million)
Exhibit 86: Chart on China - Year-over-year growth 2021-2026 (%)
Exhibit 87: Data Table on China - Year-over-year growth 2021-2026 (%)
8.10 UK - Market size and forecast 2021-2026
Exhibit 88: Chart on UK - Market size and forecast 2021-2026 ($ million)
Exhibit 89: Data Table on UK - Market size and forecast 2021-2026 ($ million)
Exhibit 90: Chart on UK - Year-over-year growth 2021-2026 (%)
Exhibit 91: Data Table on UK - Year-over-year growth 2021-2026 (%)
8.11 France - Market size and forecast 2021-2026
Exhibit 92: Chart on France - Market size and forecast 2021-2026 ($ million)
Exhibit 93: Data Table on France - Market size and forecast 2021-2026 ($ million)
Exhibit 94: Chart on France - Year-over-year growth 2021-2026 (%)
Exhibit 95: Data Table on France - Year-over-year growth 2021-2026 (%)
8.12 Market opportunity by geography
Exhibit 96: Market opportunity by geography ($ million)
9 Drivers, Challenges, and Trends
9.1 Market drivers
9.2 Market challenges
9.3 Impact of drivers and challenges
Exhibit 97: Impact of drivers and challenges in 2021 and 2026
9.4 Market trends
10 Vendor Landscape
10.1 Overview
10.2 Vendor landscape
Exhibit 98: Overview on Criticality of inputs and Factors of differentiation
10.3 Landscape disruption
Exhibit 99: Overview on factors of disruption
10.4 Industry risks
Exhibit 100: Impact of key risks on business
11 Vendor Analysis
11.1 Vendors covered
Exhibit 101: Vendors covered
11.2 Market positioning of vendors
Exhibit 102: Matrix on vendor position and classification
Exhibit 103: Agilent Technologies Inc. - Overview
Exhibit 104: Agilent Technologies Inc. - Business segments
Exhibit 105: Agilent Technologies Inc. - Key news
Exhibit 106: Agilent Technologies Inc. - Key offerings
Exhibit 107: Agilent Technologies Inc. - Segment focus
Exhibit 108: Bio Rad Laboratories Inc. - Overview
Exhibit 109: Bio Rad Laboratories Inc. - Business segments
Exhibit 110: Bio Rad Laboratories Inc. - Key news
Exhibit 111: Bio Rad Laboratories Inc. - Key offerings
Exhibit 112: Bio Rad Laboratories Inc. - Segment focus
11.5 Corning Inc.
Exhibit 113: Corning Inc. - Overview
Exhibit 114: Corning Inc. - Business segments
Exhibit 115: Corning Inc. - Key offerings
Exhibit 116: Corning Inc. - Segment focus
11.6 Danaher Corp.
Exhibit 117: Danaher Corp. - Overview
Exhibit 118: Danaher Corp. - Business segments
Exhibit 119: Danaher Corp. - Key news
Exhibit 120: Danaher Corp. - Key offerings
Exhibit 121: Danaher Corp. - Segment focus
11.7 General Electric Co.
Exhibit 122: General Electric Co. - Overview
Exhibit 123: General Electric Co. - Business segments
Exhibit 124: General Electric Co. - Key news
Exhibit 125: General Electric Co. - Key offerings
Exhibit 126: General Electric Co. - Segment focus
11.8 HORIBA Ltd.
Exhibit 127: HORIBA Ltd. - Overview
Exhibit 128: HORIBA Ltd. - Business segments
Exhibit 129: HORIBA Ltd. - Key news
Exhibit 130: HORIBA Ltd. - Key offerings
Exhibit 131: HORIBA Ltd. - Segment focus
11.9 PerkinElmer Inc.
Exhibit 132: PerkinElmer Inc. - Overview
Exhibit 133: PerkinElmer Inc. - Business segments
Exhibit 134: PerkinElmer Inc. - Key news
Exhibit 135: PerkinElmer Inc. - Key offerings
Exhibit 136: PerkinElmer Inc. - Segment focus
11.10 Sartorius AG
Exhibit 137: Sartorius AG - Overview
Exhibit 138: Sartorius AG - Business segments
Exhibit 139: Sartorius AG - Key news
Exhibit 140: Sartorius AG - Key offerings
Exhibit 141: Sartorius AG - Segment focus
11.11 Spectris Plc
Exhibit 142: Spectris Plc - Overview
Exhibit 143: Spectris Plc - Business segments
Exhibit 144: Spectris Plc - Key news
Exhibit 145: Spectris Plc - Key offerings
Exhibit 146: Spectris Plc - Segment focus
Exhibit 147: Thermo Fisher Scientific Inc. - Overview
Exhibit 148: Thermo Fisher Scientific Inc. - Business segments
Exhibit 149: Thermo Fisher Scientific Inc. - Key news
Exhibit 150: Thermo Fisher Scientific Inc. - Key offerings
Exhibit 151: Thermo Fisher Scientific Inc. - Segment focus
12.1 Scope of the report
12.2 Inclusions and exclusions checklist
Exhibit 152: Inclusions checklist
Exhibit 153: Exclusions checklist
12.3 Currency conversion rates for US$
Exhibit 154: Currency conversion rates for US$
12.4 Research methodology
Exhibit 155: Research methodology
Exhibit 156: Validation techniques employed for market sizing
Exhibit 157: Information sources
12.5 List of abbreviations
Exhibit 158: List of abbreviations
About Us
Technavio is a leading global technology research and advisory company. Their research and analysis focus on emerging market trends and provides actionable insights to help businesses identify market opportunities and develop effective strategies to optimize their market positions. With over 500 specialized analysts, Technavio's report library consists of more than 17,000 reports and counting, covering 800 technologies, spanning across 50 countries. Their client base consists of enterprises of all sizes, including more than 100 Fortune 500 companies. This growing client base relies on Technavio's comprehensive coverage, extensive research, and actionable market insights to identify opportunities in existing and potential markets and assess their competitive positions within changing market scenarios.
Contact
Technavio Research
Jesse Maida
US: +1 844 364 1100
UK: +44 203 893 3200
Email: [email protected]
Website: www.technavio.com/
SOURCE Technavio
For more details,please visit the original website
The content of the article does not represent any opinions of Synapse and its affiliated companies. If there is any copyright infringement or error, please contact us, and we will deal with it within 24 hours.
Organizations
Indications
-Targets
-Drugs
-Hot reports


Get started for free today!
Accelerate Strategic R&D decision making with Synapse, PatSnap’s AI-powered Connected Innovation Intelligence Platform Built for Life Sciences Professionals.
Start your data trial now!
Synapse data is also accessible to external entities via APIs or data packages. Leverages most recent intelligence information, enabling fullest potential.