Animal Pregnancy Test Kit Market| Evolving Opportunities with Bellylabs Oy and Bio Tracking | Technavio
07 Jul 2022
Vaccine
NEW YORK, July 6, 2022 /PRNewswire/ -- The
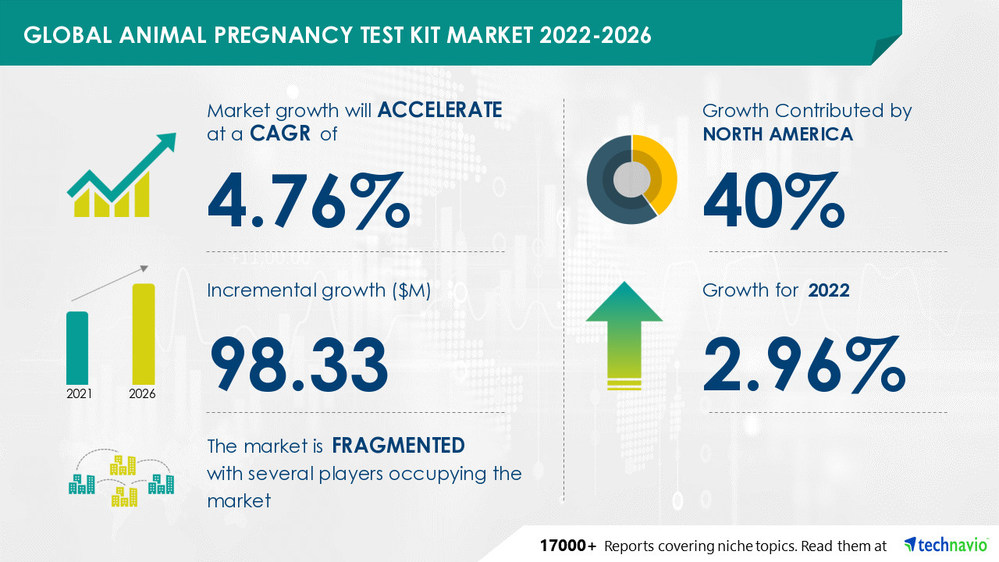
Animal Pregnancy Test Kit Market size is expected to grow by USD 98.33 million from 2021 to 2026, at a CAGR of 4.76% during the forecast period. The report extensively covers animal pregnancy test kit market segmentation by
product (cassettes, strips, and enzyme-linked immunoassay) and geography (North America, Europe, Asia, and the Rest of the World (ROW)).
Preview
Source: PRNewswire
Technavio has announced its latest market research report titled Animal Pregnancy Test Kit Market by Product and Geography - Forecast and Analysis 2022-2026
Read the 120-page report with TOC on "Animal Pregnancy Test Kit Market Analysis Report by Product (Cassettes, Strips, and Enzyme-linked immunoassay) and Geography (North America, Europe, Asia, and Rest of World (ROW)), and the Segment Forecasts,2022-2026". Request a Sample Report
One of the main factors fueling the expansion of the market for animal pregnancy test kits is
the rising cost of veterinary treatment. The rising demand from livestock farmers is another market trend for animal pregnancy test kits. However, one of the things preventing the market for animal pregnancy test kits from expanding is a
dearth of veterinary specialists who are sufficiently trained.
For more information on regional segment – Get a sample now!
Major Five Animal Pregnancy Test Kit Companies:
The growing competition in the market is compelling vendors to adopt various growth strategies such as promotional activities and spending on advertisements to improve the visibility of their services. Some vendors are also adopting inorganic growth strategies such as M&As to remain competitive in the market.
The report analyzes the market's competitive landscape and offers information on several market vendors, including:
Bellylabs Oy
EMLAB GENETICS LLC.
Fassisi, Society for Veterinary Diagnostics and Environmental Analysis GmbH
Hangzhou Testsea Biotechnology Co. Ltd.
J and G Biotech Ltd.
MicroTUS International Biotechnology Co. Ltd.
Ring Biotechnology Co. Ltd.
Find additional highlights on the growth strategies adopted by vendors and their product offerings,
Read Latest Sample Report
.
Animal Pregnancy Test Kit Market Product Outlook
The cassettes market segment will significantly increase its market share for animal pregnancy test kits. Pregnancy-associated glycoproteins (PAGs) can be found in ethylenediaminetetraacetic acid (EDTA) whole blood, EDTA plasma, or the serum of cows and heifers and are used as a pregnancy indicator thanks to the cassettes.
Animal pregnancy detection utilizing cassettes is accurate and affordable, and it may be done without a veterinarian's intervention on companion animals at home as well as on farm animals. In the upcoming years, these elements will propel market expansion through this category.
View Sample Report
:
to know additional highlights and key points on various market segments and their impact in coming years.
Animal Pregnancy Test Kit Market Geography Outlook
North America will account for 40% of market growth. The two biggest markets in North America for animal pregnancy test kits are the US and Canada. The market in this area will expand more quickly than the market in ROW. Over the projected period, the animal pregnancy test kit market will increase in North America due to rising awareness about animal healthcare.
Technavio's sample reports contain multiple sections of the report, such as the market size and forecast, drivers, challenges, trends, and more. Request a sample report
Related Reports:
Hemocytometer Market by End-user and Geography - Forecast and Analysis 2022-2026
Vaccine Research Market by End-user and Geography - Forecast and Analysis 2022-2026
Table of Contents
1 Executive Summary
1.1 Market overview
Exhibit 01: Executive Summary – Chart on Market Overview
Exhibit 02: Executive Summary – Data Table on Market Overview
Exhibit 03: Executive Summary – Chart on Global Market Characteristics
Exhibit 04: Executive Summary – Chart on Market by Geography
Exhibit 05: Executive Summary – Chart on Market Segmentation by Product
Exhibit 06: Executive Summary – Chart on Incremental Growth
Exhibit 07: Executive Summary – Data Table on Incremental Growth
Exhibit 08: Executive Summary – Chart on Vendor Market Positioning
2 Market Landscape
2.1 Market ecosystem
Exhibit 09: Parent market
Exhibit 10: Market Characteristics
3 Market Sizing
3.1 Market definition
Exhibit 11: Offerings of vendors included in the market definition
3.2 Market segment analysis
Exhibit 12: Market segments
3.3 Market size 2021
3.4 Market outlook: Forecast for 2021-2026
Exhibit 13: Chart on Global - Market size and forecast 2021-2026 ($ million)
Exhibit 14: Data Table on Global - Market size and forecast 2021-2026 ($ million)
Exhibit 15: Chart on Global Market: Year-over-year growth 2021-2026 (%)
Exhibit 16: Data Table on Global Market: Year-over-year growth 2021-2026 (%)
4 Five Forces Analysis
4.1 Five forces summary
Exhibit 17: Five forces analysis - Comparison between 2021 and 2026
4.2 Bargaining power of buyers
Exhibit 18: Bargaining power of buyers – Impact of key factors in 2021 and 2026
4.3 Bargaining power of suppliers
Exhibit 19: Bargaining power of suppliers – Impact of key factors in 2021 and 2026
4.4 Threat of new entrants
Exhibit 20: Threat of new entrants – Impact of key factors in 2021 and 2026
4.5 Threat of substitutes
Exhibit 21: Threat of substitutes – Impact of key factors in 2021 and 2026
4.6 Threat of rivalry
Exhibit 22: Threat of rivalry – Impact of key factors in 2021 and 2026
4.7 Market condition
Exhibit 23: Chart on Market condition - Five forces 2021 and 2026
5 Market Segmentation by Product
5.1 Market segments
Exhibit 24: Chart on Product - Market share 2021-2026 (%)
Exhibit 25: Data Table on Product - Market share 2021-2026 (%)
5.2 Comparison by Product
Exhibit 26: Chart on Comparison by Product
Exhibit 27: Data Table on Comparison by Product
5.3 Cassettes - Market size and forecast 2021-2026
Exhibit 28: Chart on Cassettes - Market size and forecast 2021-2026 ($ million)
Exhibit 29: Data Table on Cassettes - Market size and forecast 2021-2026 ($ million)
Exhibit 30: Chart on Cassettes - Year-over-year growth 2021-2026 (%)
Exhibit 31: Data Table on Cassettes - Year-over-year growth 2021-2026 (%)
5.4 Strips - Market size and forecast 2021-2026
Exhibit 32: Chart on Strips - Market size and forecast 2021-2026 ($ million)
Exhibit 33: Data Table on Strips - Market size and forecast 2021-2026 ($ million)
Exhibit 34: Chart on Strips - Year-over-year growth 2021-2026 (%)
Exhibit 35: Data Table on Strips - Year-over-year growth 2021-2026 (%)
5.5 Enzyme-linked immunoassay - Market size and forecast 2021-2026
Exhibit 36: Chart on Enzyme-linked immunoassay - Market size and forecast 2021-2026 ($ million)
Exhibit 37: Data Table on Enzyme-linked immunoassay - Market size and forecast 2021-2026 ($ million)
Exhibit 38: Chart on Enzyme-linked immunoassay - Year-over-year growth 2021-2026 (%)
Exhibit 39: Data Table on Enzyme-linked immunoassay - Year-over-year growth 2021-2026 (%)
5.6 Market opportunity by Product
Exhibit 40: Market opportunity by Product ($ million)
6 Customer Landscape
6.1 Customer landscape overview
Exhibit 41: Analysis of price sensitivity, lifecycle, customer purchase basket, adoption rates, and purchase criteria
7 Geographic Landscape
7.1 Geographic segmentation
Exhibit 42: Chart on Market share by geography 2021-2026 (%)
Exhibit 43: Data Table on Market share by geography 2021-2026 (%)
7.2 Geographic comparison
Exhibit 44: Chart on Geographic comparison
Exhibit 45: Data Table on Geographic comparison
7.3 North America - Market size and forecast 2021-2026
Exhibit 46: Chart on North America - Market size and forecast 2021-2026 ($ million)
Exhibit 47: Data Table on North America - Market size and forecast 2021-2026 ($ million)
Exhibit 48: Chart on North America - Year-over-year growth 2021-2026 (%)
Exhibit 49: Data Table on North America - Year-over-year growth 2021-2026 (%)
7.4 Europe - Market size and forecast 2021-2026
Exhibit 50: Chart on Europe - Market size and forecast 2021-2026 ($ million)
Exhibit 51: Data Table on Europe - Market size and forecast 2021-2026 ($ million)
Exhibit 52: Chart on Europe - Year-over-year growth 2021-2026 (%)
Exhibit 53: Data Table on Europe - Year-over-year growth 2021-2026 (%)
7.5 Asia - Market size and forecast 2021-2026
Exhibit 54: Chart on Asia - Market size and forecast 2021-2026 ($ million)
Exhibit 55: Data Table on Asia - Market size and forecast 2021-2026 ($ million)
Exhibit 56: Chart on Asia - Year-over-year growth 2021-2026 (%)
Exhibit 57: Data Table on Asia - Year-over-year growth 2021-2026 (%)
7.6 Rest of World (ROW) - Market size and forecast 2021-2026
Exhibit 58: Chart on Rest of World (ROW) - Market size and forecast 2021-2026 ($ million)
Exhibit 59: Data Table on Rest of World (ROW) - Market size and forecast 2021-2026 ($ million)
Exhibit 60: Chart on Rest of World (ROW) - Year-over-year growth 2021-2026 (%)
Exhibit 61: Data Table on Rest of World (ROW) - Year-over-year growth 2021-2026 (%)
7.7 US - Market size and forecast 2021-2026
Exhibit 62: Chart on US - Market size and forecast 2021-2026 ($ million)
Exhibit 63: Data Table on US - Market size and forecast 2021-2026 ($ million)
Exhibit 64: Chart on US - Year-over-year growth 2021-2026 (%)
Exhibit 65: Data Table on US - Year-over-year growth 2021-2026 (%)
7.8 Canada - Market size and forecast 2021-2026
Exhibit 66: Chart on Canada - Market size and forecast 2021-2026 ($ million)
Exhibit 67: Data Table on Canada - Market size and forecast 2021-2026 ($ million)
Exhibit 68: Chart on Canada - Year-over-year growth 2021-2026 (%)
Exhibit 69: Data Table on Canada - Year-over-year growth 2021-2026 (%)
7.9 Germany - Market size and forecast 2021-2026
Exhibit 70: Chart on Germany - Market size and forecast 2021-2026 ($ million)
Exhibit 71: Data Table on Germany - Market size and forecast 2021-2026 ($ million)
Exhibit 72: Chart on Germany - Year-over-year growth 2021-2026 (%)
Exhibit 73: Data Table on Germany - Year-over-year growth 2021-2026 (%)
7.10 Australia - Market size and forecast 2021-2026
Exhibit 74: Chart on Australia - Market size and forecast 2021-2026 ($ million)
Exhibit 75: Data Table on Australia - Market size and forecast 2021-2026 ($ million)
Exhibit 76: Chart on Australia - Year-over-year growth 2021-2026 (%)
Exhibit 77: Data Table on Australia - Year-over-year growth 2021-2026 (%)
7.11 Japan - Market size and forecast 2021-2026
Exhibit 78: Chart on Japan - Market size and forecast 2021-2026 ($ million)
Exhibit 79: Data Table on Japan - Market size and forecast 2021-2026 ($ million)
Exhibit 80: Chart on Japan - Year-over-year growth 2021-2026 (%)
Exhibit 81: Data Table on Japan - Year-over-year growth 2021-2026 (%)
7.12 Market opportunity by geography
Exhibit 82: Market opportunity by geography ($ million)
8 Drivers, Challenges, and Trends
8.1 Market drivers
8.2 Market challenges
8.3 Impact of drivers and challenges
Exhibit 83: Impact of drivers and challenges in 2021 and 2026
8.4 Market trends
9 Vendor Landscape
9.1 Overview
9.2 Vendor landscape
Exhibit 84: Overview on Criticality of inputs and Factors of differentiation
9.3 Landscape disruption
Exhibit 85: Overview on factors of disruption
9.4 Industry risks
Exhibit 86: Impact of key risks on business
10 Vendor Analysis
10.1 Vendors covered
Exhibit 87: Vendors covered
10.2 Market positioning of vendors
Exhibit 88: Matrix on vendor position and classification
10.3 Bio Tracking
Exhibit 89: Bio Tracking - Overview
Exhibit 90: Bio Tracking - Product / Service
Exhibit 91: Bio Tracking - Key offerings
10.4 BioNote Inc.
Exhibit 92: BioNote Inc. - Overview
Exhibit 93: BioNote Inc. - Product / Service
Exhibit 94: BioNote Inc. - Key offerings
10.5 Fassisi
Exhibit 95: Fassisi - Overview
Exhibit 96: Fassisi - Product / Service
Exhibit 97: Fassisi - Key offerings
Exhibit 98: IDEXX Laboratories Inc. - Overview
Exhibit 99: IDEXX Laboratories Inc. - Business segments
Exhibit 100: IDEXX Laboratories Inc. - Key news
Exhibit 101: IDEXX Laboratories Inc. - Key offerings
Exhibit 102: IDEXX Laboratories Inc. - Segment focus
10.7 MicroTUS International Biotechnology Co. Ltd.
Exhibit 103: MicroTUS International Biotechnology Co. Ltd. - Overview
Exhibit 104: MicroTUS International Biotechnology Co. Ltd. - Product / Service
Exhibit 105: MicroTUS International Biotechnology Co. Ltd. - Key offerings
Exhibit 106: Randox Laboratories Ltd. - Overview
Exhibit 107: Randox Laboratories Ltd. - Product / Service
Exhibit 108: Randox Laboratories Ltd. - Key offerings
10.9 Ring Biotechnology Co. Ltd.
Exhibit 109: Ring Biotechnology Co. Ltd. - Overview
Exhibit 110: Ring Biotechnology Co. Ltd. - Product / Service
Exhibit 111: Ring Biotechnology Co. Ltd. - Key offerings
Exhibit 112: Shenzhen Bioeasy Biotechnology Co. Ltd. - Overview
Exhibit 113: Shenzhen Bioeasy Biotechnology Co. Ltd. - Product / Service
Exhibit 114: Shenzhen Bioeasy Biotechnology Co. Ltd. - Key offerings
10.11 Zhengzhou Zhimuren Machinery Equipment Co.
Exhibit 115: Zhengzhou Zhimuren Machinery Equipment Co. - Overview
Exhibit 116: Zhengzhou Zhimuren Machinery Equipment Co. - Product / Service
Exhibit 117: Zhengzhou Zhimuren Machinery Equipment Co. - Key offerings
10.12 Zoetis Inc.
Exhibit 118: Zoetis Inc. - Overview
Exhibit 119: Zoetis Inc. - Business segments
Exhibit 120: Zoetis Inc. - Key offerings
Exhibit 121: Zoetis Inc. - Segment focus
11.1 Scope of the report
11.2 Inclusions and exclusions checklist
Exhibit 122: Inclusions checklist
Exhibit 123: Exclusions checklist
11.3 Currency conversion rates for US$
Exhibit 124: Currency conversion rates for US$
11.4 Research methodology
Exhibit 125: Research methodology
Exhibit 126: Validation techniques employed for market sizing
Exhibit 127: Information sources
11.5 List of abbreviations
Exhibit 128: List of abbreviations
About Technavio
Technavio is a leading global technology research and advisory company. Their research and analysis focus on emerging market trends and provides actionable insights to help businesses identify market opportunities and develop effective strategies to optimize their market positions.
With over 500 specialized analysts, Technavio's report library consists of more than 17,000 reports and counting, covering 800 technologies, spanning across 50 countries. Their client base consists of enterprises of all sizes, including more than 100 Fortune 500 companies. This growing client base relies on Technavio's comprehensive coverage, extensive research, and actionable market insights to identify opportunities in existing and potential markets and assess their competitive positions within changing market scenarios.
Contacts
Technavio Research
Jesse Maida
US: +1 844 364 1100
UK: +44 203 893 3200
Email:
[email protected]
Website:
www.technavio.com/
SOURCE Technavio
For more details,please visit the original website
The content of the article does not represent any opinions of Synapse and its affiliated companies. If there is any copyright infringement or error, please contact us, and we will deal with it within 24 hours.
Organizations
Indications
-Targets
-Drugs
-Chat with Hiro
Hot reports


Get started for free today!
Accelerate Strategic R&D decision making with Synapse, PatSnap’s AI-powered Connected Innovation Intelligence Platform Built for Life Sciences Professionals.
Start your data trial now!
Synapse data is also accessible to external entities via APIs or data packages. Empower better decisions with the latest in pharmaceutical intelligence.