BiPAP Market Size in the US to Grow by USD 130.51 Mn, Devices to be Largest Revenue-generating Product - Technavio
26 Oct 2022
Collaborate
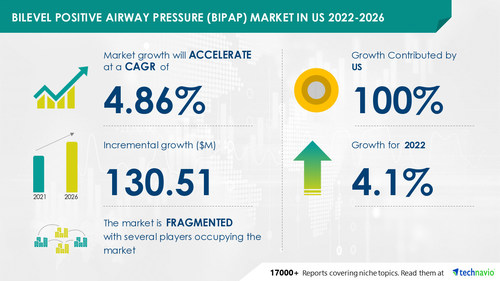
NEW YORK, Oct. 26, 2022 /PRNewswire/ -- The bilevel positive airway pressure (BiPAP) market size in the US is expected to grow by USD 130.51 million from 2021 to 2026. In addition, the growth momentum of the market will accelerate at a CAGR of 4.86% during the forecast period, according to Technavio. The increasing prevalence of sleep apnea and respiratory disorders is driving market growth. However, risks and complications associated with airway management products are challenging market growth.
Continue Reading
Preview
Source: PRNewswire
Technavio has announced its latest market research report titled Bilevel Positive Airway Pressure (BiPAP) Market in US 2022-2026
View a comprehensive report summary that describes the market size and forecast along with the research methodology. The FREE sample report is available in PDF format
Bilevel Positive Airway Pressure (BiPAP) Market in the US 2022-2026: Scope
The bilevel positive airway pressure (BiPAP) market in the US report covers the following areas:
Bilevel Positive Airway Pressure (BiPAP) Market in US size
Bilevel Positive Airway Pressure (BiPAP) Market in US trends
Bilevel Positive Airway Pressure (BiPAP) Market in US industry analysis
Subscribe to our "Basic Plan" billed annually at USD 5000 that enables you to download 5 reports and view 100 reports per month
Bilevel Positive Airway Pressure (BiPAP) Market in the US 2022-2026: Vendor Analysis
We provide a detailed analysis of around 25 vendors operating in the bilevel positive airway pressure (BiPAP) Market in the US, including 3B Medical Inc., Ambu AS, BMC Medical Co. Ltd., Breas Medical AB, Cardinal Health Inc, Drive DeVilbiss Healthcare, Fisher and Paykel Healthcare Corp. Ltd., Hafele America Co., Hunan Beyond Medical Technology Co. Ltd., Koninklijke Philips NV, Medtronic Plc, Moldex Metric Inc., Protective Industrial Products Inc, ResMed Inc., Smiths Group Plc, Transcend Inc., Vyaire Medical Inc., W.W. Grainger Inc., and Wellell Inc. are some of the major market participants.
This report provides a full list of key vendors, their strategies, and the latest developments. Buy Now to gain access to information about each vendor
Bilevel Positive Airway Pressure (BiPAP) Market in the US 2022-2026: Segmentation
Product
Devices: The devices segment will be a significant contributor to market growth during the forecast period. This growth is attributed to factors such as the rising prevalence of sleep apnea, the increasing number of new product launches, business strategies adopted by key vendors, and favorable reimbursement policies for BiPAP devices in the US.
Masks
Aftermarket parts and accessories
Offline
Online
Learn about the contribution of each segment summarized in concise infographics and thorough descriptions. View a FREE PDF Sample Report
Bilevel Positive Airway Pressure (BiPAP) Market in the US 2022-2026: Key Highlights
CAGR of the market during 2022-2026
Detailed information on factors that will assist the bilevel positive airway pressure (BiPAP) market growth in the US during the next five years
Estimation of the bilevel positive airway pressure (BiPAP) market size in the US and its contribution to the parent market
Forecasts on upcoming trends and changes in consumer behavior
The growth of the bilevel positive airway pressure (BiPAP) market in the US
Analysis of the competitive landscape and detailed information on vendors
Comprehensive details of factors that will challenge the growth of the bilevel positive airway pressure (BiPAP) market vendors in the US
Related Reports
Continuous Positive Airway Pressure (CPAP) Market in the US by Product, Distribution Channel, and Revenue Stream - Forecast and Analysis 2022-2026: The rising demand for home-care settings is a trend in the market. Elderly and overweight or obese people cannot afford to visit health centers regularly and often need daily monitoring. The availability of home care products is convenient and cost-effective.
Continuous Positive Airway Pressure Devices Market by Product and Geography - Forecast and Analysis 2021-2025: The increasing number of partnerships and collaborations is the key trend. Vendors are opting for business strategies, such as partnerships and collaborations, with end-users and medical technology companies. For instance, in 2019, RedMed Inc. acquired HB Healthcare (HBH), a medical equipment provider.
Browse Health Care Market Reports
Table Of Contents
1 Executive Summary
1.1 Market overview
Exhibit 01: Executive Summary – Chart on Market Overview
Exhibit 02: Executive Summary – Data Table on Market Overview
Exhibit 03: Executive Summary – Chart on Country Market Characteristics
Exhibit 04: Executive Summary – Chart on Market Segmentation by Product
Exhibit 05: Executive Summary – Chart on Market Segmentation by Distribution Channel
Exhibit 06: Executive Summary – Chart on Market Segmentation by Revenue Stream
Exhibit 07: Executive Summary – Chart on Vendor Market Positioning
2 Market Landscape
2.1 Market ecosystem
Exhibit 08: Parent market
Exhibit 09: Market Characteristics
3 Market Sizing
3.1 Market definition
Exhibit 10: Offerings of vendors included in the market definition
3.2 Market segment analysis
Exhibit 11: Market segments
3.3 Market size 2021
3.4 Market outlook: Forecast for 2021-2026
Exhibit 12: Chart on US - Market size and forecast 2021-2026 ($ million)
Exhibit 13: Data Table on US - Market size and forecast 2021-2026 ($ million)
Exhibit 14: Chart on US: Year-over-year growth 2021-2026 (%)
Exhibit 15: Data Table on US: Year-over-year growth 2021-2026 (%)
4 Five Forces Analysis
4.1 Five forces summary
Exhibit 16: Five forces analysis - Comparison between 2021 and 2026
4.2 Bargaining power of buyers
Exhibit 17: Chart on Bargaining power of buyers – Impact of key factors 2021 and 2026
4.3 Bargaining power of suppliers
Exhibit 18: Bargaining power of suppliers – Impact of key factors in 2021 and 2026
4.4 Threat of new entrants
Exhibit 19: Threat of new entrants – Impact of key factors in 2021 and 2026
4.5 Threat of substitutes
Exhibit 20: Threat of substitutes – Impact of key factors in 2021 and 2026
4.6 Threat of rivalry
Exhibit 21: Threat of rivalry – Impact of key factors in 2021 and 2026
4.7 Market condition
Exhibit 22: Chart on Market condition - Five forces 2021 and 2026
5 Market Segmentation by Product
5.1 Market segments
Exhibit 23: Chart on Product - Market share 2021-2026 (%)
Exhibit 24: Data Table on Product - Market share 2021-2026 (%)
5.2 Comparison by Product
Exhibit 25: Chart on Comparison by Product
Exhibit 26: Data Table on Comparison by Product
5.3 Devices - Market size and forecast 2021-2026
Exhibit 27: Chart on Devices - Market size and forecast 2021-2026 ($ million)
Exhibit 28: Data Table on Devices - Market size and forecast 2021-2026 ($ million)
Exhibit 29: Chart on Devices - Year-over-year growth 2021-2026 (%)
Exhibit 30: Data Table on Devices - Year-over-year growth 2021-2026 (%)
5.4 Masks - Market size and forecast 2021-2026
Exhibit 31: Chart on Masks - Market size and forecast 2021-2026 ($ million)
Exhibit 32: Data Table on Masks - Market size and forecast 2021-2026 ($ million)
Exhibit 33: Chart on Masks - Year-over-year growth 2021-2026 (%)
Exhibit 34: Data Table on Masks - Year-over-year growth 2021-2026 (%)
5.5 Aftermarket parts and accessories - Market size and forecast 2021-2026
Exhibit 35: Chart on Aftermarket parts and accessories - Market size and forecast 2021-2026 ($ million)
Exhibit 36: Data Table on Aftermarket parts and accessories - Market size and forecast 2021-2026 ($ million)
Exhibit 37: Chart on Aftermarket parts and accessories - Year-over-year growth 2021-2026 (%)
Exhibit 38: Data Table on Aftermarket parts and accessories - Year-over-year growth 2021-2026 (%)
5.6 Market opportunity by Product
Exhibit 39: Market opportunity by Product ($ million)
6 Market Segmentation by Distribution Channel
6.1 Market segments
Exhibit 40: Chart on Distribution Channel - Market share 2021-2026 (%)
Exhibit 41: Data Table on Distribution Channel - Market share 2021-2026 (%)
6.2 Comparison by Distribution Channel
Exhibit 42: Chart on Comparison by Distribution Channel
Exhibit 43: Data Table on Comparison by Distribution Channel
6.3 Offline - Market size and forecast 2021-2026
Exhibit 44: Chart on Offline - Market size and forecast 2021-2026 ($ million)
Exhibit 45: Data Table on Offline - Market size and forecast 2021-2026 ($ million)
Exhibit 46: Chart on Offline - Year-over-year growth 2021-2026 (%)
Exhibit 47: Data Table on Offline - Year-over-year growth 2021-2026 (%)
6.4 Online - Market size and forecast 2021-2026
Exhibit 48: Chart on Online - Market size and forecast 2021-2026 ($ million)
Exhibit 49: Data Table on Online - Market size and forecast 2021-2026 ($ million)
Exhibit 50: Chart on Online - Year-over-year growth 2021-2026 (%)
Exhibit 51: Data Table on Online - Year-over-year growth 2021-2026 (%)
6.5 Market opportunity by Distribution Channel
Exhibit 52: Market opportunity by Distribution Channel ($ million)
7 Market Segmentation by Revenue Stream
7.1 Market segments
Exhibit 53: Chart on Revenue Stream - Market share 2021-2026 (%)
Exhibit 54: Data Table on Revenue Stream - Market share 2021-2026 (%)
7.2 Comparison by Revenue Stream
Exhibit 55: Chart on Comparison by Revenue Stream
Exhibit 56: Data Table on Comparison by Revenue Stream
7.3 Insurance - Market size and forecast 2021-2026
Exhibit 57: Chart on Insurance - Market size and forecast 2021-2026 ($ million)
Exhibit 58: Data Table on Insurance - Market size and forecast 2021-2026 ($ million)
Exhibit 59: Chart on Insurance - Year-over-year growth 2021-2026 (%)
Exhibit 60: Data Table on Insurance - Year-over-year growth 2021-2026 (%)
7.4 Cash pay - Market size and forecast 2021-2026
Exhibit 61: Chart on Cash pay - Market size and forecast 2021-2026 ($ million)
Exhibit 62: Data Table on Cash pay - Market size and forecast 2021-2026 ($ million)
Exhibit 63: Chart on Cash pay - Year-over-year growth 2021-2026 (%)
Exhibit 64: Data Table on Cash pay - Year-over-year growth 2021-2026 (%)
7.5 Market opportunity by Revenue Stream
Exhibit 65: Market opportunity by Revenue Stream ($ million)
8 Customer Landscape
8.1 Customer landscape overview
Exhibit 66: Analysis of price sensitivity, lifecycle, customer purchase basket, adoption rates, and purchase criteria
9 Drivers, Challenges, and Trends
9.1 Market drivers
9.2 Market challenges
9.3 Impact of drivers and challenges
Exhibit 67: Impact of drivers and challenges in 2021 and 2026
9.4 Market trends
10 Vendor Landscape
10.1 Overview
10.2 Vendor landscape
Exhibit 68: Overview on Criticality of inputs and Factors of differentiation
10.3 Landscape disruption
Exhibit 69: Overview on factors of disruption
10.4 Industry risks
Exhibit 70: Impact of key risks on business
11 Vendor Analysis
11.1 Vendors covered
Exhibit 71: Vendors covered
11.2 Market positioning of vendors
Exhibit 72: Matrix on vendor position and classification
11.3 3B Medical Inc.
Exhibit 73: 3B Medical Inc. - Overview
Exhibit 74: 3B Medical Inc. - Product / Service
Exhibit 75: 3B Medical Inc. - Key offerings
11.4 BMC Medical Co. Ltd.
Exhibit 76: BMC Medical Co. Ltd. - Overview
Exhibit 77: BMC Medical Co. Ltd. - Product / Service
Exhibit 78: BMC Medical Co. Ltd. - Key offerings
11.5 Breas Medical AB
Exhibit 79: Breas Medical AB - Overview
Exhibit 80: Breas Medical AB - Product / Service
Exhibit 81: Breas Medical AB - Key offerings
11.6 Drive DeVilbiss Healthcare
Exhibit 82: Drive DeVilbiss Healthcare - Overview
Exhibit 83: Drive DeVilbiss Healthcare - Product / Service
Exhibit 84: Drive DeVilbiss Healthcare - Key offerings
11.7 Fisher and Paykel Healthcare Corp. Ltd.
Exhibit 85: Fisher and Paykel Healthcare Corp. Ltd. - Overview
Exhibit 86: Fisher and Paykel Healthcare Corp. Ltd. - Product / Service
Exhibit 87: Fisher and Paykel Healthcare Corp. Ltd. - Key news
Exhibit 88: Fisher and Paykel Healthcare Corp. Ltd. - Key offerings
11.8 Hunan Beyond Medical Technology Co. Ltd.
Exhibit 89: Hunan Beyond Medical Technology Co. Ltd. - Overview
Exhibit 90: Hunan Beyond Medical Technology Co. Ltd. - Product / Service
Exhibit 91: Hunan Beyond Medical Technology Co. Ltd. - Key offerings
Exhibit 92: Koninklijke Philips NV - Overview
Exhibit 93: Koninklijke Philips NV - Business segments
Exhibit 94: Koninklijke Philips NV - Key news
Exhibit 95: Koninklijke Philips NV - Key offerings
Exhibit 96: Koninklijke Philips NV - Segment focus
11.10 Medtronic Plc
Exhibit 97: Medtronic Plc - Overview
Exhibit 98: Medtronic Plc - Business segments
Exhibit 99: Medtronic Plc - Key news
Exhibit 100: Medtronic Plc - Key offerings
Exhibit 101: Medtronic Plc - Segment focus
11.11 ResMed Inc.
Exhibit 102: ResMed Inc. - Overview
Exhibit 103: ResMed Inc. - Business segments
Exhibit 104: ResMed Inc. - Key news
Exhibit 105: ResMed Inc. - Key offerings
Exhibit 106: ResMed Inc. - Segment focus
11.12 Wellell Inc.
Exhibit 107: Wellell Inc. - Overview
Exhibit 108: Wellell Inc. - Product / Service
Exhibit 109: Wellell Inc. - Key offerings
12.1 Scope of the report
12.2 Inclusions and exclusions checklist
Exhibit 110: Inclusions checklist
Exhibit 111: Exclusions checklist
12.3 Currency conversion rates for US$
Exhibit 112: Currency conversion rates for US$
12.4 Research methodology
Exhibit 113: Research methodology
Exhibit 114: Validation techniques employed for market sizing
Exhibit 115: Information sources
12.5 List of abbreviations
Exhibit 116: List of abbreviations
About Us
Technavio is a leading global technology research and advisory company. Their research and analysis focus on emerging market trends and provide actionable insights to help businesses identify market opportunities and develop effective strategies to optimize their market positions. With over 500 specialized analysts, Technavio's report library consists of more than 17,000 reports and counting, covering 800 technologies, spanning across 50 countries. Their client base consists of enterprises of all sizes, including more than 100 Fortune 500 companies. This growing client base relies on Technavio's comprehensive coverage, extensive research, and actionable market insights to identify opportunities in existing and potential markets and assess their competitive positions within changing market scenarios.
Contact
Technavio Research
Jesse Maida
US: +1 844 364 1100
UK: +44 203 893 3200
Email: [email protected]
Website: www.technavio.com/
SOURCE Technavio
For more details,please visit the original website
The content of the article does not represent any opinions of Synapse and its affiliated companies. If there is any copyright infringement or error, please contact us, and we will deal with it within 24 hours.
Organizations
Indications
Targets
-Drugs
-Chat with Hiro
Hot reports


Get started for free today!
Accelerate Strategic R&D decision making with Synapse, PatSnap’s AI-powered Connected Innovation Intelligence Platform Built for Life Sciences Professionals.
Start your data trial now!
Synapse data is also accessible to external entities via APIs or data packages. Empower better decisions with the latest in pharmaceutical intelligence.