Urinalysis Market Size To Grow By USD 920.73 Million With Expected YOY Of 6.24% in 2022 - Technavio
10 Oct 2022
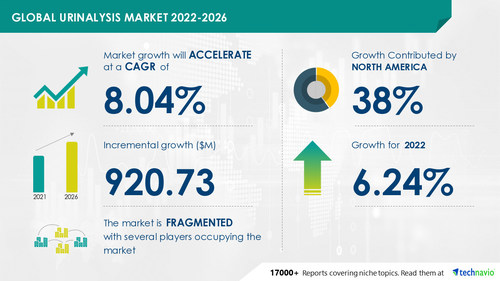
NEW YORK, Oct. 10, 2022 /PRNewswire/ -- The urinalysis market size is set to grow by USD 920.73 million between 2022 to 2026, according to Technavio. Our report offers an up-to-date analysis regarding the current market scenario and provides extensive information on the value chain analysis for the urinalysis market, which vendors can leverage to gain a competitive advantage during the forecast period. The data available in our value chain analysis segment can help vendors plan their research and development cost and enhance their offerings during the forecast period. For more analysis on Vendor Offerings Read Free Sample Report.
Continue Reading
Preview
Source: PRNewswire
Technavio has announced its latest market research report titled Global Urinalysis Market 2022-2026
Urinalysis Market 2022-2026: Segmentation
End-user
The urinalysis market share growth in the hospital and clinic segment will be significant during the forecast period. Hospitals and clinics account for the larger share of this market. The surgeries for urinary incontinence and urinary retention, along with kidney and liver procedures, are more common in hospitals.
Product
Consumables
Instruments
Hospital labs and clinical diagnostic labs are the key revenue-generating end-user segments for urine culture-based consumables due to their low cost. The urinalysis consumables market will grow steadily during the forecast period due to an increase in people suffering from UTIs and other renal and liver diseases, which can be detected through urinalysis. The high rate of pregnancy in Asia, mostly in China and India, is one of the drivers for of market growth.
Geography
North America
Europe
Asia
Rest Of World (ROW)
38% of the market's growth will originate from North America during the forecast period. Factors such as the increase in the automation of laboratories and the high preference for point-of-care (POC) diagnostic tests will facilitate the urinalysis market growth in North America over the forecast period. This market research report entails detailed information on the competitive intelligence, marketing gaps, and regional opportunities in store for vendors, which will assist in creating efficient business plans. Detail Insights on impact of each segment and make informed business decisions Read Free Sample Report.
Urinalysis Market 2022-2026: Vendor Analysis and Scope
To help businesses improve their market position, the urinalysis market provides a detailed analysis of around 25 vendors operating in the market. Some of these vendors include Abbott Laboratories, Becton Dickinson and Co., Bio Rad Laboratories Inc., bioMerieux SA, AccuQuik Test Kits, ACON Laboratories Inc., ARKRAY Inc., BIOGENIX Inc. Pvt. Ltd., 77 Elektronika Kft, Cardinal Health Inc, Danaher Corp., Dirui Industrial Co. Ltd., F. Hoffmann La Roche Ltd., Medline Industries LP, Quidel Corp., Shenzhen Mindray BioMedical Electronics Co. Ltd, Siemens AG, Sysmex Corp, Thermo Fisher Scientific Inc., and URIT Medical Electronic Co. Ltd..
Abbott Laboratories - The company offers Urinalysis treatment through FISH pretreatment kit.
Becton Dickinson and Co. - The company offers Urinalysis treatment through Urinalysis cup kit, Urinalysis transfer straw kit, and Vacutainer with a closed system that helps prevent pouring off leakage and wet areas.
Bio Rad Laboratories Inc. - The company offers Urinalysis treatment through Urinalysis Controls to evaluate the precision of dipstick and microscopic testing procedures.
bioMerieux SA - The company offers Urinalysis treatment through CHROMID, CPS, and Elite tests.
The report also covers the following areas
:
Urinalysis Market size
Urinalysis Market trends
Urinalysis Market industry analysis
Market trends such as the integration of connectivity solutions for home care settings is likely to emerge as one of the primary drivers of the market. However, factors such as the high costs of automated urine analyzers is may threaten the growth of the market.
Urinalysis Market 2022-2026: Key Highlights
CAGR of the market during the forecast period 2022-2026
Detailed information on factors that will assist urinalysis market growth during the next five years
Estimation of the urinalysis market size and its contribution to the parent market
Predictions on upcoming trends and changes in consumer behavior
The growth of the urinalysis market
Analysis of the market's competitive landscape and detailed information on vendors
Comprehensive details of factors that will challenge the growth of urinalysis market vendors
Related Reports:
In-vitro Diagnostics Market by Technology and Geography - Forecast and Analysis 2022-2026
Molecular Microplate Readers and Washers Market by Product, End-user, and Geography - Forecast and Analysis 2022-2026
Table Of Contents:
1 Executive Summary
1.1 Market overview
Exhibit 01: Executive Summary – Chart on Market Overview
Exhibit 02: Executive Summary – Data Table on Market Overview
Exhibit 03: Executive Summary – Chart on Global Market Characteristics
Exhibit 04: Executive Summary – Chart on Market by Geography
Exhibit 05: Executive Summary – Chart on Market Segmentation by End-user
Exhibit 06: Executive Summary – Chart on Market Segmentation by Product
Exhibit 07: Executive Summary – Chart on Incremental Growth
Exhibit 08: Executive Summary – Data Table on Incremental Growth
Exhibit 09: Executive Summary – Chart on Vendor Market Positioning
2 Market Landscape
2.1 Market ecosystem
Exhibit 10: Parent market
Exhibit 11: Market Characteristics
3 Market Sizing
3.1 Market definition
Exhibit 12: Offerings of vendors included in the market definition
3.2 Market segment analysis
Exhibit 13: Market segments
3.3 Market size 2021
3.4 Market outlook: Forecast for 2021-2026
Exhibit 14: Chart on Global - Market size and forecast 2021-2026 ($ million)
Exhibit 15: Data Table on Global - Market size and forecast 2021-2026 ($ million)
Exhibit 16: Chart on Global Market: Year-over-year growth 2021-2026 (%)
Exhibit 17: Data Table on Global Market: Year-over-year growth 2021-2026 (%)
4 Five Forces Analysis
4.1 Five forces summary
Exhibit 18: Five forces analysis - Comparison between 2021 and 2026
4.2 Bargaining power of buyers
Exhibit 19: Chart on Bargaining power of buyers – Impact of key factors 2021 and 2026
4.3 Bargaining power of suppliers
Exhibit 20: Bargaining power of suppliers – Impact of key factors in 2021 and 2026
4.4 Threat of new entrants
Exhibit 21: Threat of new entrants – Impact of key factors in 2021 and 2026
4.5 Threat of substitutes
Exhibit 22: Threat of substitutes – Impact of key factors in 2021 and 2026
4.6 Threat of rivalry
Exhibit 23: Threat of rivalry – Impact of key factors in 2021 and 2026
4.7 Market condition
Exhibit 24: Chart on Market condition - Five forces 2021 and 2026
5 Market Segmentation by End-user
5.1 Market segments
Exhibit 25: Chart on End-user - Market share 2021-2026 (%)
Exhibit 26: Data Table on End-user - Market share 2021-2026 (%)
5.2 Comparison by End-user
Exhibit 27: Chart on Comparison by End-user
Exhibit 28: Data Table on Comparison by End-user
5.3 Hospital and clinics - Market size and forecast 2021-2026
Exhibit 29: Chart on Hospital and clinics - Market size and forecast 2021-2026 ($ million)
Exhibit 30: Data Table on Hospital and clinics - Market size and forecast 2021-2026 ($ million)
Exhibit 31: Chart on Hospital and clinics - Year-over-year growth 2021-2026 (%)
Exhibit 32: Data Table on Hospital and clinics - Year-over-year growth 2021-2026 (%)
5.4 Diagnostic laboratories - Market size and forecast 2021-2026
Exhibit 33: Chart on Diagnostic laboratories - Market size and forecast 2021-2026 ($ million)
Exhibit 34: Data Table on Diagnostic laboratories - Market size and forecast 2021-2026 ($ million)
Exhibit 35: Chart on Diagnostic laboratories - Year-over-year growth 2021-2026 (%)
Exhibit 36: Data Table on Diagnostic laboratories - Year-over-year growth 2021-2026 (%)
5.5 Home care settings - Market size and forecast 2021-2026
Exhibit 37: Chart on Home care settings - Market size and forecast 2021-2026 ($ million)
Exhibit 38: Data Table on Home care settings - Market size and forecast 2021-2026 ($ million)
Exhibit 39: Chart on Home care settings - Year-over-year growth 2021-2026 (%)
Exhibit 40: Data Table on Home care settings - Year-over-year growth 2021-2026 (%)
5.6 Market opportunity by End-user
Exhibit 41: Market opportunity by End-user ($ million)
6 Market Segmentation by Product
6.1 Market segments
Exhibit 42: Chart on Product - Market share 2021-2026 (%)
Exhibit 43: Data Table on Product - Market share 2021-2026 (%)
6.2 Comparison by Product
Exhibit 44: Chart on Comparison by Product
Exhibit 45: Data Table on Comparison by Product
6.3 Consumables - Market size and forecast 2021-2026
Exhibit 46: Chart on Consumables - Market size and forecast 2021-2026 ($ million)
Exhibit 47: Data Table on Consumables - Market size and forecast 2021-2026 ($ million)
Exhibit 48: Chart on Consumables - Year-over-year growth 2021-2026 (%)
Exhibit 49: Data Table on Consumables - Year-over-year growth 2021-2026 (%)
6.4 Instruments - Market size and forecast 2021-2026
Exhibit 50: Chart on Instruments - Market size and forecast 2021-2026 ($ million)
Exhibit 51: Data Table on Instruments - Market size and forecast 2021-2026 ($ million)
Exhibit 52: Chart on Instruments - Year-over-year growth 2021-2026 (%)
Exhibit 53: Data Table on Instruments - Year-over-year growth 2021-2026 (%)
6.5 Market opportunity by Product
Exhibit 54: Market opportunity by Product ($ million)
7 Customer Landscape
7.1 Customer landscape overview
Exhibit 55: Analysis of price sensitivity, lifecycle, customer purchase basket, adoption rates, and purchase criteria
8 Geographic Landscape
8.1 Geographic segmentation
Exhibit 56: Chart on Market share by geography 2021-2026 (%)
Exhibit 57: Data Table on Market share by geography 2021-2026 (%)
8.2 Geographic comparison
Exhibit 58: Chart on Geographic comparison
Exhibit 59: Data Table on Geographic comparison
8.3 North America - Market size and forecast 2021-2026
Exhibit 60: Chart on North America - Market size and forecast 2021-2026 ($ million)
Exhibit 61: Data Table on North America - Market size and forecast 2021-2026 ($ million)
Exhibit 62: Chart on North America - Year-over-year growth 2021-2026 (%)
Exhibit 63: Data Table on North America - Year-over-year growth 2021-2026 (%)
8.4 Europe - Market size and forecast 2021-2026
Exhibit 64: Chart on Europe - Market size and forecast 2021-2026 ($ million)
Exhibit 65: Data Table on Europe - Market size and forecast 2021-2026 ($ million)
Exhibit 66: Chart on Europe - Year-over-year growth 2021-2026 (%)
Exhibit 67: Data Table on Europe - Year-over-year growth 2021-2026 (%)
8.5 Asia - Market size and forecast 2021-2026
Exhibit 68: Chart on Asia - Market size and forecast 2021-2026 ($ million)
Exhibit 69: Data Table on Asia - Market size and forecast 2021-2026 ($ million)
Exhibit 70: Chart on Asia - Year-over-year growth 2021-2026 (%)
Exhibit 71: Data Table on Asia - Year-over-year growth 2021-2026 (%)
8.6 Rest of World (ROW) - Market size and forecast 2021-2026
Exhibit 72: Chart on Rest of World (ROW) - Market size and forecast 2021-2026 ($ million)
Exhibit 73: Data Table on Rest of World (ROW) - Market size and forecast 2021-2026 ($ million)
Exhibit 74: Chart on Rest of World (ROW) - Year-over-year growth 2021-2026 (%)
Exhibit 75: Data Table on Rest of World (ROW) - Year-over-year growth 2021-2026 (%)
8.7 US - Market size and forecast 2021-2026
Exhibit 76: Chart on US - Market size and forecast 2021-2026 ($ million)
Exhibit 77: Data Table on US - Market size and forecast 2021-2026 ($ million)
Exhibit 78: Chart on US - Year-over-year growth 2021-2026 (%)
Exhibit 79: Data Table on US - Year-over-year growth 2021-2026 (%)
8.8 China - Market size and forecast 2021-2026
Exhibit 80: Chart on China - Market size and forecast 2021-2026 ($ million)
Exhibit 81: Data Table on China - Market size and forecast 2021-2026 ($ million)
Exhibit 82: Chart on China - Year-over-year growth 2021-2026 (%)
Exhibit 83: Data Table on China - Year-over-year growth 2021-2026 (%)
8.9 Germany - Market size and forecast 2021-2026
Exhibit 84: Chart on Germany - Market size and forecast 2021-2026 ($ million)
Exhibit 85: Data Table on Germany - Market size and forecast 2021-2026 ($ million)
Exhibit 86: Chart on Germany - Year-over-year growth 2021-2026 (%)
Exhibit 87: Data Table on Germany - Year-over-year growth 2021-2026 (%)
8.10 UK - Market size and forecast 2021-2026
Exhibit 88: Chart on UK - Market size and forecast 2021-2026 ($ million)
Exhibit 89: Data Table on UK - Market size and forecast 2021-2026 ($ million)
Exhibit 90: Chart on UK - Year-over-year growth 2021-2026 (%)
Exhibit 91: Data Table on UK - Year-over-year growth 2021-2026 (%)
8.11 Japan - Market size and forecast 2021-2026
Exhibit 92: Chart on Japan - Market size and forecast 2021-2026 ($ million)
Exhibit 93: Data Table on Japan - Market size and forecast 2021-2026 ($ million)
Exhibit 94: Chart on Japan - Year-over-year growth 2021-2026 (%)
Exhibit 95: Data Table on Japan - Year-over-year growth 2021-2026 (%)
8.12 Market opportunity by geography
Exhibit 96: Market opportunity by geography ($ million)
9 Drivers, Challenges, and Trends
9.1 Market drivers
9.2 Market challenges
9.3 Impact of drivers and challenges
Exhibit 97: Impact of drivers and challenges in 2021 and 2026
9.4 Market trends
10 Vendor Landscape
10.1 Overview
10.2 Vendor landscape
Exhibit 98: Overview on Criticality of inputs and Factors of differentiation
10.3 Landscape disruption
Exhibit 99: Overview on factors of disruption
10.4 Industry risks
Exhibit 100: Impact of key risks on business
11 Vendor Analysis
11.1 Vendors covered
Exhibit 101: Vendors covered
11.2 Market positioning of vendors
Exhibit 102: Matrix on vendor position and classification
11.3 Abbott Laboratories
Exhibit 103: Abbott Laboratories - Overview
Exhibit 104: Abbott Laboratories - Business segments
Exhibit 105: Abbott Laboratories - Key news
Exhibit 106: Abbott Laboratories - Key offerings
Exhibit 107: Abbott Laboratories - Segment focus
Exhibit 108: Becton Dickinson and Co. - Overview
Exhibit 109: Becton Dickinson and Co. - Business segments
Exhibit 110: Becton Dickinson and Co. - Key news
Exhibit 111: Becton Dickinson and Co. - Key offerings
Exhibit 112: Becton Dickinson and Co. - Segment focus
Exhibit 113: Bio Rad Laboratories Inc. - Overview
Exhibit 114: Bio Rad Laboratories Inc. - Business segments
Exhibit 115: Bio Rad Laboratories Inc. - Key news
Exhibit 116: Bio Rad Laboratories Inc. - Key offerings
Exhibit 117: Bio Rad Laboratories Inc. - Segment focus
11.6 bioMerieux SA
Exhibit 118: bioMerieux SA - Overview
Exhibit 119: bioMerieux SA - Product / Service
Exhibit 120: bioMerieux SA - Key news
Exhibit 121: bioMerieux SA - Key offerings
11.7 Cardinal Health Inc
Exhibit 122: Cardinal Health Inc - Overview
Exhibit 123: Cardinal Health Inc - Business segments
Exhibit 124: Cardinal Health Inc - Key news
Exhibit 125: Cardinal Health Inc - Key offerings
Exhibit 126: Cardinal Health Inc - Segment focus
11.8 Danaher Corp.
Exhibit 127: Danaher Corp. - Overview
Exhibit 128: Danaher Corp. - Business segments
Exhibit 129: Danaher Corp. - Key news
Exhibit 130: Danaher Corp. - Key offerings
Exhibit 131: Danaher Corp. - Segment focus
Exhibit 132: F. Hoffmann La Roche Ltd. - Overview
Exhibit 133: F. Hoffmann La Roche Ltd. - Business segments
Exhibit 134: F. Hoffmann La Roche Ltd. - Key news
Exhibit 135: F. Hoffmann La Roche Ltd. - Key offerings
Exhibit 136: F. Hoffmann La Roche Ltd. - Segment focus
11.10 Quidel Corp.
Exhibit 137: Quidel Corp. - Overview
Exhibit 138: Quidel Corp. - Product / Service
Exhibit 139: Quidel Corp. - Key offerings
11.11 Siemens AG
Exhibit 140: Siemens AG - Overview
Exhibit 141: Siemens AG - Business segments
Exhibit 142: Siemens AG - Key news
Exhibit 143: Siemens AG - Key offerings
Exhibit 144: Siemens AG - Segment focus
Exhibit 145: Thermo Fisher Scientific Inc. - Overview
Exhibit 146: Thermo Fisher Scientific Inc. - Business segments
Exhibit 147: Thermo Fisher Scientific Inc. - Key news
Exhibit 148: Thermo Fisher Scientific Inc. - Key offerings
Exhibit 149: Thermo Fisher Scientific Inc. - Segment focus
12.1 Scope of the report
12.2 Inclusions and exclusions checklist
Exhibit 150: Inclusions checklist
Exhibit 151: Exclusions checklist
12.3 Currency conversion rates for US$
Exhibit 152: Currency conversion rates for US$
12.4 Research methodology
Exhibit 153: Research methodology
Exhibit 154: Validation techniques employed for market sizing
Exhibit 155: Information sources
12.5 List of abbreviations
Exhibit 156: List of abbreviations
About Us
Technavio is a leading global technology research and advisory company. Their research and analysis focus on emerging market trends and provides actionable insights to help businesses identify market opportunities and develop effective strategies to optimize their market positions. With over 500 specialized analysts, Technavio's report library consists of more than 17,000 reports and counting, covering 800 technologies, spanning across 50 countries. Their client base consists of enterprises of all sizes, including more than 100 Fortune 500 companies. This growing client base relies on Technavio's comprehensive coverage, extensive research, and actionable market insights to identify opportunities in existing and potential markets and assess their competitive positions within changing market scenarios.
Contact
Technavio Research
Jesse Maida
US: +1 844 364 1100
UK: +44 203 893 3200
Email: [email protected]
Website: www.technavio.com/
SOURCE Technavio
For more details,please visit the original website
The content of the article does not represent any opinions of Synapse and its affiliated companies. If there is any copyright infringement or error, please contact us, and we will deal with it within 24 hours.
Organizations


Targets
-Drugs
-Chat with Hiro
Hot reports


Get started for free today!
Accelerate Strategic R&D decision making with Synapse, PatSnap’s AI-powered Connected Innovation Intelligence Platform Built for Life Sciences Professionals.
Start your data trial now!
Synapse data is also accessible to external entities via APIs or data packages. Empower better decisions with the latest in pharmaceutical intelligence.