Myoglobin Market to record USD 99.2 Mn growth -- Driven by usage of myoglobin as a biomarker for the diagnosis of ACS and muscle injuries
09 Sep 2022
NEW YORK, Sept. 9, 2022 /PRNewswire/ -- The "
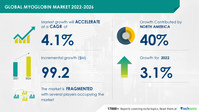
Myoglobin Market by Type and Geography - Forecast and Analysis 2022-2026" report has been added to Technavio's offering. The report expects the market size to grow by USD 99.2 million between 2021 and 2026, expanding at a CAGR of 4.1% during the forecast period. The report considers various aspects such as the consumer base, adoption rate, average selling price, revenue generated by vendors, and various other factors to estimate the market size.
Download Sample PDF Report
Preview
Source: PRNewswire
Attractive Opportunities in Myoglobin Market by Type and Geography - Forecast and Analysis 2022-2026
The global myoglobin market is fragmented. The market is moderately competitive and has the presence of several prominent vendors. Prominent vendors have established a sizeable market presence. The competition in the market will become more intense with the growing demand for myoglobin assays from rapid response laboratories and other healthcare facilities for emergency diagnostic patient management.
Vendors need to continuously innovate their offerings and build capabilities with less service differentiation. This enables vendors to compete with larger players more effectively, intensifying competition in the market. The increasing regulatory standards and high capital requirements for setting up new production facilities ensure that the threat of emerging players in the market is low. Thus, the global myoglobin market is expected to witness moderate competition during the forecast period.
The report identifies Abbott Laboratories, BBI Solutions, Bio Rad Laboratories Inc., bioMerieux SA, Boditech Med Inc., Danaher Corp., DiaSys Diagnostic Systems GmbH, F. Hoffmann La Roche Ltd., General Atomics, HORIBA Ltd., Merck KGaA, OriGene Technologies Inc., Ortho-Clinical Diagnostics Inc., PerkinElmer Inc., Randox Laboratories Ltd., Scripps Laboratories Inc., Siemens Healthineers AG, Thermo Fisher Scientific Inc., and Tosoh Corp. as some of the major market participants.
The usage of myoglobin as a biomarker for the diagnosis of ACS and muscle will offer immense growth opportunities. To leverage the current opportunities, market vendors must strengthen their foothold in the fast-growing segments while maintaining their positions in the slow-growing segments.
Request Sample Report Here
Myoglobin Market 2022-2026: Segmentation
Type
Animal Myoglobin
Human Myoglobin
The market growth in the animal myoglobin segment will be significant over the forecast period. The segment is driven by the availability of a range of animal myoglobin products.
Geography
North America
Europe
Asia
Rest Of World (ROW)
North America will emerge as the major market, occupying 40% of the global market share. Factors such as the well-established biotechnology industry in the US and the growing investments in the research and development (R&D) of cardiac biomarkers drive the growth of the regional market. The report also covers the following areas:
Myoglobin Market Size
Myoglobin Market Trends
Myoglobin Market Industry Analysis
Myoglobin Market 2022-2026: Key Highlights
CAGR of the market during the forecast period 2022-2026
Detailed information on factors that will assist myoglobin market growth during the next five years
Estimation of the myoglobin market size and its contribution to the parent market
Predictions on upcoming trends and changes in consumer behavior
The growth of the myoglobin market
Analysis of the market's competitive landscape and detailed information on vendors
Comprehensive details of factors that will challenge the growth of myoglobin market vendors
Related Reports:
Recombinant Proteins Market by Application and Geography - Forecast and Analysis 2022-2026
Neurological Biomarkers Market by Indication, End-user, and Geography - Forecast and Analysis 2022-2026
Table of Contents:
1 Executive Summary
1.1 Market overview
Exhibit 01: Executive Summary – Chart on Market Overview
Exhibit 02: Executive Summary – Data Table on Market Overview
Exhibit 03: Executive Summary – Chart on Global Market Characteristics
Exhibit 04: Executive Summary – Chart on Market by Geography
Exhibit 05: Executive Summary – Chart on Market Segmentation by Type
Exhibit 06: Executive Summary – Chart on Incremental Growth
Exhibit 07: Executive Summary – Data Table on Incremental Growth
Exhibit 08: Executive Summary – Chart on Vendor Market Positioning
2 Market Landscape
2.1 Market ecosystem
Exhibit 09: Parent market
Exhibit 10: Market Characteristics
3 Market Sizing
3.1 Market definition
Exhibit 11: Offerings of vendors included in the market definition
3.2 Market segment analysis
Exhibit 12: Market segments
3.3 Market size 2021
3.4 Market outlook: Forecast for 2021-2026
Exhibit 13: Chart on Global - Market size and forecast 2021-2026 ($ million)
Exhibit 14: Data Table on Global - Market size and forecast 2021-2026 ($ million)
Exhibit 15: Chart on Global Market: Year-over-year growth 2021-2026 (%)
Exhibit 16: Data Table on Global Market: Year-over-year growth 2021-2026 (%)
4 Five Forces Analysis
4.1 Five forces summary
Exhibit 17: Five forces analysis - Comparison between 2021 and 2026
4.2 Bargaining power of buyers
Exhibit 18: Chart on Bargaining power of buyers – Impact of key factors 2021 and 2026
4.3 Bargaining power of suppliers
Exhibit 19: Bargaining power of suppliers – Impact of key factors in 2021 and 2026
4.4 Threat of new entrants
Exhibit 20: Threat of new entrants – Impact of key factors in 2021 and 2026
4.5 Threat of substitutes
Exhibit 21: Threat of substitutes – Impact of key factors in 2021 and 2026
4.6 Threat of rivalry
Exhibit 22: Threat of rivalry – Impact of key factors in 2021 and 2026
4.7 Market condition
Exhibit 23: Chart on Market condition - Five forces 2021 and 2026
5 Market Segmentation by Type
5.1 Market segments
Exhibit 24: Chart on Type - Market share 2021-2026 (%)
Exhibit 25: Data Table on Type - Market share 2021-2026 (%)
5.2 Comparison by Type
Exhibit 26: Chart on Comparison by Type
Exhibit 27: Data Table on Comparison by Type
5.3 Animal myoglobin - Market size and forecast 2021-2026
Exhibit 28: Chart on Animal myoglobin - Market size and forecast 2021-2026 ($ million)
Exhibit 29: Data Table on Animal myoglobin - Market size and forecast 2021-2026 ($ million)
Exhibit 30: Chart on Animal myoglobin - Year-over-year growth 2021-2026 (%)
Exhibit 31: Data Table on Animal myoglobin - Year-over-year growth 2021-2026 (%)
5.4 Human myoglobin - Market size and forecast 2021-2026
Exhibit 32: Chart on Human myoglobin - Market size and forecast 2021-2026 ($ million)
Exhibit 33: Data Table on Human myoglobin - Market size and forecast 2021-2026 ($ million)
Exhibit 34: Chart on Human myoglobin - Year-over-year growth 2021-2026 (%)
Exhibit 35: Data Table on Human myoglobin - Year-over-year growth 2021-2026 (%)
5.5 Market opportunity by Type
Exhibit 36: Market opportunity by Type ($ million)
6 Customer Landscape
6.1 Customer landscape overview
Exhibit 37: Analysis of price sensitivity, lifecycle, customer purchase basket, adoption rates, and purchase criteria
7 Geographic Landscape
7.1 Geographic segmentation
Exhibit 38: Chart on Market share by geography 2021-2026 (%)
Exhibit 39: Data Table on Market share by geography 2021-2026 (%)
7.2 Geographic comparison
Exhibit 40: Chart on Geographic comparison
Exhibit 41: Data Table on Geographic comparison
7.3 North America - Market size and forecast 2021-2026
Exhibit 42: Chart on North America - Market size and forecast 2021-2026 ($ million)
Exhibit 43: Data Table on North America - Market size and forecast 2021-2026 ($ million)
Exhibit 44: Chart on North America - Year-over-year growth 2021-2026 (%)
Exhibit 45: Data Table on North America - Year-over-year growth 2021-2026 (%)
7.4 Europe - Market size and forecast 2021-2026
Exhibit 46: Chart on Europe - Market size and forecast 2021-2026 ($ million)
Exhibit 47: Data Table on Europe - Market size and forecast 2021-2026 ($ million)
Exhibit 48: Chart on Europe - Year-over-year growth 2021-2026 (%)
Exhibit 49: Data Table on Europe - Year-over-year growth 2021-2026 (%)
7.5 Asia - Market size and forecast 2021-2026
Exhibit 50: Chart on Asia - Market size and forecast 2021-2026 ($ million)
Exhibit 51: Data Table on Asia - Market size and forecast 2021-2026 ($ million)
Exhibit 52: Chart on Asia - Year-over-year growth 2021-2026 (%)
Exhibit 53: Data Table on Asia - Year-over-year growth 2021-2026 (%)
7.6 Rest of World (ROW) - Market size and forecast 2021-2026
Exhibit 54: Chart on Rest of World (ROW) - Market size and forecast 2021-2026 ($ million)
Exhibit 55: Data Table on Rest of World (ROW) - Market size and forecast 2021-2026 ($ million)
Exhibit 56: Chart on Rest of World (ROW) - Year-over-year growth 2021-2026 (%)
Exhibit 57: Data Table on Rest of World (ROW) - Year-over-year growth 2021-2026 (%)
7.7 US - Market size and forecast 2021-2026
Exhibit 58: Chart on US - Market size and forecast 2021-2026 ($ million)
Exhibit 59: Data Table on US - Market size and forecast 2021-2026 ($ million)
Exhibit 60: Chart on US - Year-over-year growth 2021-2026 (%)
Exhibit 61: Data Table on US - Year-over-year growth 2021-2026 (%)
7.8 China - Market size and forecast 2021-2026
Exhibit 62: Chart on China - Market size and forecast 2021-2026 ($ million)
Exhibit 63: Data Table on China - Market size and forecast 2021-2026 ($ million)
Exhibit 64: Chart on China - Year-over-year growth 2021-2026 (%)
Exhibit 65: Data Table on China - Year-over-year growth 2021-2026 (%)
7.9 Germany - Market size and forecast 2021-2026
Exhibit 66: Chart on Germany - Market size and forecast 2021-2026 ($ million)
Exhibit 67: Data Table on Germany - Market size and forecast 2021-2026 ($ million)
Exhibit 68: Chart on Germany - Year-over-year growth 2021-2026 (%)
Exhibit 69: Data Table on Germany - Year-over-year growth 2021-2026 (%)
7.10 Canada - Market size and forecast 2021-2026
Exhibit 70: Chart on Canada - Market size and forecast 2021-2026 ($ million)
Exhibit 71: Data Table on Canada - Market size and forecast 2021-2026 ($ million)
Exhibit 72: Chart on Canada - Year-over-year growth 2021-2026 (%)
Exhibit 73: Data Table on Canada - Year-over-year growth 2021-2026 (%)
7.11 UK - Market size and forecast 2021-2026
Exhibit 74: Chart on UK - Market size and forecast 2021-2026 ($ million)
Exhibit 75: Data Table on UK - Market size and forecast 2021-2026 ($ million)
Exhibit 76: Chart on UK - Year-over-year growth 2021-2026 (%)
Exhibit 77: Data Table on UK - Year-over-year growth 2021-2026 (%)
7.12 Market opportunity by geography
Exhibit 78: Market opportunity by geography ($ million)
8 Drivers, Challenges, and Trends
8.1 Market drivers
8.2 Market challenges
8.3 Impact of drivers and challenges
Exhibit 79: Impact of drivers and challenges in 2021 and 2026
8.4 Market trends
9 Vendor Landscape
9.1 Overview
9.2 Vendor landscape
Exhibit 80: Overview on Criticality of inputs and Factors of differentiation
9.3 Landscape disruption
Exhibit 81: Overview on factors of disruption
9.4 Industry risks
Exhibit 82: Impact of key risks on business
10 Vendor Analysis
10.1 Vendors covered
Exhibit 83: Vendors covered
10.2 Market positioning of vendors
Exhibit 84: Matrix on vendor position and classification
10.3 Abbott Laboratories
Exhibit 85: Abbott Laboratories - Overview
Exhibit 86: Abbott Laboratories - Business segments
Exhibit 87: Abbott Laboratories - Key news
Exhibit 88: Abbott Laboratories - Key offerings
Exhibit 89: Abbott Laboratories - Segment focus
Exhibit 90: Bio Rad Laboratories Inc. - Overview
Exhibit 91: Bio Rad Laboratories Inc. - Business segments
Exhibit 92: Bio Rad Laboratories Inc. - Key news
Exhibit 93: Bio Rad Laboratories Inc. - Key offerings
Exhibit 94: Bio Rad Laboratories Inc. - Segment focus
10.5 F. Hoffmann La Roche Ltd.
Exhibit 95: F. Hoffmann La Roche Ltd. - Overview
Exhibit 96: F. Hoffmann La Roche Ltd. - Business segments
Exhibit 97: F. Hoffmann La Roche Ltd. - Key news
Exhibit 98: F. Hoffmann La Roche Ltd. - Key offerings
Exhibit 99: F. Hoffmann La Roche Ltd. - Segment focus
10.6 Merck KGaA
Exhibit 100: Merck KGaA - Overview
Exhibit 101: Merck KGaA - Business segments
Exhibit 102: Merck KGaA - Key news
Exhibit 103: Merck KGaA - Key offerings
Exhibit 104: Merck KGaA - Segment focus
Exhibit 105: OriGene Technologies Inc. - Overview
Exhibit 106: OriGene Technologies Inc. - Product / Service
Exhibit 107: OriGene Technologies Inc. - Key offerings
10.8 PerkinElmer Inc.
Exhibit 108: PerkinElmer Inc. - Overview
Exhibit 109: PerkinElmer Inc. - Business segments
Exhibit 110: PerkinElmer Inc. - Key news
Exhibit 111: PerkinElmer Inc. - Key offerings
Exhibit 112: PerkinElmer Inc. - Segment focus
Exhibit 113: Randox Laboratories Ltd. - Overview
Exhibit 114: Randox Laboratories Ltd. - Product / Service
Exhibit 115: Randox Laboratories Ltd. - Key offerings
Exhibit 116: Scripps Laboratories Inc. - Overview
Exhibit 117: Scripps Laboratories Inc. - Product / Service
Exhibit 118: Scripps Laboratories Inc. - Key offerings
Exhibit 119: Thermo Fisher Scientific Inc. - Overview
Exhibit 120: Thermo Fisher Scientific Inc. - Business segments
Exhibit 121: Thermo Fisher Scientific Inc. - Key news
Exhibit 122: Thermo Fisher Scientific Inc. - Key offerings
Exhibit 123: Thermo Fisher Scientific Inc. - Segment focus
10.12 Tosoh Corp.
Exhibit 124: Tosoh Corp. - Overview
Exhibit 125: Tosoh Corp. - Business segments
Exhibit 126: Tosoh Corp. - Key offerings
Exhibit 127: Tosoh Corp. - Segment focus
11.1 Scope of the report
11.2 Inclusions and exclusions checklist
Exhibit 128: Inclusions checklist
Exhibit 129: Exclusions checklist
11.3 Currency conversion rates for US$
Exhibit 130: Currency conversion rates for US$
11.4 Research methodology
Exhibit 131: Research methodology
Exhibit 132: Validation techniques employed for market sizing
Exhibit 133: Information sources
11.5 List of abbreviations
Exhibit 134: List of abbreviations
About Us
Technavio is a leading global technology research and advisory company. Their research and analysis focus on emerging market trends and provides actionable insights to help businesses identify market opportunities and develop effective strategies to optimize their market positions. With over 500 specialized analysts, Technavio's report library consists of more than 17,000 reports and counting, covering 800 technologies, spanning across 50 countries. Their client base consists of enterprises of all sizes, including more than 100 Fortune 500 companies. This growing client base relies on Technavio's comprehensive coverage, extensive research, and actionable market insights to identify opportunities in existing and potential markets and assess their competitive positions within changing market scenarios.
Contact
Technavio Research
Jesse Maida
US: +1 844 364 1100
UK: +44 203 893 3200
Email: [email protected]
Website: www.technavio.com/
SOURCE Technavio
For more details,please visit the original website
The content of the article does not represent any opinions of Synapse and its affiliated companies. If there is any copyright infringement or error, please contact us, and we will deal with it within 24 hours.
Organizations
Indications
Targets
-Drugs
-Hot reports


Get started for free today!
Accelerate Strategic R&D decision making with Synapse, PatSnap’s AI-powered Connected Innovation Intelligence Platform Built for Life Sciences Professionals.
Start your data trial now!
Synapse data is also accessible to external entities via APIs or data packages. Leverages most recent intelligence information, enabling fullest potential.