Ambulatory healthcare service market to grow by 5.68% Y-O-Y from 2022 to 2023: Increasing Prevalence of Infectious Diseases will Drive Growth - Technavio
05 Dec 2022
NEW YORK, Dec. 5, 2022 /PRNewswire/ --
Ambulatory healthcare service market insights -
Continue Reading
Preview
Source: PRNewswire
Technavio has announced its latest market research report titled Global Ambulatory Healthcare Service Market 2023-2027
Vendors: 15+, Including Aspen Healthcare Ltd., DaVita Inc., EBOS Group Ltd., Envision Healthcare, Fresenius SE and Co. KGaA, HCA Healthcare Inc., Medical Facilities Corp., Sonic Healthcare Ltd., Suomen Terveystalo Oy, and Surgery Partners Inc., among others
Coverage: Parent market analysis; key drivers, major trends, and challenges; customer and vendor landscape; vendor product insights and recent developments; key vendors; and market positioning of vendors
Segments: Type, Application, and Geography
To understand more about the ambulatory healthcare service market, request a sample report
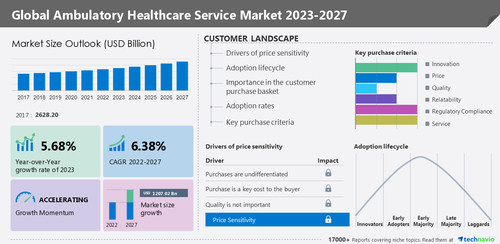
In 2017, the ambulatory healthcare service market was valued at
USD 2628.20 billion. From a regional perspective,
North America held the largest market share, valued at
USD 1,058.88 billion. The
ambulatory healthcare service market size is estimated to grow by
USD 1207.02 billion from 2022 to 2027 at a CAGR of
6.38% according to Technavio.
Ambulatory healthcare service market -
To help companies evaluate and develop growth strategies, the report outlines –
Key purchase criteria
Adoption rates
Adoption lifecycle
Drivers of price sensitivity
For highlights on customer landscape analysis,
download a report sample!
Ambulatory healthcare service market - Vendor Insights
The global ambulatory healthcare service market is concentrated. Some of the vendors in the market are losing their market share to small- and medium-sized vendors owing to price differentiation. Hence, they are adopting competitive pricing to consolidate their shares in the market. The competitive environment in this market is expected to intensify with technological innovations and product extensions and an increase in M&A activities. Technavio report analyzes the market's competitive landscape and offers information on several market vendors including -
Aspen Healthcare Ltd. - The company offers ambulatory healthcare services such as Cancer Center London.
DaVita Inc. - The company offers ambulatory healthcare services such as DaVita Integrated Kidney Care.
EBOS Group Ltd. - The company offers ambulatory healthcare services through its subsidiary Symbion Hospital Services.
Ambulatory healthcare service market - Market Dynamics
Increasing prevalence of infectious diseases
Growing geriatric population
Rising demand for minimally-invasive surgeries
Intensifying vendor competition
Lack of trained personnel in the hospitals
Stringent regulations
Drivers and challenges have an impact on market dynamics, which can impact businesses. Find more insights in a sample report!
The ambulatory healthcare service market report provides critical information and factual data, with a qualitative and quantitative study of the market based on market drivers and limitations as well as future prospects.
Why buy?
Add credibility to strategies
Analyze competitor's offerings
Get a holistic view of the market
Grow your profit margins with Technavio -
Buy the Report
What are the key data covered in this ambulatory healthcare service market report?
CAGR of the market during the forecast period.
Detailed information on factors that will drive the growth of the ambulatory healthcare service market between 2023 and 2027
Precise estimation of the ambulatory healthcare service market size and its contribution to the parent market.
Accurate predictions about upcoming trends and changes in consumer behavior.
Growth of the industry across North America, Europe, Asia, and Rest of World (ROW).
Thorough analysis of the market's competitive landscape and detailed information about vendors.
Comprehensive analysis of factors that will challenge the growth of ambulatory healthcare service market vendors.
Related Reports:
The
fertility services market size is expected to increase by USD 5.27 billion from 2020 to 2025, and the market's growth momentum will accelerate at a CAGR of 5.64%. The rising prevalence of late parenthood is notably driving the fertility services market growth, although factors such as the high complication rate in fertility services may impede the market growth.
The
biopharmaceutical analytical testing services market size is expected to increase by USD 2.83 billion from 2021 to 2026, and the market's growth momentum will accelerate at a CAGR of 12.41%. The advanced route optimization strengthens shippers, LSPs, and carriers is notably driving the biopharmaceutical analytical testing services market growth, although factors such as security concerns may impede the market growth.
Table of Contents:
1 Executive Summary
1.1 Market overview
Exhibit 01: Executive Summary – Chart on Market Overview
Exhibit 02: Executive Summary – Data Table on Market Overview
Exhibit 03: Executive Summary – Chart on Global Market Characteristics
Exhibit 04: Executive Summary – Chart on Market by Geography
Exhibit 05: Executive Summary – Chart on Market Segmentation by Type
Exhibit 06: Executive Summary – Chart on Market Segmentation by Application
Exhibit 07: Executive Summary – Chart on Incremental Growth
Exhibit 08: Executive Summary – Data Table on Incremental Growth
Exhibit 09: Executive Summary – Chart on Vendor Market Positioning
2 Market Landscape
2.1 Market ecosystem
Exhibit 10: Parent market
Exhibit 11: Market Characteristics
3 Market Sizing
3.1 Market definition
Exhibit 12: Offerings of vendors included in the market definition
3.2 Market segment analysis
Exhibit 13: Market segments
3.3 Market size 2022
3.4 Market outlook: Forecast for 2022-2027
Exhibit 14: Chart on Global - Market size and forecast 2022-2027 ($ billion)
Exhibit 15: Data Table on Global - Market size and forecast 2022-2027 ($ billion)
Exhibit 16: Chart on Global Market: Year-over-year growth 2022-2027 (%)
Exhibit 17: Data Table on Global Market: Year-over-year growth 2022-2027 (%)
4 Historic Market Size
4.1 Global ambulatory healthcare service market 2017 - 2021
Exhibit 18: Historic Market Size – Data Table on Global ambulatory healthcare service market 2017 - 2021 ($ billion)
4.2 Type Segment Analysis 2017 - 2021
Exhibit 19: Historic Market Size – Type Segment 2017 - 2021 ($ billion)
4.3 Application Segment Analysis 2017 - 2021
Exhibit 20: Historic Market Size – Application Segment 2017 - 2021 ($ billion)
4.4 Geography Segment Analysis 2017 - 2021
Exhibit 21: Historic Market Size – Geography Segment 2017 - 2021 ($ billion)
4.5 Country Segment Analysis 2017 - 2021
Exhibit 22: Historic Market Size – Country Segment 2017 - 2021 ($ billion)
5 Five Forces Analysis
5.1 Five forces summary
Exhibit 23: Five forces analysis - Comparison between 2022 and 2027
5.2 Bargaining power of buyers
Exhibit 24: Chart on Bargaining power of buyers – Impact of key factors 2022 and 2027
5.3 Bargaining power of suppliers
Exhibit 25: Bargaining power of suppliers – Impact of key factors in 2022 and 2027
5.4 Threat of new entrants
Exhibit 26: Threat of new entrants – Impact of key factors in 2022 and 2027
5.5 Threat of substitutes
Exhibit 27: Threat of substitutes – Impact of key factors in 2022 and 2027
5.6 Threat of rivalry
Exhibit 28: Threat of rivalry – Impact of key factors in 2022 and 2027
5.7 Market condition
Exhibit 29: Chart on Market condition - Five forces 2022 and 2027
6 Market Segmentation by Type
6.1 Market segments
Exhibit 30: Chart on Type - Market share 2022-2027 (%)
Exhibit 31: Data Table on Type - Market share 2022-2027 (%)
6.2 Comparison by Type
Exhibit 32: Chart on Comparison by Type
Exhibit 33: Data Table on Comparison by Type
6.3 Primary care offices - Market size and forecast 2022-2027
Exhibit 34: Chart on Primary care offices - Market size and forecast 2022-2027 ($ billion)
Exhibit 35: Data Table on Primary care offices - Market size and forecast 2022-2027 ($ billion)
Exhibit 36: Chart on Primary care offices - Year-over-year growth 2022-2027 (%)
Exhibit 37: Data Table on Primary care offices - Year-over-year growth 2022-2027 (%)
6.4 Emergency departments - Market size and forecast 2022-2027
Exhibit 38: Chart on Emergency departments - Market size and forecast 2022-2027 ($ billion)
Exhibit 39: Data Table on Emergency departments - Market size and forecast 2022-2027 ($ billion)
Exhibit 40: Chart on Emergency departments - Year-over-year growth 2022-2027 (%)
Exhibit 41: Data Table on Emergency departments - Year-over-year growth 2022-2027 (%)
6.5 Medical specialty offices - Market size and forecast 2022-2027
Exhibit 42: Chart on Medical specialty offices - Market size and forecast 2022-2027 ($ billion)
Exhibit 43: Data Table on Medical specialty offices - Market size and forecast 2022-2027 ($ billion)
Exhibit 44: Chart on Medical specialty offices - Year-over-year growth 2022-2027 (%)
Exhibit 45: Data Table on Medical specialty offices - Year-over-year growth 2022-2027 (%)
6.6 Surgical specialty offices - Market size and forecast 2022-2027
Exhibit 46: Chart on Surgical specialty offices - Market size and forecast 2022-2027 ($ billion)
Exhibit 47: Data Table on Surgical specialty offices - Market size and forecast 2022-2027 ($ billion)
Exhibit 48: Chart on Surgical specialty offices - Year-over-year growth 2022-2027 (%)
Exhibit 49: Data Table on Surgical specialty offices - Year-over-year growth 2022-2027 (%)
6.7 Market opportunity by Type
Exhibit 50: Market opportunity by Type ($ billion)
7 Market Segmentation by Application
7.1 Market segments
Exhibit 51: Chart on Application - Market share 2022-2027 (%)
Exhibit 52: Data Table on Application - Market share 2022-2027 (%)
7.2 Comparison by Application
Exhibit 53: Chart on Comparison by Application
Exhibit 54: Data Table on Comparison by Application
7.3 Ophthalmology - Market size and forecast 2022-2027
Exhibit 55: Chart on Ophthalmology - Market size and forecast 2022-2027 ($ billion)
Exhibit 56: Data Table on Ophthalmology - Market size and forecast 2022-2027 ($ billion)
Exhibit 57: Chart on Ophthalmology - Year-over-year growth 2022-2027 (%)
Exhibit 58: Data Table on Ophthalmology - Year-over-year growth 2022-2027 (%)
7.4 Gastroenterology - Market size and forecast 2022-2027
Exhibit 59: Chart on Gastroenterology - Market size and forecast 2022-2027 ($ billion)
Exhibit 60: Data Table on Gastroenterology - Market size and forecast 2022-2027 ($ billion)
Exhibit 61: Chart on Gastroenterology - Year-over-year growth 2022-2027 (%)
Exhibit 62: Data Table on Gastroenterology - Year-over-year growth 2022-2027 (%)
7.5 Orthopedics - Market size and forecast 2022-2027
Exhibit 63: Chart on Orthopedics - Market size and forecast 2022-2027 ($ billion)
Exhibit 64: Data Table on Orthopedics - Market size and forecast 2022-2027 ($ billion)
Exhibit 65: Chart on Orthopedics - Year-over-year growth 2022-2027 (%)
Exhibit 66: Data Table on Orthopedics - Year-over-year growth 2022-2027 (%)
7.6 Pain management - Market size and forecast 2022-2027
Exhibit 67: Chart on Pain management - Market size and forecast 2022-2027 ($ billion)
Exhibit 68: Data Table on Pain management - Market size and forecast 2022-2027 ($ billion)
Exhibit 69: Chart on Pain management - Year-over-year growth 2022-2027 (%)
Exhibit 70: Data Table on Pain management - Year-over-year growth 2022-2027 (%)
7.7 Others - Market size and forecast 2022-2027
Exhibit 71: Chart on Others - Market size and forecast 2022-2027 ($ billion)
Exhibit 72: Data Table on Others - Market size and forecast 2022-2027 ($ billion)
Exhibit 73: Chart on Others - Year-over-year growth 2022-2027 (%)
Exhibit 74: Data Table on Others - Year-over-year growth 2022-2027 (%)
7.8 Market opportunity by Application
Exhibit 75: Market opportunity by Application ($ billion)
8 Customer Landscape
8.1 Customer landscape overview
Exhibit 76: Analysis of price sensitivity, lifecycle, customer purchase basket, adoption rates, and purchase criteria
9 Geographic Landscape
9.1 Geographic segmentation
Exhibit 77: Chart on Market share by geography 2022-2027 (%)
Exhibit 78: Data Table on Market share by geography 2022-2027 (%)
9.2 Geographic comparison
Exhibit 79: Chart on Geographic comparison
Exhibit 80: Data Table on Geographic comparison
9.3 North America - Market size and forecast 2022-2027
Exhibit 81: Chart on North America - Market size and forecast 2022-2027 ($ billion)
Exhibit 82: Data Table on North America - Market size and forecast 2022-2027 ($ billion)
Exhibit 83: Chart on North America - Year-over-year growth 2022-2027 (%)
Exhibit 84: Data Table on North America - Year-over-year growth 2022-2027 (%)
9.4 Europe - Market size and forecast 2022-2027
Exhibit 85: Chart on Europe - Market size and forecast 2022-2027 ($ billion)
Exhibit 86: Data Table on Europe - Market size and forecast 2022-2027 ($ billion)
Exhibit 87: Chart on Europe - Year-over-year growth 2022-2027 (%)
Exhibit 88: Data Table on Europe - Year-over-year growth 2022-2027 (%)
9.5 Asia - Market size and forecast 2022-2027
Exhibit 89: Chart on Asia - Market size and forecast 2022-2027 ($ billion)
Exhibit 90: Data Table on Asia - Market size and forecast 2022-2027 ($ billion)
Exhibit 91: Chart on Asia - Year-over-year growth 2022-2027 (%)
Exhibit 92: Data Table on Asia - Year-over-year growth 2022-2027 (%)
9.6 Rest of World (ROW) - Market size and forecast 2022-2027
Exhibit 93: Chart on Rest of World (ROW) - Market size and forecast 2022-2027 ($ billion)
Exhibit 94: Data Table on Rest of World (ROW) - Market size and forecast 2022-2027 ($ billion)
Exhibit 95: Chart on Rest of World (ROW) - Year-over-year growth 2022-2027 (%)
Exhibit 96: Data Table on Rest of World (ROW) - Year-over-year growth 2022-2027 (%)
9.7 US - Market size and forecast 2022-2027
Exhibit 97: Chart on US - Market size and forecast 2022-2027 ($ billion)
Exhibit 98: Data Table on US - Market size and forecast 2022-2027 ($ billion)
Exhibit 99: Chart on US - Year-over-year growth 2022-2027 (%)
Exhibit 100: Data Table on US - Year-over-year growth 2022-2027 (%)
9.8 Germany - Market size and forecast 2022-2027
Exhibit 101: Chart on Germany - Market size and forecast 2022-2027 ($ billion)
Exhibit 102: Data Table on Germany - Market size and forecast 2022-2027 ($ billion)
Exhibit 103: Chart on Germany - Year-over-year growth 2022-2027 (%)
Exhibit 104: Data Table on Germany - Year-over-year growth 2022-2027 (%)
9.9 China - Market size and forecast 2022-2027
Exhibit 105: Chart on China - Market size and forecast 2022-2027 ($ billion)
Exhibit 106: Data Table on China - Market size and forecast 2022-2027 ($ billion)
Exhibit 107: Chart on China - Year-over-year growth 2022-2027 (%)
Exhibit 108: Data Table on China - Year-over-year growth 2022-2027 (%)
9.10 UK - Market size and forecast 2022-2027
Exhibit 109: Chart on UK - Market size and forecast 2022-2027 ($ billion)
Exhibit 110: Data Table on UK - Market size and forecast 2022-2027 ($ billion)
Exhibit 111: Chart on UK - Year-over-year growth 2022-2027 (%)
Exhibit 112: Data Table on UK - Year-over-year growth 2022-2027 (%)
9.11 India - Market size and forecast 2022-2027
Exhibit 113: Chart on India - Market size and forecast 2022-2027 ($ billion)
Exhibit 114: Data Table on India - Market size and forecast 2022-2027 ($ billion)
Exhibit 115: Chart on India - Year-over-year growth 2022-2027 (%)
Exhibit 116: Data Table on India - Year-over-year growth 2022-2027 (%)
9.12 Market opportunity by geography
Exhibit 117: Market opportunity by geography ($ billion)
10 Drivers, Challenges, and Trends
10.1 Market drivers
10.2 Market challenges
10.3 Impact of drivers and challenges
Exhibit 118: Impact of drivers and challenges in 2022 and 2027
10.4 Market trends
11 Vendor Landscape
11.1 Overview
11.2 Vendor landscape
Exhibit 119: Overview on Criticality of inputs and Factors of differentiation
11.3 Landscape disruption
Exhibit 120: Overview on factors of disruption
11.4 Industry risks
Exhibit 121: Impact of key risks on business
12 Vendor Analysis
12.1 Vendors covered
Exhibit 122: Vendors covered
12.2 Market positioning of vendors
Exhibit 123: Matrix on vendor position and classification
Exhibit 124: Aspen Healthcare Ltd. - Overview
Exhibit 125: Aspen Healthcare Ltd. - Product / Service
Exhibit 126: Aspen Healthcare Ltd. - Key offerings
12.4 DaVita Inc.
Exhibit 127: DaVita Inc. - Overview
Exhibit 128: DaVita Inc. - Business segments
Exhibit 129: DaVita Inc. - Key offerings
Exhibit 130: DaVita Inc. - Segment focus
12.5 EBOS Group Ltd.
Exhibit 131: EBOS Group Ltd. - Overview
Exhibit 132: EBOS Group Ltd. - Business segments
Exhibit 133: EBOS Group Ltd. - Key offerings
Exhibit 134: EBOS Group Ltd. - Segment focus
12.6 Envision Healthcare
Exhibit 135: Envision Healthcare - Overview
Exhibit 136: Envision Healthcare - Product / Service
Exhibit 137: Envision Healthcare - Key news
Exhibit 138: Envision Healthcare - Key offerings
12.7 Fresenius SE and Co. KGaA
Exhibit 139: Fresenius SE and Co. KGaA - Overview
Exhibit 140: Fresenius SE and Co. KGaA - Business segments
Exhibit 141: Fresenius SE and Co. KGaA - Key news
Exhibit 142: Fresenius SE and Co. KGaA - Key offerings
Exhibit 143: Fresenius SE and Co. KGaA - Segment focus
12.8 HCA Healthcare Inc.
Exhibit 144: HCA Healthcare Inc. - Overview
Exhibit 145: HCA Healthcare Inc. - Product / Service
Exhibit 146: HCA Healthcare Inc. - Key offerings
Exhibit 147: Medical Facilities Corp. - Overview
Exhibit 148: Medical Facilities Corp. - Product / Service
Exhibit 149: Medical Facilities Corp. - Key offerings
12.10 Sonic Healthcare Ltd.
Exhibit 150: Sonic Healthcare Ltd. - Overview
Exhibit 151: Sonic Healthcare Ltd. - Business segments
Exhibit 152: Sonic Healthcare Ltd. - Key offerings
Exhibit 153: Sonic Healthcare Ltd. - Segment focus
12.11 Suomen Terveystalo Oy
Exhibit 154: Suomen Terveystalo Oy - Overview
Exhibit 155: Suomen Terveystalo Oy - Business segments
Exhibit 156: Suomen Terveystalo Oy - Key offerings
Exhibit 157: Suomen Terveystalo Oy - Segment focus
12.12 Surgery Partners Inc.
Exhibit 158: Surgery Partners Inc. - Overview
Exhibit 159: Surgery Partners Inc. - Business segments
Exhibit 160: Surgery Partners Inc. - Key offerings
Exhibit 161: Surgery Partners Inc. - Segment focus
13 Appendix
13.1 Scope of the report
13.2 Inclusions and exclusions checklist
Exhibit 162: Inclusions checklist
Exhibit 163: Exclusions checklist
13.3 Currency conversion rates for US$
Exhibit 164: Currency conversion rates for US$
13.4 Research methodology
Exhibit 165: Research methodology
Exhibit 166: Validation techniques employed for market sizing
Exhibit 167: Information sources
13.5 List of abbreviations
Exhibit 168: List of abbreviations
About Us
Technavio is a leading global technology research and advisory company. Their research and analysis focuses on emerging market trends and provides actionable insights to help businesses identify market opportunities and develop effective strategies to optimize their market positions. With over 500 specialized analysts, Technavio's report library consists of more than 17,000 reports and counting, covering 800 technologies, spanning across 50 countries. Their client base consists of enterprises of all sizes, including more than 100 Fortune 500 companies. This growing client base relies on Technavio's comprehensive coverage, extensive research, and actionable market insights to identify opportunities in existing and potential markets and assess their competitive positions within changing market scenarios.
Contact
Technavio Research
Jesse Maida
US: +1 844 364 1100
UK: +44 203 893 3200
Email: [email protected]
Website: www.technavio.com/
SOURCE Technavio
For more details,please visit the original website
The content of the article does not represent any opinions of Synapse and its affiliated companies. If there is any copyright infringement or error, please contact us, and we will deal with it within 24 hours.
Organizations
Indications
Targets
-Drugs
-Hot reports


Get started for free today!
Accelerate Strategic R&D decision making with Synapse, PatSnap’s AI-powered Connected Innovation Intelligence Platform Built for Life Sciences Professionals.
Start your data trial now!
Synapse data is also accessible to external entities via APIs or data packages. Leverages most recent intelligence information, enabling fullest potential.