USD 9.82 Bn growth expected in Companion Animal Healthcare Market -- North America to account for the largest share
12 Sep 2022
NEW YORK, Sept. 12, 2022 /PRNewswire/ -- The "
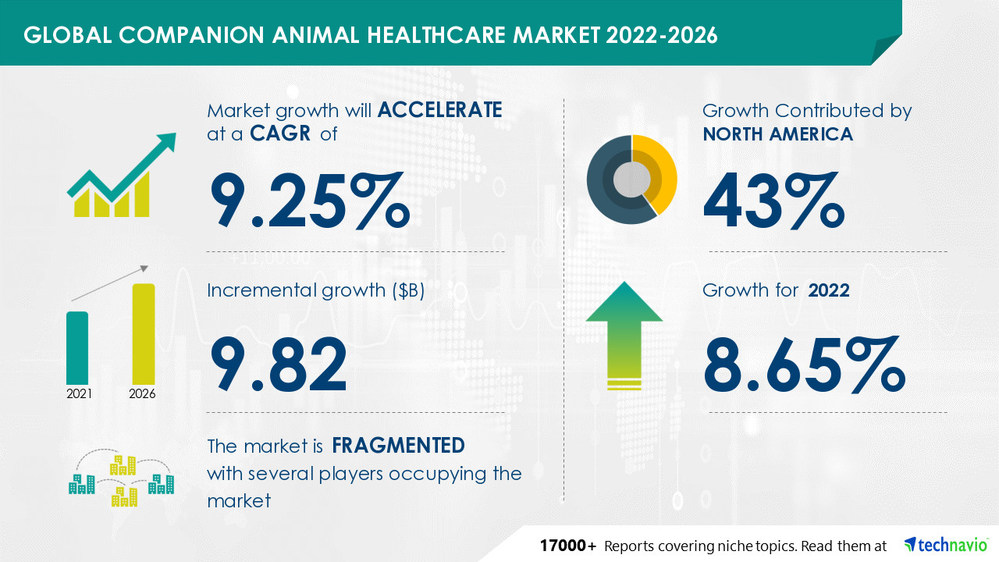
Companion Animal Healthcare Market by Product and Geography - Forecast and Analysis 2022-2026" report has been added to Technavio's offering. The report expects the market size to grow by USD 9.82 billion between 2021 and 2026, expanding at a CAGR of 9.25% during the forecast period. The report considers various aspects such as the consumer base, adoption rate, average selling price, revenue generated by vendors, and various other factors to estimate the market size.
Download Sample PDF Report
Preview
Source: PRNewswire
Technavio has announced its latest market research report titled Companion Animal Healthcare Market by Product and Geography - Forecast and Analysis 2022-2026
The global companion animal healthcare market is fragmented. The main competitive factors among vendors are new technologies and new product offerings. Vendors are adopting various strategies to increase their market shares and remain competitive in the market. Some of the major strategies adopted by them are M&A, distribution through partnerships, participation in medical trade shows, and product development through the use of advanced technologies. In addition, Companies are compelled to maintain a competitive advantage while also providing economic value to customers and addressing unmet requirements. For instance, in April 2020, to expand its offering of pet care diagnostics, US-based Heska corporation acquired CVM Diagnostico Veterinario, S.L., and CVM Ecografa, S.L. in Spain to strengthen its animal healthcare diagnostics business in Spain, fostering further the growth of the global companion healthcare market during the forecast period.
The vendors included in the global companion animal healthcare market are Merck and Co. Inc., Ceva Sante Animale, Zoetis Inc., C. H. Boehringer Sohn AG and Co. KG, Virbac Group, IDEXX Laboratories Inc., Indian Immunologicals Ltd., Bayer AG, Heska Corp., Dechra Pharmaceuticals Plc, Vetoquinol SA, Elanco Animal Health Inc., Agrolabo Spa, Chanelle Pharma Group, Kyoritsuseiyaku Corp., LABORATORIOS HIPRA SA, Norbrook Laboratories Ltd., Inovet, Endovac Animal Health, and Eco Animal Health Group Plc.
Factors such as rising pet ownership, marketing campaigns and packaging innovations, and the growing prevalence of zoonotic diseases will offer immense growth opportunities. To leverage the current opportunities, market vendors must strengthen their foothold in the fast-growing segments, while maintaining their positions in the slow-growing segments. The companion animal healthcare market is fragmented, and the degree of fragmentation will accelerate during the forecast period.
Request Sample Report Here
Companion Animal Healthcare Market 2022-2026: Segmentation
The market is segmented as follows:
Product
Pharmaceuticals
Diagnostics
The pharmaceuticals segment accounted for the largest share of the market in 2021. The rise in pet ownership, rising zoonotic disease incidence, and the rising demand for pet insurance are driving the growth of the segment.
Geography
North America
Europe
Asia
Rest Of World (ROW)
North America is the major market, occupying 43% of the global market share. The growth of the regional market can be attributed to various factors such as the presence of a well-established base of animal health industries, the high adoption of companion animals, the rising incidence of parasitic infections, the growing pool of veterinarians, and the growing expenditure on animal health.
The report also covers the following areas:
Companion Animal Healthcare Market Size
Companion Animal Healthcare Market Trends
Companion Animal Healthcare Market Industry Analysis
Companion Animal Healthcare Market 2022-2026: Key Highlights
CAGR of the market during the forecast period 2022-2026
Detailed information on factors that will assist companion animal healthcare market growth during the next five years
Estimation of the companion animal healthcare market size and its contribution to the parent market
Predictions on upcoming trends and changes in consumer behavior
The growth of the companion animal healthcare market
Analysis of the market's competitive landscape and detailed information on vendors
Comprehensive details of factors that will challenge the growth of companion animal healthcare market vendors
Related Reports:
Veterinary Scales Market by End-user and Geography - Forecast and Analysis
2022-2026
Veterinary Chemistry Analyzers Market by Product and Geography - Forecast and
Analysis 2022-2026
Table of Contents:
1 Executive Summary
1.1 Market overview
Exhibit 01: Executive Summary – Chart on Market Overview
Exhibit 02: Executive Summary – Data Table on Market Overview
Exhibit 03: Executive Summary – Chart on Global Market Characteristics
Exhibit 04: Executive Summary – Chart on Market by Geography
Exhibit 05: Executive Summary – Chart on Market Segmentation by Product
Exhibit 06: Executive Summary – Chart on Incremental Growth
Exhibit 07: Executive Summary – Data Table on Incremental Growth
Exhibit 08: Executive Summary – Chart on Vendor Market Positioning
2 Market Landscape
2.1 Market ecosystem
Exhibit 09: Parent market
Exhibit 10: Market Characteristics
3 Market Sizing
3.1 Market definition
Exhibit 11: Offerings of vendors included in the market definition
3.2 Market segment analysis
Exhibit 12: Market segments
3.3 Market size 2021
3.4 Market outlook: Forecast for 2021-2026
Exhibit 13: Chart on Global - Market size and forecast 2021-2026 ($ million)
Exhibit 14: Data Table on Global - Market size and forecast 2021-2026 ($ million)
Exhibit 15: Chart on Global Market: Year-over-year growth 2021-2026 (%)
Exhibit 16: Data Table on Global Market: Year-over-year growth 2021-2026 (%)
4 Five Forces Analysis
4.1 Five forces summary
Exhibit 17: Five forces analysis - Comparison between 2021 and 2026
4.2 Bargaining power of buyers
Exhibit 18: Chart on Bargaining power of buyers – Impact of key factors 2021 and 2026
4.3 Bargaining power of suppliers
Exhibit 19: Bargaining power of suppliers – Impact of key factors in 2021 and 2026
4.4 Threat of new entrants
Exhibit 20: Threat of new entrants – Impact of key factors in 2021 and 2026
4.5 Threat of substitutes
Exhibit 21: Threat of substitutes – Impact of key factors in 2021 and 2026
4.6 Threat of rivalry
Exhibit 22: Threat of rivalry – Impact of key factors in 2021 and 2026
4.7 Market condition
Exhibit 23: Chart on Market condition - Five forces 2021 and 2026
5 Market Segmentation by Product
5.1 Market segments
Exhibit 24: Chart on Product - Market share 2021-2026 (%)
Exhibit 25: Data Table on Product - Market share 2021-2026 (%)
5.2 Comparison by Product
Exhibit 26: Chart on Comparison by Product
Exhibit 27: Data Table on Comparison by Product
5.3 Pharmaceuticals - Market size and forecast 2021-2026
Exhibit 28: Chart on Pharmaceuticals - Market size and forecast 2021-2026 ($ million)
Exhibit 29: Data Table on Pharmaceuticals - Market size and forecast 2021-2026 ($ million)
Exhibit 30: Chart on Pharmaceuticals - Year-over-year growth 2021-2026 (%)
Exhibit 31: Data Table on Pharmaceuticals - Year-over-year growth 2021-2026 (%)
5.4 Diagnostics - Market size and forecast 2021-2026
Exhibit 32: Chart on Diagnostics - Market size and forecast 2021-2026 ($ million)
Exhibit 33: Data Table on Diagnostics - Market size and forecast 2021-2026 ($ million)
Exhibit 34: Chart on Diagnostics - Year-over-year growth 2021-2026 (%)
Exhibit 35: Data Table on Diagnostics - Year-over-year growth 2021-2026 (%)
5.5 Market opportunity by Product
Exhibit 36: Market opportunity by Product ($ million)
6 Customer Landscape
6.1 Customer landscape overview
Exhibit 37: Analysis of price sensitivity, lifecycle, customer purchase basket, adoption rates, and purchase criteria
7 Geographic Landscape
7.1 Geographic segmentation
Exhibit 38: Chart on Market share by geography 2021-2026 (%)
Exhibit 39: Data Table on Market share by geography 2021-2026 (%)
7.2 Geographic comparison
Exhibit 40: Chart on Geographic comparison
Exhibit 41: Data Table on Geographic comparison
7.3 North America - Market size and forecast 2021-2026
Exhibit 42: Chart on North America - Market size and forecast 2021-2026 ($ million)
Exhibit 43: Data Table on North America - Market size and forecast 2021-2026 ($ million)
Exhibit 44: Chart on North America - Year-over-year growth 2021-2026 (%)
Exhibit 45: Data Table on North America - Year-over-year growth 2021-2026 (%)
7.4 Europe - Market size and forecast 2021-2026
Exhibit 46: Chart on Europe - Market size and forecast 2021-2026 ($ million)
Exhibit 47: Data Table on Europe - Market size and forecast 2021-2026 ($ million)
Exhibit 48: Chart on Europe - Year-over-year growth 2021-2026 (%)
Exhibit 49: Data Table on Europe - Year-over-year growth 2021-2026 (%)
7.5 Asia - Market size and forecast 2021-2026
Exhibit 50: Chart on Asia - Market size and forecast 2021-2026 ($ million)
Exhibit 51: Data Table on Asia - Market size and forecast 2021-2026 ($ million)
Exhibit 52: Chart on Asia - Year-over-year growth 2021-2026 (%)
Exhibit 53: Data Table on Asia - Year-over-year growth 2021-2026 (%)
7.6 Rest of World (ROW) - Market size and forecast 2021-2026
Exhibit 54: Chart on Rest of World (ROW) - Market size and forecast 2021-2026 ($ million)
Exhibit 55: Data Table on Rest of World (ROW) - Market size and forecast 2021-2026 ($ million)
Exhibit 56: Chart on Rest of World (ROW) - Year-over-year growth 2021-2026 (%)
Exhibit 57: Data Table on Rest of World (ROW) - Year-over-year growth 2021-2026 (%)
7.7 US - Market size and forecast 2021-2026
Exhibit 58: Chart on US - Market size and forecast 2021-2026 ($ million)
Exhibit 59: Data Table on US - Market size and forecast 2021-2026 ($ million)
Exhibit 60: Chart on US - Year-over-year growth 2021-2026 (%)
Exhibit 61: Data Table on US - Year-over-year growth 2021-2026 (%)
7.8 Germany - Market size and forecast 2021-2026
Exhibit 62: Chart on Germany - Market size and forecast 2021-2026 ($ million)
Exhibit 63: Data Table on Germany - Market size and forecast 2021-2026 ($ million)
Exhibit 64: Chart on Germany - Year-over-year growth 2021-2026 (%)
Exhibit 65: Data Table on Germany - Year-over-year growth 2021-2026 (%)
7.9 UK - Market size and forecast 2021-2026
Exhibit 66: Chart on UK - Market size and forecast 2021-2026 ($ million)
Exhibit 67: Data Table on UK - Market size and forecast 2021-2026 ($ million)
Exhibit 68: Chart on UK - Year-over-year growth 2021-2026 (%)
Exhibit 69: Data Table on UK - Year-over-year growth 2021-2026 (%)
7.10 Canada - Market size and forecast 2021-2026
Exhibit 70: Chart on Canada - Market size and forecast 2021-2026 ($ million)
Exhibit 71: Data Table on Canada - Market size and forecast 2021-2026 ($ million)
Exhibit 72: Chart on Canada - Year-over-year growth 2021-2026 (%)
Exhibit 73: Data Table on Canada - Year-over-year growth 2021-2026 (%)
7.11 China - Market size and forecast 2021-2026
Exhibit 74: Chart on China - Market size and forecast 2021-2026 ($ million)
Exhibit 75: Data Table on China - Market size and forecast 2021-2026 ($ million)
Exhibit 76: Chart on China - Year-over-year growth 2021-2026 (%)
Exhibit 77: Data Table on China - Year-over-year growth 2021-2026 (%)
7.12 Market opportunity by geography
Exhibit 78: Market opportunity by geography ($ million)
8 Drivers, Challenges, and Trends
8.1 Market drivers
8.2 Market challenges
8.3 Impact of drivers and challenges
Exhibit 79: Impact of drivers and challenges in 2021 and 2026
8.4 Market trends
9 Vendor Landscape
9.1 Overview
9.2 Vendor landscape
Exhibit 80: Overview on Criticality of inputs and Factors of differentiation
9.3 Landscape disruption
Exhibit 81: Overview on factors of disruption
9.4 Industry risks
Exhibit 82: Impact of key risks on business
10 Vendor Analysis
10.1 Vendors covered
Exhibit 83: Vendors covered
10.2 Market positioning of vendors
Exhibit 84: Matrix on vendor position and classification
10.3 Bayer AG
Exhibit 85: Bayer AG - Overview
Exhibit 86: Bayer AG - Business segments
Exhibit 87: Bayer AG - Key offerings
Exhibit 88: Bayer AG - Segment focus
10.4 C. H. Boehringer Sohn AG and Co. KG
Exhibit 89: C. H. Boehringer Sohn AG and Co. KG - Overview
Exhibit 90: C. H. Boehringer Sohn AG and Co. KG - Business segments
Exhibit 91: C. H. Boehringer Sohn AG and Co. KG - Key news
Exhibit 92: C. H. Boehringer Sohn AG and Co. KG - Key offerings
Exhibit 93: C. H. Boehringer Sohn AG and Co. KG - Segment focus
10.5 Ceva Sante Animale
Exhibit 94: Ceva Sante Animale - Overview
Exhibit 95: Ceva Sante Animale - Product / Service
Exhibit 96: Ceva Sante Animale - Key offerings
Exhibit 97: Dechra Pharmaceuticals Plc - Overview
Exhibit 98: Dechra Pharmaceuticals Plc - Business segments
Exhibit 99: Dechra Pharmaceuticals Plc - Key offerings
Exhibit 100: Dechra Pharmaceuticals Plc - Segment focus
Exhibit 101: Heska Corp. - Overview
Exhibit 102: Heska Corp. - Business segments
Exhibit 103: Heska Corp. - Key news
Exhibit 104: Heska Corp. - Key offerings
Exhibit 105: Heska Corp. - Segment focus
Exhibit 106: IDEXX Laboratories Inc. - Overview
Exhibit 107: IDEXX Laboratories Inc. - Business segments
Exhibit 108: IDEXX Laboratories Inc. - Key news
Exhibit 109: IDEXX Laboratories Inc. - Key offerings
Exhibit 110: IDEXX Laboratories Inc. - Segment focus
Exhibit 111: Indian Immunologicals Ltd. - Overview
Exhibit 112: Indian Immunologicals Ltd. - Product / Service
Exhibit 113: Indian Immunologicals Ltd. - Key offerings
10.10 Merck and Co. Inc.
Exhibit 114: Merck and Co. Inc. - Overview
Exhibit 115: Merck and Co. Inc. - Business segments
Exhibit 116: Merck and Co. Inc. - Key news
Exhibit 117: Merck and Co. Inc. - Key offerings
Exhibit 118: Merck and Co. Inc. - Segment focus
10.11 Virbac Group
Exhibit 119: Virbac Group - Overview
Exhibit 120: Virbac Group - Business segments
Exhibit 121: Virbac Group - Key news
Exhibit 122: Virbac Group - Key offerings
Exhibit 123: Virbac Group - Segment focus
10.12 Zoetis Inc.
Exhibit 124: Zoetis Inc. - Overview
Exhibit 125: Zoetis Inc. - Business segments
Exhibit 126: Zoetis Inc. - Key news
Exhibit 127: Zoetis Inc. - Key offerings
Exhibit 128: Zoetis Inc. - Segment focus
11.1 Scope of the report
11.2 Inclusions and exclusions checklist
Exhibit 129: Inclusions checklist
Exhibit 130: Exclusions checklist
11.3 Currency conversion rates for US$
Exhibit 131: Currency conversion rates for US$
11.4 Research methodology
Exhibit 132: Research methodology
Exhibit 133: Validation techniques employed for market sizing
Exhibit 134: Information sources
11.5 List of abbreviations
Exhibit 135: List of abbreviations
About Us
Technavio is a leading global technology research and advisory company. Their research and analysis focus on emerging market trends and provides actionable insights to help businesses identify market opportunities and develop effective strategies to optimize their market positions. With over 500 specialized analysts, Technavio's report library consists of more than 17,000 reports and counting, covering 800 technologies, spanning across 50 countries. Their client base consists of enterprises of all sizes, including more than 100 Fortune 500 companies. This growing client base relies on Technavio's comprehensive coverage, extensive research, and actionable market insights to identify opportunities in existing and potential markets and assess their competitive positions within changing market scenarios.
Contact
Technavio Research
Jesse Maida
US: +1 844 364 1100
UK: +44 203 893 3200
Email: [email protected]
Website: www.technavio.com/
SOURCE Technavio
For more details,please visit the original website
The content of the article does not represent any opinions of Synapse and its affiliated companies. If there is any copyright infringement or error, please contact us, and we will deal with it within 24 hours.
Organizations
Indications
Targets
-Drugs
-Hot reports


Get started for free today!
Accelerate Strategic R&D decision making with Synapse, PatSnap’s AI-powered Connected Innovation Intelligence Platform Built for Life Sciences Professionals.
Start your data trial now!
Synapse data is also accessible to external entities via APIs or data packages. Leverages most recent intelligence information, enabling fullest potential.