Single-use Bioprocessing System Market - 37% of growth to Originate from North America| Driven by Increasing Use of Single-use Technologies to Minimize the Risk of Contamination |Technavio
07 Jun 2022
Vaccine
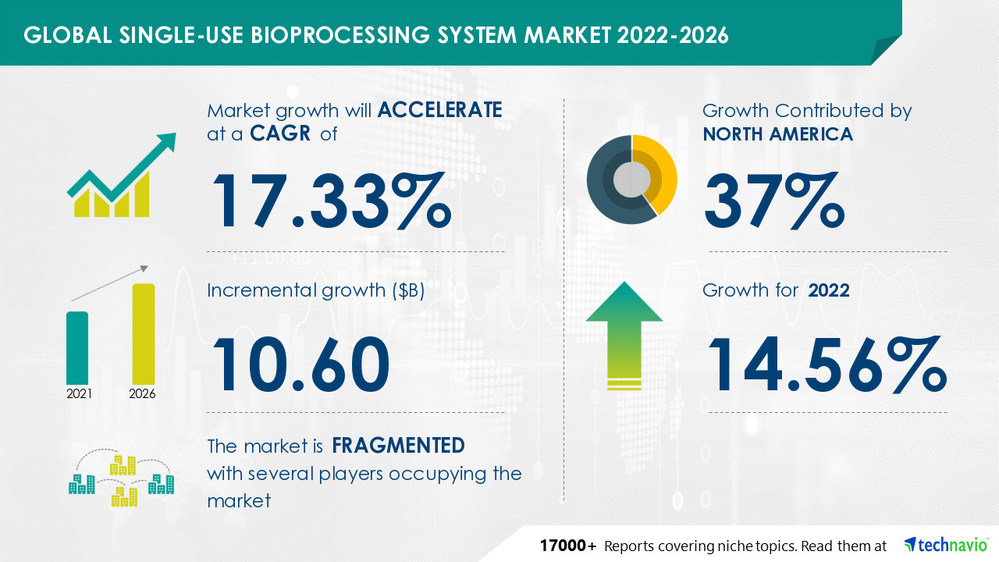
NEW YORK, June 7, 2022 /PRNewswire/ -- The "Single-use Bioprocessing System Market by Application, End-user, Product and Geography, Forecast and Analysis 2022-2026" report has been added to Technavio's offering. With ISO 9001:2015 certification, Technavio is proudly partnering with more than 100 Fortune 500 companies for over 16 years. 37% of the market's growth will originate from
North America during the forecast period.
Preview
Source: PRNewswire
Technavio has announced its latest market research report titled Single-use Bioprocessing System Market by Product, Application, End-user, and Geography - Forecast and Analysis 2022-2026
The US is the key market for single-use bioprocessing systems in North America. The significant increase in the adoption of SUB systems among pharmaceutical companies to achieve lower costs and higher productivity, as well as strategic enhancements in the therapeutic approval process and the presence of key players will facilitate the single-use bioprocessing system market growth in North America over the forecast period.
The potential growth difference for the single-use bioprocessing system market between 2021 and 2026 is
USD 10.60 billion. To get the exact yearly growth variance and the Y-O-Y growth rate,
Talk to our analyst
.
Key Market Dynamics:
Market Driver - The key factor driving the global single-use bioprocessing system industry growth is the
increasing use of single-use technologies to minimize the risk of contamination. Contamination among batches reduces the production yield and increases the cost and time-to-market by making it necessary to undertake additional steps for purification. In addition, the detection of impurities in the post commercial stages by regulatory bodies can make end-users liable for product recalls and legal actions.
Market Challenge - The key challenges to the global SUB system industry growth are the
issues related to extractables and leachable in polymeric systems. Leachables can have a toxic effect on patients who consume these drugs and can also have an adverse impact on the properties of drugs, thereby reducing their efficacy. Due to contamination concerns, the US FDA has mandated that pharmaceutical companies must demonstrate the safety of the materials used in container production systems, closure systems, and drug delivery devices.
To learn about additional key drivers, trends, and challenges -
Download our Sample Report right now!
Segmentation Analysis:
The single-use bioprocessing system market report is segmented by
Application (mAb production, Vaccine production, Plant cell cultivation, PSCTs, and Others),
End-user (Pharmaceutical companies, CROs and CMOs, Biotechnology companies, and Academic and research institutions),
Product (Bags and mixers, Bioreactors and fermenters, Filtration devices and sampling systems, Bioprocess containers, and Others), and
Geography (North America, Europe, Asia, and Rest of World (ROW)).
The single-use bioprocessing system market share growth in the application segment by the
mAb production will be significant for revenue generation. SUB systems eradicate the chances of cross-contamination and reduce the time involved in the preparation of new equipment between mAb production batches.
Download our sample report
for additional insights into the contribution of all the segments
Some Companies Mentioned
The single-use bioprocessing system market is
fragmented and the vendors are deploying growth strategies such as investment in R and D and strategic partnerships to compete in the market.
Adolf Kuhner AG
Advanced Microdevices Pvt. Ltd.
Celltainer
Merck KGaA
SENTINEL PROCESS SYSTEMS INC.
To gain access to more vendor profiles with their key offerings available with Technavio,
Related Reports:
Automated Microscopy Market by Type and Geography - Forecast and Analysis 2022-2026
Preclinical Animal Behavior Market by End-user, Application, and Geography - Forecast and Analysis 2022-2026
Table of Contents:
1 Executive Summary
1.1 Market overview
Exhibit 01: Executive Summary – Chart on Market Overview
Exhibit 02: Executive Summary – Data Table on Market Overview
Exhibit 03: Executive Summary – Chart on Global Market Characteristics
Exhibit 04: Executive Summary – Chart on Market by Geography
Exhibit 05: Executive Summary – Chart on Market Segmentation by Application
Exhibit 06: Executive Summary – Chart on Market Segmentation by End-user
Exhibit 07: Executive Summary – Chart on Market Segmentation by Product
Exhibit 08: Executive Summary – Chart on Incremental Growth
Exhibit 09: Executive Summary – Data Table on Incremental Growth
Exhibit 10: Executive Summary – Chart on Vendor Market Positioning
2 Market Landscape
2.1 Market ecosystem
Exhibit 11: Parent market
Exhibit 12: Market Characteristics
3 Market Sizing
3.1 Market definition
Exhibit 13: Offerings of vendors included in the market definition
3.2 Market segment analysis
Exhibit 14: Market segments
3.3 Market size 2021
3.4 Market outlook: Forecast for 2021-2026
Exhibit 15: Chart on Global - Market size and forecast 2021-2026 ($ million)
Exhibit 16: Data Table on Global - Market size and forecast 2021-2026 ($ million)
Exhibit 17: Chart on Global Market: Year-over-year growth 2021-2026 (%)
Exhibit 18: Data Table on Global Market: Year-over-year growth 2021-2026 (%)
4 Five Forces Analysis
4.1 Five forces summary
Exhibit 19: Five forces analysis - Comparison between2021 and 2026
4.2 Bargaining power of buyers
Exhibit 20: Chart on Bargaining power of buyers – Impact of key factors 2021 and 2026
4.3 Bargaining power of suppliers
Exhibit 21: Bargaining power of suppliers – Impact of key factors in 2021 and 2026
4.4 Threat of new entrants
Exhibit 22: Threat of new entrants – Impact of key factors in 2021 and 2026
4.5 Threat of substitutes
Exhibit 23: Threat of substitutes – Impact of key factors in 2021 and 2026
4.6 Threat of rivalry
Exhibit 24: Threat of rivalry – Impact of key factors in 2021 and 2026
4.7 Market condition
Exhibit 25: Chart on Market condition - Five forces 2021 and 2026
5 Market Segmentation by Application
5.1 Market segments
Exhibit 26: Chart on Application - Market share 2021-2026 (%)
Exhibit 27: Data Table on Application - Market share 2021-2026 (%)
5.2 Comparison by Application
Exhibit 28: Chart on Comparison by Application
Exhibit 29: Data Table on Comparison by Application
5.3 mAb production - Market size and forecast 2021-2026
Exhibit 30: Chart on mAb production - Market size and forecast 2021-2026 ($ million)
Exhibit 31: Data Table on mAb production - Market size and forecast 2021-2026 ($ million)
Exhibit 32: Chart on mAb production - Year-over-year growth 2021-2026 (%)
Exhibit 33: Data Table on mAb production - Year-over-year growth 2021-2026 (%)
5.4 Vaccine production - Market size and forecast 2021-2026
Exhibit 34: Chart on Vaccine production - Market size and forecast 2021-2026 ($ million)
Exhibit 35: Data Table on Vaccine production - Market size and forecast 2021-2026 ($ million)
Exhibit 36: Chart on Vaccine production - Year-over-year growth 2021-2026 (%)
Exhibit 37: Data Table on Vaccine production - Year-over-year growth 2021-2026 (%)
5.5 Plant cell cultivation - Market size and forecast 2021-2026
Exhibit 38: Chart on Plant cell cultivation - Market size and forecast 2021-2026 ($ million)
Exhibit 39: Data Table on Plant cell cultivation - Market size and forecast 2021-2026 ($ million)
Exhibit 40: Chart on Plant cell cultivation - Year-over-year growth 2021-2026 (%)
Exhibit 41: Data Table on Plant cell cultivation - Year-over-year growth 2021-2026 (%)
5.6 PSCTs - Market size and forecast 2021-2026
Exhibit 42: Chart on PSCTs - Market size and forecast 2021-2026 ($ million)
Exhibit 43: Data Table on PSCTs - Market size and forecast 2021-2026 ($ million)
Exhibit 44: Chart on PSCTs - Year-over-year growth 2021-2026 (%)
Exhibit 45: Data Table on PSCTs - Year-over-year growth 2021-2026 (%)
5.7 Others - Market size and forecast 2021-2026
Exhibit 46: Chart on Others - Market size and forecast 2021-2026 ($ million)
Exhibit 47: Data Table on Others - Market size and forecast 2021-2026 ($ million)
Exhibit 48: Chart on Others - Year-over-year growth 2021-2026 (%)
Exhibit 49: Data Table on Others - Year-over-year growth 2021-2026 (%)
5.8 Market opportunity by Application
Exhibit 50: Market opportunity by Application ($ million)
6 Market Segmentation by End-user
6.1 Market segments
Exhibit 51: Chart on End-user - Market share 2021-2026 (%)
Exhibit 52: Data Table on End-user - Market share 2021-2026 (%)
6.2 Comparison by End-user
Exhibit 53: Chart on Comparison by End-user
Exhibit 54: Data Table on Comparison by End-user
6.3 Pharmaceutical companies - Market size and forecast 2021-2026
Exhibit 55: Chart on Pharmaceutical companies - Market size and forecast 2021-2026 ($ million)
Exhibit 56: Data Table on Pharmaceutical companies - Market size and forecast 2021-2026 ($ million)
Exhibit 57: Chart on Pharmaceutical companies - Year-over-year growth 2021-2026 (%)
Exhibit 58: Data Table on Pharmaceutical companies - Year-over-year growth 2021-2026 (%)
6.4 CROs and CMOs - Market size and forecast 2021-2026
Exhibit 59: Chart on CROs and CMOs - Market size and forecast 2021-2026 ($ million)
Exhibit 60: Data Table on CROs and CMOs - Market size and forecast 2021-2026 ($ million)
Exhibit 61: Chart on CROs and CMOs - Year-over-year growth 2021-2026 (%)
Exhibit 62: Data Table on CROs and CMOs - Year-over-year growth 2021-2026 (%)
6.5 Biotechnology companies - Market size and forecast 2021-2026
Exhibit 63: Chart on Biotechnology companies - Market size and forecast 2021-2026 ($ million)
Exhibit 64: Data Table on Biotechnology companies - Market size and forecast 2021-2026 ($ million)
Exhibit 65: Chart on Biotechnology companies - Year-over-year growth 2021-2026 (%)
Exhibit 66: Data Table on Biotechnology companies - Year-over-year growth 2021-2026 (%)
6.6 Academic and research institutions - Market size and forecast 2021-2026
Exhibit 67: Chart on Academic and research institutions - Market size and forecast 2021-2026 ($ million)
Exhibit 68: Data Table on Academic and research institutions - Market size and forecast 2021-2026 ($ million)
Exhibit 69: Chart on Academic and research institutions - Year-over-year growth 2021-2026 (%)
Exhibit 70: Data Table on Academic and research institutions - Year-over-year growth 2021-2026 (%)
6.7 Market opportunity by End-user
Exhibit 71: Market opportunity by End-user ($ million)
7 Market Segmentation by Product
7.1 Market segments
Exhibit 72: Chart on Product - Market share 2021-2026 (%)
Exhibit 73: Data Table on Product - Market share 2021-2026 (%)
7.2 Comparison by Product
Exhibit 74: Chart on Comparison by Product
Exhibit 75: Data Table on Comparison by Product
7.3 Bags and mixers - Market size and forecast 2021-2026
Exhibit 76: Chart on Bags and mixers - Market size and forecast 2021-2026 ($ million)
Exhibit 77: Data Table on Bags and mixers - Market size and forecast 2021-2026 ($ million)
Exhibit 78: Chart on Bags and mixers - Year-over-year growth 2021-2026 (%)
Exhibit 79: Data Table on Bags and mixers - Year-over-year growth 2021-2026 (%)
7.4 Bioreactors and fermenters - Market size and forecast 2021-2026
Exhibit 80: Chart on Bioreactors and fermenters - Market size and forecast 2021-2026 ($ million)
Exhibit 81: Data Table on Bioreactors and fermenters - Market size and forecast 2021-2026 ($ million)
Exhibit 82: Chart on Bioreactors and fermenters - Year-over-year growth 2021-2026 (%)
Exhibit 83: Data Table on Bioreactors and fermenters - Year-over-year growth 2021-2026 (%)
7.5 Filtration devices and sampling systems - Market size and forecast 2021-2026
Exhibit 84: Chart on Filtration devices and sampling systems - Market size and forecast 2021-2026 ($ million)
Exhibit 85: Data Table on Filtration devices and sampling systems - Market size and forecast 2021-2026 ($ million)
Exhibit 86: Chart on Filtration devices and sampling systems - Year-over-year growth 2021-2026 (%)
Exhibit 87: Data Table on Filtration devices and sampling systems - Year-over-year growth 2021-2026 (%)
7.6 Bioprocess containers - Market size and forecast 2021-2026
Exhibit 88: Chart on Bioprocess containers - Market size and forecast 2021-2026 ($ million)
Exhibit 89: Data Table on Bioprocess containers - Market size and forecast 2021-2026 ($ million)
Exhibit 90: Chart on Bioprocess containers - Year-over-year growth 2021-2026 (%)
Exhibit 91: Data Table on Bioprocess containers - Year-over-year growth 2021-2026 (%)
7.7 Others - Market size and forecast 2021-2026
Exhibit 92: Chart on Others - Market size and forecast 2021-2026 ($ million)
Exhibit 93: Data Table on Others - Market size and forecast 2021-2026 ($ million)
Exhibit 94: Chart on Others - Year-over-year growth 2021-2026 (%)
Exhibit 95: Data Table on Others - Year-over-year growth 2021-2026 (%)
7.8 Market opportunity by Product
Exhibit 96: Market opportunity by Product ($ million)
8 Customer Landscape
8.1 Customer landscape overview
Exhibit 97: Analysis of price sensitivity, lifecycle, customer purchase basket, adoption rates, and purchase criteria
9 Geographic Landscape
9.1 Geographic segmentation
Exhibit 98: Chart on Market share by geography 2021-2026 (%)
Exhibit 99: Data Table on Market share by geography 2021-2026 (%)
9.2 Geographic comparison
Exhibit 100: Chart on Geographic comparison
Exhibit 101: Data Table on Geographic comparison
9.3 North America - Market size and forecast 2021-2026
Exhibit 102: Chart on North America - Market size and forecast 2021-2026 ($ million)
Exhibit 103: Data Table on North America - Market size and forecast 2021-2026 ($ million)
Exhibit 104: Chart on North America - Year-over-year growth 2021-2026 (%)
Exhibit 105: Data Table on North America - Year-over-year growth 2021-2026 (%)
9.4 Europe - Market size and forecast 2021-2026
Exhibit 106: Chart on Europe - Market size and forecast 2021-2026 ($ million)
Exhibit 107: Data Table on Europe - Market size and forecast 2021-2026 ($ million)
Exhibit 108: Chart on Europe - Year-over-year growth 2021-2026 (%)
Exhibit 109: Data Table on Europe - Year-over-year growth 2021-2026 (%)
9.5 Asia - Market size and forecast 2021-2026
Exhibit 110: Chart on Asia - Market size and forecast 2021-2026 ($ million)
Exhibit 111: Data Table on Asia - Market size and forecast 2021-2026 ($ million)
Exhibit 112: Chart on Asia - Year-over-year growth 2021-2026 (%)
Exhibit 113: Data Table on Asia - Year-over-year growth 2021-2026 (%)
9.6 Rest of World (ROW) - Market size and forecast 2021-2026
Exhibit 114: Chart on Rest of World (ROW) - Market size and forecast 2021-2026 ($ million)
Exhibit 115: Data Table on Rest of World (ROW) - Market size and forecast 2021-2026 ($ million)
Exhibit 116: Chart on Rest of World (ROW) - Year-over-year growth 2021-2026 (%)
Exhibit 117: Data Table on Rest of World (ROW) - Year-over-year growth 2021-2026 (%)
9.7 US - Market size and forecast 2021-2026
Exhibit 118: Chart on US - Market size and forecast 2021-2026 ($ million)
Exhibit 119: Data Table on US - Market size and forecast 2021-2026 ($ million)
Exhibit 120: Chart on US - Year-over-year growth 2021-2026 (%)
Exhibit 121: Data Table on US - Year-over-year growth 2021-2026 (%)
9.8 Germany - Market size and forecast 2021-2026
Exhibit 122: Chart on Germany - Market size and forecast 2021-2026 ($ million)
Exhibit 123: Data Table on Germany - Market size and forecast 2021-2026 ($ million)
Exhibit 124: Chart on Germany - Year-over-year growth 2021-2026 (%)
Exhibit 125: Data Table on Germany - Year-over-year growth 2021-2026 (%)
9.9 China - Market size and forecast 2021-2026
Exhibit 126: Chart on China - Market size and forecast 2021-2026 ($ million)
Exhibit 127: Data Table on China - Market size and forecast 2021-2026 ($ million)
Exhibit 128: Chart on China - Year-over-year growth 2021-2026 (%)
Exhibit 129: Data Table on China - Year-over-year growth 2021-2026 (%)
9.10 France - Market size and forecast 2021-2026
Exhibit 130: Chart on France - Market size and forecast 2021-2026 ($ million)
Exhibit 131: Data Table on France - Market size and forecast 2021-2026 ($ million)
Exhibit 132: Chart on France - Year-over-year growth 2021-2026 (%)
Exhibit 133: Data Table on France - Year-over-year growth 2021-2026 (%)
9.11 Japan - Market size and forecast 2021-2026
Exhibit 134: Chart on Japan - Market size and forecast 2021-2026 ($ million)
Exhibit 135: Data Table on Japan - Market size and forecast 2021-2026 ($ million)
Exhibit 136: Chart on Japan - Year-over-year growth 2021-2026 (%)
Exhibit 137: Data Table on Japan - Year-over-year growth 2021-2026 (%)
9.12 Market opportunity by geography
Exhibit 138: Market opportunity by geography ($ million)
10 Drivers, Challenges, and Trends
10.1 Market drivers
10.2 Market challenges
10.3 Impact of drivers and challenges
Exhibit 139: Impact of drivers and challenges in 2021 and 2026
10.4 Market trends
11 Vendor Landscape
11.1 Overview
11.2 Vendor landscape
Exhibit 140: Overview on Criticality of inputs and Factors of differentiation
11.3 Landscape disruption
Exhibit 141: Overview on factors of disruption
11.4 Industry risks
Exhibit 142: Impact of key risks on business
12 Vendor Analysis
12.1 Vendors covered
Exhibit 143: Vendors covered
12.2 Market positioning of vendors
Exhibit 144: Matrix on vendor position and classification
12.3 3M Corp.
Exhibit 145: 3M Corp. - Overview
Exhibit 146: 3M Corp. - Business segments
Exhibit 147: 3M Corp. - Key news
Exhibit 148: 3M Corp. - Key offerings
Exhibit 149: 3M Corp. - Segment focus
12.4 Adolf Kuhner AG
Exhibit 150: Adolf Kuhner AG - Overview
Exhibit 151: Adolf Kuhner AG - Product / Service
Exhibit 152: Adolf Kuhner AG - Key offerings
12.5 Avantor Inc.
Exhibit 153: Avantor Inc. - Overview
Exhibit 154: Avantor Inc. - Business segments
Exhibit 155: Avantor Inc. - Key news
Exhibit 156: Avantor Inc. - Key offerings
Exhibit 157: Avantor Inc. - Segment focus
Exhibit 158: Compagnie de Saint Gobain SA - Overview
Exhibit 159: Compagnie de Saint Gobain SA - Business segments
Exhibit 160: Compagnie de Saint Gobain SA - Key news
Exhibit 161: Compagnie de Saint Gobain SA - Key offerings
Exhibit 162: Compagnie de Saint Gobain SA - Segment focus
12.7 Danaher Corp.
Exhibit 163: Danaher Corp. - Overview
Exhibit 164: Danaher Corp. - Business segments
Exhibit 165: Danaher Corp. - Key news
Exhibit 166: Danaher Corp. - Key offerings
Exhibit 167: Danaher Corp. - Segment focus
12.8 Eppendorf AG
Exhibit 168: Eppendorf AG - Overview
Exhibit 169: Eppendorf AG - Product / Service
Exhibit 170: Eppendorf AG - Key news
Exhibit 171: Eppendorf AG - Key offerings
12.9 Merck KGaA
Exhibit 172: Merck KGaA - Overview
Exhibit 173: Merck KGaA - Business segments
Exhibit 174: Merck KGaA - Key news
Exhibit 175: Merck KGaA - Key offerings
Exhibit 176: Merck KGaA - Segment focus
12.10 Sartorius AG
Exhibit 177: Sartorius AG - Overview
Exhibit 178: Sartorius AG - Business segments
Exhibit 179: Sartorius AG - Key news
Exhibit 180: Sartorius AG - Key offerings
Exhibit 181: Sartorius AG - Segment focus
Exhibit 182: Solaris Biotechnology Srl - Overview
Exhibit 183: Solaris Biotechnology Srl - Product / Service
Exhibit 184: Solaris Biotechnology Srl - Key offerings
Exhibit 185: Thermo Fisher Scientific Inc. - Overview
Exhibit 186: Thermo Fisher Scientific Inc. - Business segments
Exhibit 187: Thermo Fisher Scientific Inc. - Key news
Exhibit 188: Thermo Fisher Scientific Inc. - Key offerings
Exhibit 189: Thermo Fisher Scientific Inc. - Segment focus
13 Appendix
13.1 Scope of the report
13.2 Inclusions and exclusions checklist
Exhibit 190: Inclusions checklist
Exhibit 191: Exclusions checklist
13.3 Currency conversion rates for US$
Exhibit 192: Currency conversion rates for US$
13.4 Research methodology
Exhibit 193: Research methodology
Exhibit 194: Validation techniques employed for market sizing
Exhibit 195: Information sources
13.5 List of abbreviations
Exhibit 196: List of abbreviations
About Us
Technavio is a leading global technology research and advisory company. Their research and analysis focuses on emerging market trends and provides actionable insights to help businesses identify market opportunities and develop effective strategies to optimize their market positions. With over 500 specialized analysts, Technavio's report library Their client base consists of enterprises of all sizes, including more than 100 Fortune 500 companies. This growing client base relies on Technavio's comprehensive coverage, extensive research, and actionable market insights to identify opportunities in existing and potential markets and assess their competitive positions within changing market scenarios.
Contact
Technavio Research
Jesse Maida
US: +1 844 364 1100
UK: +44 203 893 3200
Email:[email protected]
Website: www.technavio.com/
SOURCE Technavio
For more details,please visit the original website
The content of the article does not represent any opinions of Synapse and its affiliated companies. If there is any copyright infringement or error, please contact us, and we will deal with it within 24 hours.
Indications
-Targets
-Drugs
-Hot reports


Get started for free today!
Accelerate Strategic R&D decision making with Synapse, PatSnap’s AI-powered Connected Innovation Intelligence Platform Built for Life Sciences Professionals.
Start your data trial now!
Synapse data is also accessible to external entities via APIs or data packages. Leverages most recent intelligence information, enabling fullest potential.