Dental Implant Abutment Systems Market to Record a CAGR of 7.54%, Increasing Prevalence of Dental Diseases to Drive Growth - Discover Company Insights in Technavio
28 Jul 2022
NEW YORK, July 28, 2022 /PRNewswire/ -- The dental implant abutment systems market will be driven by factors such as the
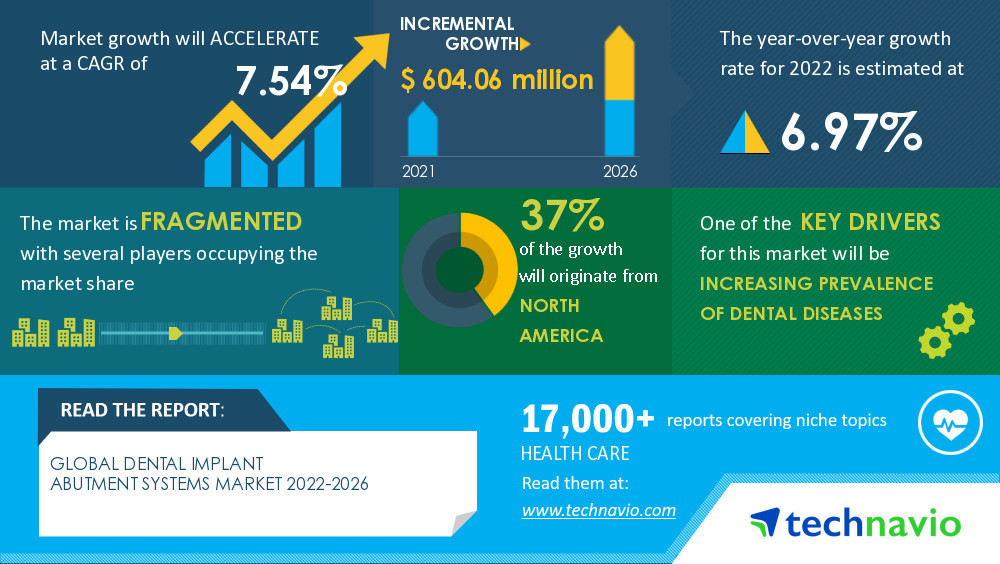
increasing prevalence of dental diseases. Some of the common dental diseases include dental caries, oral cancer, and dental trauma. These diseases are mainly caused by high tobacco consumption, alcohol abuse, and poor oral hygiene. Other causes include limited access to dental care and high consumption of fluoridated water. Among children, the presence of cavities can lead to various orthodontic conditions. Moreover, tooth decay can result in the infection of the teeth and gums as well as tooth loss, which hampers the alignment of the teeth. Thus, the prevalence of dental diseases will drive the demand for dental implants.
Preview
Source: PRNewswire
Technavio has announced its latest market research report titled Dental Implant Abutment Systems Market by Product, Technology, and Geography - Forecast and Analysis 2022-2026
The dental implant abutment systems market size is expected to grow by USD 604.06 million from 2021 to 2026. The report projects that the growth momentum of the market will accelerate at a CAGR of 7.54% during the forecast period.
Technavio offers information about the current global market scenario as well as the
market landscape. Download a Sample Report
Dental Implant Abutment Systems Market: Trend
Technological advances are a trend in the market. Some of these advances include the development of next-generation dental implant abutment systems. For instance, in June 2019, Nobel Biocare Services launched Xeal abutment surface and TiUltra implant surface, which provide enhanced early tissue integration and long-term tissue stability through the Mucointegration concept. Moreover, rapid advances in 3D printed technology have led to the development of customized and biocompatible 3D-printed dental implant abutment systems. For instance, in February 2022, Byrnes Dental Lab implemented an automated post-printing solution. Such advances will fuel the demand for dental implant abutment systems.
Find out which trends will impact the future of the dental implants market.
View our
Sample Report
Dental Implant Abutment Systems Market: Segmentation Analysis
This report segments the dental implant abutment systems market by product (stock/pre-fabricated abutment systems and custom abutment systems), technology (pre-mill and CAD/CAM), and geography (North America, Europe, Asia, and Rest of World (ROW)).
North America will contribute 37% of the market's growth during the forecast period. This growth is attributed to factors such as the increasing prevalence of dental disorders, the growing popularity of dental procedures, the rising awareness and concerns about oral health, and the growing adoption of CAD/CAM technology. Moreover, market growth in this region will be faster than the market growth in other regions. The US is a key country for the dental implant abutment systems market in North America. The high prevalence of dental diseases requiring dental implants is likely to drive the growth of the market focus in the US. For instance, in the US, 63% of adults visited dentists in 2020.
The
stock/prefabricated abutment systems segment by technology will contribute the highest market share growth during the forecast period. These systems are less expensive and easy to use. They have advanced mechanical properties and provide significant biocompatibility. Such factors are driving the growth of this segment.
Learn about the contribution of each segment summarized in concise infographics and thorough descriptions.
View a Sample Report
Related Reports
Dental Diagnostics and Surgical Equipment Market by Product and Geography - Forecast and Analysis 2021-2025
Dental Surgical Equipment Market by Product and Geography - Forecast and Analysis 2021-2025
Table of Contents
1 Executive Summary
1.1 Market overview
Exhibit 01: Executive Summary – Chart on Market Overview
Exhibit 02: Executive Summary – Data Table on Market Overview
Exhibit 03: Executive Summary – Chart on Global Market Characteristics
Exhibit 04: Executive Summary – Chart on Market by Geography
Exhibit 05: Executive Summary – Chart on Market Segmentation by Product
Exhibit 06: Executive Summary – Chart on Market Segmentation by Technology
Exhibit 07: Executive Summary – Chart on Incremental Growth
Exhibit 08: Executive Summary – Data Table on Incremental Growth
Exhibit 09: Executive Summary – Chart on Vendor Market Positioning
2 Market Landscape
2.1 Market ecosystem
Exhibit 10: Parent market
Exhibit 11: Market Characteristics
3 Market Sizing
3.1 Market definition
Exhibit 12: Offerings of vendors included in the market definition
3.2 Market segment analysis
Exhibit 13: Market segments
3.3 Market size 2021
3.4 Market outlook: Forecast for 2021-2026
Exhibit 14: Chart on Global - Market size and forecast 2021-2026 ($ million)
Exhibit 15: Data Table on Global - Market size and forecast 2021-2026 ($ million)
Exhibit 16: Chart on Global Market: Year-over-year growth 2021-2026 (%)
Exhibit 17: Data Table on Global Market: Year-over-year growth 2021-2026 (%)
4 Five Forces Analysis
4.1 Five forces summary
Exhibit 18: Five forces analysis - Comparison between 2021 and 2026
4.2 Bargaining power of buyers
Exhibit 19: Chart on Bargaining power of buyers – Impact of key factors 2021 and 2026
4.3 Bargaining power of suppliers
Exhibit 20: Bargaining power of suppliers – Impact of key factors in 2021 and 2026
4.4 Threat of new entrants
Exhibit 21: Threat of new entrants – Impact of key factors in 2021 and 2026
4.5 Threat of substitutes
Exhibit 22: Threat of substitutes – Impact of key factors in 2021 and 2026
4.6 Threat of rivalry
Exhibit 23: Threat of rivalry – Impact of key factors in 2021 and 2026
4.7 Market condition
Exhibit 24: Chart on Market condition - Five forces 2021 and 2026
5 Market Segmentation by Product
5.1 Market segments
Exhibit 25: Chart on Product - Market share 2021-2026 (%)
Exhibit 26: Data Table on Product - Market share 2021-2026 (%)
5.2 Comparison by Product
Exhibit 27: Chart on Comparison by Product
Exhibit 28: Data Table on Comparison by Product
5.3 Stock/pre-fabricated abutment systems - Market size and forecast 2021-2026
Exhibit 29: Chart on Stock/pre-fabricated abutment systems - Market size and forecast 2021-2026 ($ million)
Exhibit 30: Data Table on Stock/pre-fabricated abutment systems - Market size and forecast 2021-2026 ($ million)
Exhibit 31: Chart on Stock/pre-fabricated abutment systems - Year-over-year growth 2021-2026 (%)
Exhibit 32: Data Table on Stock/pre-fabricated abutment systems - Year-over-year growth 2021-2026 (%)
5.4 Custom abutment systems - Market size and forecast 2021-2026
Exhibit 33: Chart on Custom abutment systems - Market size and forecast 2021-2026 ($ million)
Exhibit 34: Data Table on Custom abutment systems - Market size and forecast 2021-2026 ($ million)
Exhibit 35: Chart on Custom abutment systems - Year-over-year growth 2021-2026 (%)
Exhibit 36: Data Table on Custom abutment systems - Year-over-year growth 2021-2026 (%)
5.5 Market opportunity by Product
Exhibit 37: Market opportunity by Product ($ million)
6 Market Segmentation by Technology
6.1 Market segments
Exhibit 38: Chart on Technology - Market share 2021-2026 (%)
Exhibit 39: Data Table on Technology - Market share 2021-2026 (%)
6.2 Comparison by Technology
Exhibit 40: Chart on Comparison by Technology
Exhibit 41: Data Table on Comparison by Technology
6.3 Pre-mill - Market size and forecast 2021-2026
Exhibit 42: Chart on Pre-mill - Market size and forecast 2021-2026 ($ million)
Exhibit 43: Data Table on Pre-mill - Market size and forecast 2021-2026 ($ million)
Exhibit 44: Chart on Pre-mill - Year-over-year growth 2021-2026 (%)
Exhibit 45: Data Table on Pre-mill - Year-over-year growth 2021-2026 (%)
6.4 CAD/CAM - Market size and forecast 2021-2026
Exhibit 46: Chart on CAD/CAM - Market size and forecast 2021-2026 ($ million)
Exhibit 47: Data Table on CAD/CAM - Market size and forecast 2021-2026 ($ million)
Exhibit 48: Chart on CAD/CAM - Year-over-year growth 2021-2026 (%)
Exhibit 49: Data Table on CAD/CAM - Year-over-year growth 2021-2026 (%)
6.5 Market opportunity by Technology
Exhibit 50: Market opportunity by Technology ($ million)
7 Customer Landscape
7.1 Customer landscape overview
Exhibit 51: Analysis of price sensitivity, lifecycle, customer purchase basket, adoption rates, and purchase criteria
8 Geographic Landscape
8.1 Geographic segmentation
Exhibit 52: Chart on Market share by geography 2021-2026 (%)
Exhibit 53: Data Table on Market share by geography 2021-2026 (%)
8.2 Geographic comparison
Exhibit 54: Chart on Geographic comparison
Exhibit 55: Data Table on Geographic comparison
8.3 North America - Market size and forecast 2021-2026
Exhibit 56: Chart on North America - Market size and forecast 2021-2026 ($ million)
Exhibit 57: Data Table on North America - Market size and forecast 2021-2026 ($ million)
Exhibit 58: Chart on North America - Year-over-year growth 2021-2026 (%)
Exhibit 59: Data Table on North America - Year-over-year growth 2021-2026 (%)
8.4 Europe - Market size and forecast 2021-2026
Exhibit 60: Chart on Europe - Market size and forecast 2021-2026 ($ million)
Exhibit 61: Data Table on Europe - Market size and forecast 2021-2026 ($ million)
Exhibit 62: Chart on Europe - Year-over-year growth 2021-2026 (%)
Exhibit 63: Data Table on Europe - Year-over-year growth 2021-2026 (%)
8.5 Asia - Market size and forecast 2021-2026
Exhibit 64: Chart on Asia - Market size and forecast 2021-2026 ($ million)
Exhibit 65: Data Table on Asia - Market size and forecast 2021-2026 ($ million)
Exhibit 66: Chart on Asia - Year-over-year growth 2021-2026 (%)
Exhibit 67: Data Table on Asia - Year-over-year growth 2021-2026 (%)
8.6 Rest of World (ROW) - Market size and forecast 2021-2026
Exhibit 68: Chart on Rest of World (ROW) - Market size and forecast 2021-2026 ($ million)
Exhibit 69: Data Table on Rest of World (ROW) - Market size and forecast 2021-2026 ($ million)
Exhibit 70: Chart on Rest of World (ROW) - Year-over-year growth 2021-2026 (%)
Exhibit 71: Data Table on Rest of World (ROW) - Year-over-year growth 2021-2026 (%)
8.7 US - Market size and forecast 2021-2026
Exhibit 72: Chart on US - Market size and forecast 2021-2026 ($ million)
Exhibit 73: Data Table on US - Market size and forecast 2021-2026 ($ million)
Exhibit 74: Chart on US - Year-over-year growth 2021-2026 (%)
Exhibit 75: Data Table on US - Year-over-year growth 2021-2026 (%)
8.8 Germany - Market size and forecast 2021-2026
Exhibit 76: Chart on Germany - Market size and forecast 2021-2026 ($ million)
Exhibit 77: Data Table on Germany - Market size and forecast 2021-2026 ($ million)
Exhibit 78: Chart on Germany - Year-over-year growth 2021-2026 (%)
Exhibit 79: Data Table on Germany - Year-over-year growth 2021-2026 (%)
8.9 Japan - Market size and forecast 2021-2026
Exhibit 80: Chart on Japan - Market size and forecast 2021-2026 ($ million)
Exhibit 81: Data Table on Japan - Market size and forecast 2021-2026 ($ million)
Exhibit 82: Chart on Japan - Year-over-year growth 2021-2026 (%)
Exhibit 83: Data Table on Japan - Year-over-year growth 2021-2026 (%)
8.10 China - Market size and forecast 2021-2026
Exhibit 84: Chart on China - Market size and forecast 2021-2026 ($ million)
Exhibit 85: Data Table on China - Market size and forecast 2021-2026 ($ million)
Exhibit 86: Chart on China - Year-over-year growth 2021-2026 (%)
Exhibit 87: Data Table on China - Year-over-year growth 2021-2026 (%)
8.11 France - Market size and forecast 2021-2026
Exhibit 88: Chart on France - Market size and forecast 2021-2026 ($ million)
Exhibit 89: Data Table on France - Market size and forecast 2021-2026 ($ million)
Exhibit 90: Chart on France - Year-over-year growth 2021-2026 (%)
Exhibit 91: Data Table on France - Year-over-year growth 2021-2026 (%)
8.12 Market opportunity by geography
Exhibit 92: Market opportunity by geography ($ million)
9 Drivers, Challenges, and Trends
9.1 Market drivers
9.2 Market challenges
9.3 Impact of drivers and challenges
Exhibit 93: Impact of drivers and challenges in 2021 and 2026
9.4 Market trends
10 Vendor Landscape
10.1 Overview
10.2 Vendor landscape
Exhibit 94: Overview on Criticality of inputs and Factors of differentiation
10.3 Landscape disruption
Exhibit 95: Overview on factors of disruption
10.4 Industry risks
Exhibit 96: Impact of key risks on business
11 Vendor Analysis
11.1 Vendors covered
Exhibit 97: Vendors covered
11.2 Market positioning of vendors
Exhibit 98: Matrix on vendor position and classification
11.3 Adamas Implants Ltd.
Exhibit 99: Adamas Implants Ltd. - Overview
Exhibit 100: Adamas Implants Ltd. - Product / Service
Exhibit 101: Adamas Implants Ltd. - Key offerings
Exhibit 102: Argen Corp. - Overview
Exhibit 103: Argen Corp. - Product / Service
Exhibit 104: Argen Corp. - Key offerings
11.5 Bio3 Implants GmbH
Exhibit 105: Bio3 Implants GmbH - Overview
Exhibit 106: Bio3 Implants GmbH - Product / Service
Exhibit 107: Bio3 Implants GmbH - Key offerings
11.6 Danaher Corp.
Exhibit 108: Danaher Corp. - Overview
Exhibit 109: Danaher Corp. - Business segments
Exhibit 110: Danaher Corp. - Key news
Exhibit 111: Danaher Corp. - Key offerings
Exhibit 112: Danaher Corp. - Segment focus
11.7 DENTSPLY SIRONA Inc.
Exhibit 113: DENTSPLY SIRONA Inc. - Overview
Exhibit 114: DENTSPLY SIRONA Inc. - Business segments
Exhibit 115: DENTSPLY SIRONA Inc. - Key news
Exhibit 116: DENTSPLY SIRONA Inc. - Key offerings
Exhibit 117: DENTSPLY SIRONA Inc. - Segment focus
11.8 Dynamic Abutment Solutions
Exhibit 118: Dynamic Abutment Solutions - Overview
Exhibit 119: Dynamic Abutment Solutions - Product / Service
Exhibit 120: Dynamic Abutment Solutions - Key offerings
11.9 Straumann Holding AG
Exhibit 121: Straumann Holding AG - Overview
Exhibit 122: Straumann Holding AG - Business segments
Exhibit 123: Straumann Holding AG - Key news
Exhibit 124: Straumann Holding AG - Key offerings
Exhibit 125: Straumann Holding AG - Segment focus
11.10 Nobel Biocare Services AG.
Exhibit 126: Nobel Biocare Services AG. - Overview
Exhibit 127: Nobel Biocare Services AG. - Product / Service
Exhibit 128: Nobel Biocare Services AG. - Key offerings
11.11 ZEST Anchors LLC
Exhibit 129: ZEST Anchors LLC - Overview
Exhibit 130: ZEST Anchors LLC - Product / Service
Exhibit 131: ZEST Anchors LLC - Key offerings
Exhibit 132: Zimmer Biomet Holdings Inc. - Overview
Exhibit 133: Zimmer Biomet Holdings Inc. - Business segments
Exhibit 134: Zimmer Biomet Holdings Inc. - Key news
Exhibit 135: Zimmer Biomet Holdings Inc. - Key offerings
Exhibit 136: Zimmer Biomet Holdings Inc. - Segment focus
12.1 Scope of the report
12.2 Inclusions and exclusions checklist
Exhibit 137: Inclusions checklist
Exhibit 138: Exclusions checklist
12.3 Currency conversion rates for US$
Exhibit 139: Currency conversion rates for US$
12.4 Research methodology
Exhibit 140: Research methodology
Exhibit 141: Validation techniques employed for market sizing
Exhibit 142: Information sources
12.5 List of abbreviations
Exhibit 143: List of abbreviations
About Technavio
Technavio is a leading global technology research and advisory company. Their research and analysis focus on emerging market trends and provide actionable insights to help businesses identify market opportunities and develop effective strategies to optimize their market positions.
With over 500 specialized analysts, Technavio's report library consists of more than 17,000 reports and counting, covering 800 technologies, spanning across 50 countries. Their client base consists of enterprises of all sizes, including more than 100 Fortune 500 companies. This growing client base relies on Technavio's comprehensive coverage, extensive research, and actionable market insights to identify opportunities in existing and potential markets and assess their competitive positions within changing market scenarios.
Contacts
Technavio Research
Jesse Maida
US: +1 844 364 1100
UK: +44 203 893 3200
Email: [email protected]
Website: www.technavio.com/
SOURCE Technavio
For more details,please visit the original website
The content of the article does not represent any opinions of Synapse and its affiliated companies. If there is any copyright infringement or error, please contact us, and we will deal with it within 24 hours.
Indications
Targets
-Drugs
-Chat with Hiro
Hot reports


Get started for free today!
Accelerate Strategic R&D decision making with Synapse, PatSnap’s AI-powered Connected Innovation Intelligence Platform Built for Life Sciences Professionals.
Start your data trial now!
Synapse data is also accessible to external entities via APIs or data packages. Empower better decisions with the latest in pharmaceutical intelligence.