Orthopedic prosthetics market to grow by 4.52% Y-O-Y from 2022 to 2023: Growing number of trauma, accident cases, and birth defects will drive growth - Technavio
19 Dec 2022
NEW YORK, Dec. 19, 2022 /PRNewswire/ --
Orthopedic prosthetics market insights -
Continue Reading
Preview
Source: PRNewswire
Technavio has announced its latest market research report titled Global Orthopedic Prosthetics Market 2023-2027
Vendors: 15+, Including Advanced Arm Dynamics Inc, Arthrex Inc., Artificial Limbs Manufacturing Corp. of India, B. Braun SE, Blatchford Group, Exactech Inc., Fillauer LLC, Globus Medical Inc., Hanger Inc., Johnson & Johnson, LeTourneau Prosthetics and Orthotics, Orthotic and Prosthetic Lab Inc, Ossur hf, Ottobock SE & Co. KGaA, RTI Surgical Inc., Smith and Nephew plc, Steeper Inc., Stryker Corp., WillowWood Global LLC, and Zimmer Biomet Holdings Inc. among others
Coverage: Parent market analysis; key drivers, major trends, and challenges; customer and vendor landscape; vendor product insights and recent developments; key vendors; and market positioning of vendors
Segments: Product (lower extremity orthopedic prosthetics and upper extremity orthopedic prosthetics), technology (conventional, electric-powered, and hybrid), and geography (North America, Europe, Asia, and Rest of World (ROW)).
To understand more about the orthopedic prosthetics market, request a sample report
The orthopedic prosthetics market report provides critical information and factual data, with a qualitative and quantitative study of the market based on market drivers and limitations as well as future prospects.
Why Buy?
Add credibility to strategy
Analyzes competitor's offerings
Get a holistic view of the market
Grow your profit margin with Technavio- Buy the Report
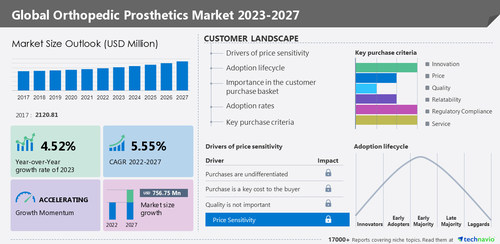
In 2017, the orthopedic prosthetics market was valued at
USD 2,120.81
million. From a regional perspective, North America held the largest market share, valued at
USD 794.22
million. The
orthopedic prosthetics market size is estimated to grow by
USD 756.75 million from 2022 to 2027 at a
CAGR of 5.55% according to Technavio.
Orthopedic prosthetics market - Customer landscape
To help companies evaluate and develop growth strategies, the report outlines –
Key purchase criteria
Adoption rates
Adoption lifecycle
Drivers of price sensitivity
For highlights on customer landscape analysis, download a sample!
Global orthopedic prosthetics market - Vendor Insights
The growing competition in the market is compelling vendors to adopt various growth strategies such as promotional activities and spending on advertisements to improve the visibility of their services. Technavio report analyzes the market's competitive landscape and offers information on several market vendors including –
Advanced Arm Dynamics Inc: The company offers Orthopedic Prosthetics products for the upper limbs and lower limbs under two brands, namely, Cappful and Caproq.
Arthrex Inc.: The company offers Orthopedic Prosthetics products for shoulder, knee, elbow, arthroplasty shoulder, hand and wrist and foot and ankle.
B. Braun SE: The company offers Orthopedic Prosthetics products for total hip joint replacements and hip arthroplasty under brands called AESCULAP and Plasmafit.
Global orthopedic prosthetics market –
Market dynamics
Major Drivers:
Growing number of trauma, accident cases, and birth defects
Availability of technically advanced orthopedic prosthetics
Growing number of amputation surgeries and the focus on restoring mobility and independence among amputees
KEY challenges:
High cost of prosthetics
Insufficient reimbursement policies and reimbursement denial by private insurance companies
Risks and complications related to prosthetic devices
Drivers, & Challenges have an impact on market dynamics and can impact businesses. Find some insights from a sample report!
What are the key data covered in this orthopedic prosthetics market report?
CAGR of the market during the forecast period
Detailed information on factors that will drive the growth of the orthopedic prosthetics market between 2023 and 2027
Precise estimation of the size of the orthopedic prosthetics market and its contribution to the parent market
Accurate predictions about upcoming trends and changes in consumer behavior
Growth of the orthopedic prosthetics market across North America, Europe, Asia, and Rest of World (ROW)
A thorough analysis of the market's competitive landscape and detailed information about vendors
Comprehensive analysis of factors that will challenge the growth of orthopedic prosthetics market vendors
Gain instant access to 17,000+ market research reports.
Technavio's SUBSCRIPTION platform
Related Reports:
Gender Reassignment Surgery Market by Type, End-user and Geography - Forecast and Analysis 2023-2027: The gender reassignment surgery market is estimated to grow at a
CAGR of 10.73% between 2022 and 2027. The size of the market is forecast to increase by
USD 321.48 million. This report extensively covers market segmentation by type (male to female and female to male), end-user (hospitals and clinics), and geography (North America, Europe, Asia, and Rest of the World (ROW)).
N95 Respirators Market by Type, Distribution Channel, and Geography - Forecast and Analysis 2023-2027: The N95 respirators market is estimated to grow at a
CAGR of 6.1% between 2022 and 2027. The size of the market is forecast to increase by
USD 415.31 million. This report extensively covers market segmentation by type (respirators without exhalation valve and respirators with exhalation valve), distribution channel (offline and online), and geography (North America, Asia, Europe, and Rest of World (ROW)).
Browse for Technavio "Health Care" Research Reports
Table of Contents
1 Executive Summary
1.1 Market overview
Exhibit 01: Executive Summary – Chart on Market Overview
Exhibit 02: Executive Summary – Data Table on Market Overview
Exhibit 03: Executive Summary – Chart on Global Market Characteristics
Exhibit 04: Executive Summary – Chart on Market by Geography
Exhibit 05: Executive Summary – Chart on Market Segmentation by Product
Exhibit 06: Executive Summary – Chart on Market Segmentation by Technology
Exhibit 07: Executive Summary – Chart on Incremental Growth
Exhibit 08: Executive Summary – Data Table on Incremental Growth
Exhibit 09: Executive Summary – Chart on Vendor Market Positioning
2 Market Landscape
2.1 Market ecosystem
Exhibit 10: Parent market
Exhibit 11: Market Characteristics
3 Market Sizing
3.1 Market definition
Exhibit 12: Offerings of vendors included in the market definition
3.2 Market segment analysis
Exhibit 13: Market segments
3.3 Market size 2022
3.4 Market outlook: Forecast for 2022-2027
Exhibit 14: Chart on Global - Market size and forecast 2022-2027 ($ million)
Exhibit 15: Data Table on Global - Market size and forecast 2022-2027 ($ million)
Exhibit 16: Chart on Global Market: Year-over-year growth 2022-2027 (%)
Exhibit 17: Data Table on Global Market: Year-over-year growth 2022-2027 (%)
4 Historic Market Size
4.1 Global Orthopedic Prosthetics Market 2017 - 2021
Exhibit 18: Historic Market Size – Data Table on Global Orthopedic Prosthetics Market 2017 - 2021 ($ million)
4.2 Product Segment Analysis 2017 - 2021
Exhibit 19: Historic Market Size – Product Segment 2017 - 2021 ($ million)
4.3 Technology Segment Analysis 2017 - 2021
Exhibit 20: Historic Market Size – Technology Segment 2017 - 2021 ($ million)
4.4 Geography Segment Analysis 2017 - 2021
Exhibit 21: Historic Market Size – Geography Segment 2017 - 2021 ($ million)
4.5 Country Segment Analysis 2017 - 2021
Exhibit 22: Historic Market Size – Country Segment 2017 - 2021 ($ million)
5 Five Forces Analysis
5.1 Five forces summary
Exhibit 23: Five forces analysis - Comparison between 2022 and 2027
5.2 Bargaining power of buyers
Exhibit 24: Chart on Bargaining power of buyers – Impact of key factors 2022 and 2027
5.3 Bargaining power of suppliers
Exhibit 25: Bargaining power of suppliers – Impact of key factors in 2022 and 2027
5.4 Threat of new entrants
Exhibit 26: Threat of new entrants – Impact of key factors in 2022 and 2027
5.5 Threat of substitutes
Exhibit 27: Threat of substitutes – Impact of key factors in 2022 and 2027
5.6 Threat of rivalry
Exhibit 28: Threat of rivalry – Impact of key factors in 2022 and 2027
5.7 Market condition
Exhibit 29: Chart on Market condition - Five forces 2022 and 2027
6 Market Segmentation by Product
6.1 Market segments
Exhibit 30: Chart on Product - Market share 2022-2027 (%)
Exhibit 31: Data Table on Product - Market share 2022-2027 (%)
6.2 Comparison by Product
Exhibit 32: Chart on Comparison by Product
Exhibit 33: Data Table on Comparison by Product
6.3 Lower extremity orthopedic prosthetics - Market size and forecast 2022-2027
Exhibit 34: Chart on Lower extremity orthopedic prosthetics - Market size and forecast 2022-2027 ($ million)
Exhibit 35: Data Table on Lower extremity orthopedic prosthetics - Market size and forecast 2022-2027 ($ million)
Exhibit 36: Chart on Lower extremity orthopedic prosthetics - Year-over-year growth 2022-2027 (%)
Exhibit 37: Data Table on Lower extremity orthopedic prosthetics - Year-over-year growth 2022-2027 (%)
6.4 Upper extremity orthopedic prosthetics - Market size and forecast 2022-2027
Exhibit 38: Chart on Upper extremity orthopedic prosthetics - Market size and forecast 2022-2027 ($ million)
Exhibit 39: Data Table on Upper extremity orthopedic prosthetics - Market size and forecast 2022-2027 ($ million)
Exhibit 40: Chart on Upper extremity orthopedic prosthetics - Year-over-year growth 2022-2027 (%)
Exhibit 41: Data Table on Upper extremity orthopedic prosthetics - Year-over-year growth 2022-2027 (%)
6.5 Market opportunity by Product
Exhibit 42: Market opportunity by Product ($ million)
7 Market Segmentation by Technology
7.1 Market segments
Exhibit 43: Chart on Technology - Market share 2022-2027 (%)
Exhibit 44: Data Table on Technology - Market share 2022-2027 (%)
7.2 Comparison by Technology
Exhibit 45: Chart on Comparison by Technology
Exhibit 46: Data Table on Comparison by Technology
7.3 Conventional - Market size and forecast 2022-2027
Exhibit 47: Chart on Conventional - Market size and forecast 2022-2027 ($ million)
Exhibit 48: Data Table on Conventional - Market size and forecast 2022-2027 ($ million)
Exhibit 49: Chart on Conventional - Year-over-year growth 2022-2027 (%)
Exhibit 50: Data Table on Conventional - Year-over-year growth 2022-2027 (%)
7.4 Electric-powered - Market size and forecast 2022-2027
Exhibit 51: Chart on Electric-powered - Market size and forecast 2022-2027 ($ million)
Exhibit 52: Data Table on Electric-powered - Market size and forecast 2022-2027 ($ million)
Exhibit 53: Chart on Electric-powered - Year-over-year growth 2022-2027 (%)
Exhibit 54: Data Table on Electric-powered - Year-over-year growth 2022-2027 (%)
7.5 Hybrid - Market size and forecast 2022-2027
Exhibit 55: Chart on Hybrid - Market size and forecast 2022-2027 ($ million)
Exhibit 56: Data Table on Hybrid - Market size and forecast 2022-2027 ($ million)
Exhibit 57: Chart on Hybrid - Year-over-year growth 2022-2027 (%)
Exhibit 58: Data Table on Hybrid - Year-over-year growth 2022-2027 (%)
7.6 Market opportunity by Technology
Exhibit 59: Market opportunity by Technology ($ million)
8 Customer Landscape
8.1 Customer landscape overview
Exhibit 60: Analysis of price sensitivity, lifecycle, customer purchase basket, adoption rates, and purchase criteria
9 Geographic Landscape
9.1 Geographic segmentation
Exhibit 61: Chart on Market share by geography 2022-2027 (%)
Exhibit 62: Data Table on Market share by geography 2022-2027 (%)
9.2 Geographic comparison
Exhibit 63: Chart on Geographic comparison
Exhibit 64: Data Table on Geographic comparison
9.3 North America - Market size and forecast 2022-2027
Exhibit 65: Chart on North America - Market size and forecast 2022-2027 ($ million)
Exhibit 66: Data Table on North America - Market size and forecast 2022-2027 ($ million)
Exhibit 67: Chart on North America - Year-over-year growth 2022-2027 (%)
Exhibit 68: Data Table on North America - Year-over-year growth 2022-2027 (%)
9.4 Europe - Market size and forecast 2022-2027
Exhibit 69: Chart on Europe - Market size and forecast 2022-2027 ($ million)
Exhibit 70: Data Table on Europe - Market size and forecast 2022-2027 ($ million)
Exhibit 71: Chart on Europe - Year-over-year growth 2022-2027 (%)
Exhibit 72: Data Table on Europe - Year-over-year growth 2022-2027 (%)
9.5 Asia - Market size and forecast 2022-2027
Exhibit 73: Chart on Asia - Market size and forecast 2022-2027 ($ million)
Exhibit 74: Data Table on Asia - Market size and forecast 2022-2027 ($ million)
Exhibit 75: Chart on Asia - Year-over-year growth 2022-2027 (%)
Exhibit 76: Data Table on Asia - Year-over-year growth 2022-2027 (%)
9.6 Rest of World (ROW) - Market size and forecast 2022-2027
Exhibit 77: Chart on Rest of World (ROW) - Market size and forecast 2022-2027 ($ million)
Exhibit 78: Data Table on Rest of World (ROW) - Market size and forecast 2022-2027 ($ million)
Exhibit 79: Chart on Rest of World (ROW) - Year-over-year growth 2022-2027 (%)
Exhibit 80: Data Table on Rest of World (ROW) - Year-over-year growth 2022-2027 (%)
9.7 US - Market size and forecast 2022-2027
Exhibit 81: Chart on US - Market size and forecast 2022-2027 ($ million)
Exhibit 82: Data Table on US - Market size and forecast 2022-2027 ($ million)
Exhibit 83: Chart on US - Year-over-year growth 2022-2027 (%)
Exhibit 84: Data Table on US - Year-over-year growth 2022-2027 (%)
9.8 Germany - Market size and forecast 2022-2027
Exhibit 85: Chart on Germany - Market size and forecast 2022-2027 ($ million)
Exhibit 86: Data Table on Germany - Market size and forecast 2022-2027 ($ million)
Exhibit 87: Chart on Germany - Year-over-year growth 2022-2027 (%)
Exhibit 88: Data Table on Germany - Year-over-year growth 2022-2027 (%)
9.9 China - Market size and forecast 2022-2027
Exhibit 89: Chart on China - Market size and forecast 2022-2027 ($ million)
Exhibit 90: Data Table on China - Market size and forecast 2022-2027 ($ million)
Exhibit 91: Chart on China - Year-over-year growth 2022-2027 (%)
Exhibit 92: Data Table on China - Year-over-year growth 2022-2027 (%)
9.10 UK - Market size and forecast 2022-2027
Exhibit 93: Chart on UK - Market size and forecast 2022-2027 ($ million)
Exhibit 94: Data Table on UK - Market size and forecast 2022-2027 ($ million)
Exhibit 95: Chart on UK - Year-over-year growth 2022-2027 (%)
Exhibit 96: Data Table on UK - Year-over-year growth 2022-2027 (%)
9.11 Canada - Market size and forecast 2022-2027
Exhibit 97: Chart on Canada - Market size and forecast 2022-2027 ($ million)
Exhibit 98: Data Table on Canada - Market size and forecast 2022-2027 ($ million)
Exhibit 99: Chart on Canada - Year-over-year growth 2022-2027 (%)
Exhibit 100: Data Table on Canada - Year-over-year growth 2022-2027 (%)
9.12 Market opportunity by geography
Exhibit 101: Market opportunity by geography ($ million)
10 Drivers, Challenges, and Trends
10.1 Market drivers
10.2 Market challenges
10.3 Impact of drivers and challenges
Exhibit 102: Impact of drivers and challenges in 2022 and 2027
10.4 Market trends
11 Vendor Landscape
11.1 Overview
11.2 Vendor landscape
Exhibit 103: Overview on Criticality of inputs and Factors of differentiation
11.3 Landscape disruption
Exhibit 104: Overview on factors of disruption
11.4 Industry risks
Exhibit 105: Impact of key risks on business
12 Vendor Analysis
12.1 Vendors covered
Exhibit 106: Vendors covered
12.2 Market positioning of vendors
Exhibit 107: Matrix on vendor position and classification
12.3 Advanced Arm Dynamics Inc
Exhibit 108: Advanced Arm Dynamics Inc - Overview
Exhibit 109: Advanced Arm Dynamics Inc - Product / Service
Exhibit 110: Advanced Arm Dynamics Inc - Key offerings
12.4 Arthrex Inc.
Exhibit 111: Arthrex Inc. - Overview
Exhibit 112: Arthrex Inc. - Product / Service
Exhibit 113: Arthrex Inc. - Key offerings
12.5 B. Braun SE
Exhibit 114: B. Braun SE - Overview
Exhibit 115: B. Braun SE - Business segments
Exhibit 116: B. Braun SE - Key news
Exhibit 117: B. Braun SE - Key offerings
Exhibit 118: B. Braun SE - Segment focus
12.6 Blatchford Group
Exhibit 119: Blatchford Group - Overview
Exhibit 120: Blatchford Group - Key offerings
12.7 Exactech Inc.
Exhibit 121: Exactech Inc. - Overview
Exhibit 122: Exactech Inc. - Product / Service
Exhibit 123: Exactech Inc. - Key offerings
12.8 Fillauer LLC
Exhibit 124: Fillauer LLC - Overview
Exhibit 125: Fillauer LLC - Product / Service
Exhibit 126: Fillauer LLC - Key offerings
12.9 Globus Medical Inc.
Exhibit 127: Globus Medical Inc. - Overview
Exhibit 128: Globus Medical Inc. - Product / Service
Exhibit 129: Globus Medical Inc. - Key offerings
12.10 Hanger Inc.
Exhibit 130: Hanger Inc. - Overview
Exhibit 131: Hanger Inc. - Business segments
Exhibit 132: Hanger Inc. - Key offerings
Exhibit 133: Hanger Inc. - Segment focus
12.11 Johnson and Johnson
Exhibit 134: Johnson and Johnson - Overview
Exhibit 135: Johnson and Johnson - Business segments
Exhibit 136: Johnson and Johnson - Key news
Exhibit 137: Johnson and Johnson - Key offerings
Exhibit 138: Johnson and Johnson - Segment focus
12.12 Ossur hf
Exhibit 139: Ossur hf - Overview
Exhibit 140: Ossur hf - Business segments
Exhibit 141: Ossur hf - Key news
Exhibit 142: Ossur hf - Key offerings
Exhibit 143: Ossur hf - Segment focus
12.13 Ottobock SE and Co. KGaA
Exhibit 144: Ottobock SE and Co. KGaA - Overview
Exhibit 145: Ottobock SE and Co. KGaA - Product / Service
Exhibit 146: Ottobock SE and Co. KGaA - Key offerings
12.14 Smith and Nephew plc
Exhibit 147: Smith and Nephew plc - Overview
Exhibit 148: Smith and Nephew plc - Business segments
Exhibit 149: Smith and Nephew plc - Key news
Exhibit 150: Smith and Nephew plc - Key offerings
Exhibit 151: Smith and Nephew plc - Segment focus
12.15 Stryker Corp.
Exhibit 152: Stryker Corp. - Overview
Exhibit 153: Stryker Corp. - Business segments
Exhibit 154: Stryker Corp. - Key news
Exhibit 155: Stryker Corp. - Key offerings
Exhibit 156: Stryker Corp. - Segment focus
12.16 WillowWood Global LLC
Exhibit 157: WillowWood Global LLC - Overview
Exhibit 158: WillowWood Global LLC - Product / Service
Exhibit 159: WillowWood Global LLC - Key offerings
Exhibit 160: Zimmer Biomet Holdings Inc. - Overview
Exhibit 161: Zimmer Biomet Holdings Inc. - Business segments
Exhibit 162: Zimmer Biomet Holdings Inc. - Key news
Exhibit 163: Zimmer Biomet Holdings Inc. - Key offerings
Exhibit 164: Zimmer Biomet Holdings Inc. - Segment focus
13 Appendix
13.1 Scope of the report
13.2 Inclusions and exclusions checklist
Exhibit 165: Inclusions checklist
Exhibit 166: Exclusions checklist
13.3 Currency conversion rates for US$
Exhibit 167: Currency conversion rates for US$
13.4 Research methodology
Exhibit 168: Research methodology
Exhibit 169: Validation techniques employed for market sizing
Exhibit 170: Information sources
13.5 List of abbreviations
Exhibit 171: List of abbreviations
About Us
Technavio is a leading global technology research and advisory company. Their research and analysis focuses on emerging market trends and provides actionable insights to help businesses identify market opportunities and develop effective strategies to optimize their market positions. With over 500 specialized analysts, Technavio's report library consists of more than 17,000 reports and counting, covering 800 technologies, spanning across 50 countries. Their client base consists of enterprises of all sizes, including more than 100 Fortune 500 companies. This growing client base relies on Technavio's comprehensive coverage, extensive research, and actionable market insights to identify opportunities in existing and potential markets and assess their competitive positions within changing market scenarios.
Contact
Technavio Research
Jesse Maida
Media & Marketing Executive
US: +1 844 364 1100
UK: +44 203 893 3200
Email: [email protected]
Website: www.technavio.com/
SOURCE Technavio
For more details,please visit the original website
The content of the article does not represent any opinions of Synapse and its affiliated companies. If there is any copyright infringement or error, please contact us, and we will deal with it within 24 hours.
Indications
Targets
-Drugs
-Chat with Hiro
Hot reports


Get started for free today!
Accelerate Strategic R&D decision making with Synapse, PatSnap’s AI-powered Connected Innovation Intelligence Platform Built for Life Sciences Professionals.
Start your data trial now!
Synapse data is also accessible to external entities via APIs or data packages. Empower better decisions with the latest in pharmaceutical intelligence.