Traumatic brain injury assessment and management devices size to increase by USD 1,723.41 million: North America will account for 41% of market growth - Technavio
12 Jan 2023
NEW YORK, Jan. 12, 2023 /PRNewswire/ -- The
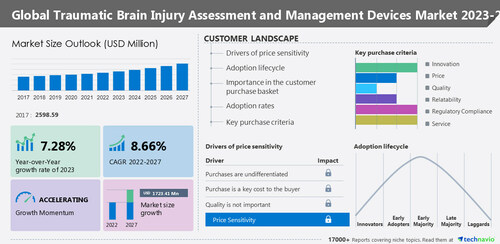
traumatic brain injury assessment and management devices market by end-user, device, and geography - forecast and analysis 2023-2027 report has been published by Technavio. Market growth is estimated to accelerate at a CAGR of 8.66% and register an incremental growth of USD 1,723.41 million during the forecast period. The report provides a comprehensive analysis of growth opportunities at regional levels, new product launches, the latest trends, and the post-pandemic recovery of the global market.
Download a PDF sample report
Company Profiles
Continue Reading
Preview
Source: PRNewswire
Technavio has announced its latest market research report titled Global Traumatic Brain Injury Assessment and Management Devices Market 2023-2027
The traumatic brain injury assessment and management devices market report includes information on the key products and recent developments of leading vendors, including:
BrainScope Co. Inc. - The company offers a traumatic brain injury assessment and management device namely BrainScope One.
. - The company offers traumatic brain injury assessment and management devices namely Infrascanner 2000.
Compumedics Ltd. - The company offers traumatic brain injury assessment and management devices namely DWL TBI Device.
Elekta AB - The company offers traumatic brain injury assessment and management devices namely the Leksell Vantage Stereotactic system.
INTEGRA - The company offers traumatic brain injury assessment and management devices namely CereLink ICP Monitoring System
To gain access to more vendor profiles available with Technavio,
buy the report!
Regional analysis
Based on region, the global traumatic brain injury assessment and management devices market is segmented into North America, Europe, Asia, and Rest of World (ROW). North America is estimated to account for 41% of the growth of the global market over the forecast period. The presence of the US, the world's largest healthcare devices market, is driving market growth in the region.
Market Dynamics
The market is driven by factors such as the increasing prevalence of brain surgeries, rising awareness about traumatic brain injuries, and the rise in road accidents. However, the scarcity of skilled neurologists and neurodiagnostic technicians is hindering market growth.
Competitive analysis
The competitive scenario categorizes companies based on various performance indicators. Some of the factors considered include the financial performance of companies over the past few years, growth strategies, product innovations, new product launches, investments, and growth in market share, among others.
Request a sample
Market Segmentation
Based on end-user, the market is segmented into hospitals, diagnostic centers, and others. The
hospital's segment accounted for the largest share of the market in 2022.
Based on geography, the market is classified as North America, Europe, Asia, and Rest of World (ROW).
North America held the largest share of the market in 2022.
Related Reports:
The cognitive assessment and training market size is forecasted to grow by USD 13.55 billion from 2020 to 2025, and the market's growth momentum will accelerate at a CAGR of 33.07%. The cost-effective online cognitive assessments are notably driving the cognitive assessment and training market growth, although factors such as credibility concerns may impede the market growth.
The medical device manufacturing outsourcing market is estimated to grow at a CAGR of 10.85% between 2022 and 2027. The size of the market is forecast to increase by USD 46,241.15 million. The growing focus of OEMs on reducing medical device manufacturing costs is notably driving the market growth, although factors such as stringent regulatory environment may impede the market growth.
Technavio's library includes over 17,000+ reports, covering more than 2,000 emerging technologies.
Subscribe to our "Basic Plan" at just USD 5,000 and get lifetime access to Technavio Insights
What are the Key Data Covered in this Traumatic Brain Injury Assessment And Management Devices Market Report?
CAGR of the market during the forecast period
Detailed information on factors that will drive the growth of the traumatic brain injury assessment and management devices market between 2023 and 2027
Precise estimation of the traumatic brain injury assessment and management devices market size and its contribution to the parent market
Accurate predictions about upcoming trends and changes in consumer behavior
Growth of the industry across North America, Europe, Asia, and Rest of World (ROW)
A thorough analysis of the market's competitive landscape and detailed information about vendors
Comprehensive analysis of factors that will challenge the growth of traumatic brain injury assessment and management devices market vendors
Browse for Technavio's
healthcare market
reports
Table of Contents:
1 Executive Summary
1.1 Market Overview
Exhibit 01: Executive Summary – Chart on Market Overview
Exhibit 02: Executive Summary – Data Table on Market Overview
Exhibit 03: Executive Summary – Chart on Global Market Characteristics
Exhibit 04: Executive Summary – Chart on Market by Geography
Exhibit 05: Executive Summary – Chart on Market Segmentation by End-user
Exhibit 06: Executive Summary – Chart on Market Segmentation by Device
Exhibit 07: Executive Summary – Chart on Incremental Growth
Exhibit 08: Executive Summary – Data Table on Incremental Growth
Exhibit 09: Executive Summary – Chart on Vendor Market Positioning
2 Market Landscape
2.1 Market ecosystem
Exhibit 10: Parent market
Exhibit 11: Market Characteristics
3 Market Sizing
3.1 Market Definition
Exhibit 12: Offerings of vendors included in the market definition
3.2 Market segment analysis
Exhibit 13: Market segments
3.3 Market size 2022
3.4 Market outlook: Forecast for 2022-2027
Exhibit 14: Chart on Global - Market size and forecast 2022-2027 ($ million)
Exhibit 15: Data Table on Global - Market size and forecast 2022-2027 ($ million)
Exhibit 16: Chart on Global Market: Year-over-year growth 2022-2027 (%)
Exhibit 17: Data Table on Global Market: Year-over-year growth 2022-2027 (%)
4 Historic Market Size
4.1 Global traumatic brain injury assessment and management devices market 2017 - 2021
Exhibit 18: Historic Market Size – Data Table on Global traumatic brain injury assessment and management devices market 2017 - 2021 ($ million)
4.2 End-user Segment Analysis 2017 - 2021
Exhibit 19: Historic Market Size – End-user Segment 2017 - 2021 ($ million)
4.3 Device Segment Analysis 2017 - 2021
Exhibit 20: Historic Market Size – Device Segment 2017 - 2021 ($ million)
4.4 Geography Segment Analysis 2017 - 2021
Exhibit 21: Historic Market Size – Geography Segment 2017 - 2021 ($ million)
4.5 Country Segment Analysis 2017 - 2021
Exhibit 22: Historic Market Size – Country Segment 2017 - 2021 ($ million)
5 Five Forces Analysis
5.1 Five forces summary
Exhibit 23: Five forces analysis - Comparison between 2022 and 2027
5.2 Bargaining power of buyers
Exhibit 24: Chart on Bargaining power of buyers – Impact of key factors 2022 and 2027
5.3 Bargaining power of suppliers
Exhibit 25: Bargaining power of suppliers – Impact of key factors in 2022 and 2027
5.4 Threat of new entrants
Exhibit 26: Threat of new entrants – Impact of key factors in 2022 and 2027
5.5 Threat of substitutes
Exhibit 27: Threat of substitutes – Impact of key factors in 2022 and 2027
5.6 Threat of rivalry
Exhibit 28: Threat of rivalry – Impact of key factors in 2022 and 2027
5.7 Market condition
Exhibit 29: Chart on Market condition - Five forces 2022 and 2027
6 Market Segmentation by End-user
6.1 Market segments
Exhibit 30: Chart on End-user - Market share 2022-2027 (%)
Exhibit 31: Data Table on End-user - Market share 2022-2027 (%)
6.2 Comparison by End-user
Exhibit 32: Chart on Comparison by End-user
Exhibit 33: Data Table on Comparison by End-user
6.3 Hospitals - Market size and forecast 2022-2027
Exhibit 34: Chart on Hospitals - Market size and forecast 2022-2027 ($ million)
Exhibit 35: Data Table on Hospitals - Market size and forecast 2022-2027 ($ million)
Exhibit 36: Chart on Hospitals - Year-over-year growth 2022-2027 (%)
Exhibit 37: Data Table on Hospitals - Year-over-year growth 2022-2027 (%)
6.4 Diagnostic centers - Market size and forecast 2022-2027
Exhibit 38: Chart on Diagnostic centers - Market size and forecast 2022-2027 ($ million)
Exhibit 39: Data Table on Diagnostic centers - Market size and forecast 2022-2027 ($ million)
Exhibit 40: Chart on Diagnostic centers - Year-over-year growth 2022-2027 (%)
Exhibit 41: Data Table on Diagnostic centers - Year-over-year growth 2022-2027 (%)
6.5 Others - Market size and forecast 2022-2027
Exhibit 42: Chart on Others - Market size and forecast 2022-2027 ($ million)
Exhibit 43: Data Table on Others - Market size and forecast 2022-2027 ($ million)
Exhibit 44: Chart on Others - Year-over-year growth 2022-2027 (%)
Exhibit 45: Data Table on Others - Year-over-year growth 2022-2027 (%)
6.6 Market opportunity by End-user
Exhibit 46: Market opportunity by End-user ($ million)
7 Market Segmentation by Device
7.1 Market segments
Exhibit 47: Chart on Device - Market share 2022-2027 (%)
Exhibit 48: Data Table on Device - Market share 2022-2027 (%)
7.2 Comparison by Device
Exhibit 49: Chart on Comparison by Device
Exhibit 50: Data Table on Comparison by Device
7.3 Imaging - Market size and forecast 2022-2027
Exhibit 51: Chart on Imaging - Market size and forecast 2022-2027 ($ million)
Exhibit 52: Data Table on Imaging - Market size and forecast 2022-2027 ($ million)
Exhibit 53: Chart on Imaging - Year-over-year growth 2022-2027 (%)
Exhibit 54: Data Table on Imaging - Year-over-year growth 2022-2027 (%)
7.4 Monitoring devices - Market size and forecast 2022-2027
Exhibit 55: Chart on Monitoring devices - Market size and forecast 2022-2027 ($ million)
Exhibit 56: Data Table on Monitoring devices - Market size and forecast 2022-2027 ($ million)
Exhibit 57: Chart on Monitoring devices - Year-over-year growth 2022-2027 (%)
Exhibit 58: Data Table on Monitoring devices - Year-over-year growth 2022-2027 (%)
7.5 Market opportunity by Device
Exhibit 59: Market opportunity by Device ($ million)
8 Customer Landscape
8.1 Customer landscape overview
Exhibit 60: Analysis of price sensitivity, lifecycle, customer purchase basket, adoption rates, and purchase criteria
9 Geographic Landscape
9.1 Geographic segmentation
Exhibit 61: Chart on Market share by geography 2022-2027 (%)
Exhibit 62: Data Table on Market share by geography 2022-2027 (%)
9.2 Geographic comparison
Exhibit 63: Chart on Geographic comparison
Exhibit 64: Data Table on Geographic comparison
9.3 North America - Market size and forecast 2022-2027
Exhibit 65: Chart on North America - Market size and forecast 2022-2027 ($ million)
Exhibit 66: Data Table on North America - Market size and forecast 2022-2027 ($ million)
Exhibit 67: Chart on North America - Year-over-year growth 2022-2027 (%)
Exhibit 68: Data Table on North America - Year-over-year growth 2022-2027 (%)
9.4 Europe - Market size and forecast 2022-2027
Exhibit 69: Chart on Europe - Market size and forecast 2022-2027 ($ million)
Exhibit 70: Data Table on Europe - Market size and forecast 2022-2027 ($ million)
Exhibit 71: Chart on Europe - Year-over-year growth 2022-2027 (%)
Exhibit 72: Data Table on Europe - Year-over-year growth 2022-2027 (%)
9.5 Asia - Market size and forecast 2022-2027
Exhibit 73: Chart on Asia - Market size and forecast 2022-2027 ($ million)
Exhibit 74: Data Table on Asia - Market size and forecast 2022-2027 ($ million)
Exhibit 75: Chart on Asia - Year-over-year growth 2022-2027 (%)
Exhibit 76: Data Table on Asia - Year-over-year growth 2022-2027 (%)
9.6 Rest of World (ROW) - Market size and forecast 2022-2027
Exhibit 77: Chart on Rest of World (ROW) - Market size and forecast 2022-2027 ($ million)
Exhibit 78: Data Table on Rest of World (ROW) - Market size and forecast 2022-2027 ($ million)
Exhibit 79: Chart on Rest of World (ROW) - Year-over-year growth 2022-2027 (%)
Exhibit 80: Data Table on Rest of World (ROW) - Year-over-year growth 2022-2027 (%)
9.7 US - Market size and forecast 2022-2027
Exhibit 81: Chart on US - Market size and forecast 2022-2027 ($ million)
Exhibit 82: Data Table on US - Market size and forecast 2022-2027 ($ million)
Exhibit 83: Chart on US - Year-over-year growth 2022-2027 (%)
Exhibit 84: Data Table on US - Year-over-year growth 2022-2027 (%)
9.8 Germany - Market size and forecast 2022-2027
Exhibit 85: Chart on Germany - Market size and forecast 2022-2027 ($ million)
Exhibit 86: Data Table on Germany - Market size and forecast 2022-2027 ($ million)
Exhibit 87: Chart on Germany - Year-over-year growth 2022-2027 (%)
Exhibit 88: Data Table on Germany - Year-over-year growth 2022-2027 (%)
9.9 UK - Market size and forecast 2022-2027
Exhibit 89: Chart on UK - Market size and forecast 2022-2027 ($ million)
Exhibit 90: Data Table on UK - Market size and forecast 2022-2027 ($ million)
Exhibit 91: Chart on UK - Year-over-year growth 2022-2027 (%)
Exhibit 92: Data Table on UK - Year-over-year growth 2022-2027 (%)
9.10 China - Market size and forecast 2022-2027
Exhibit 93: Chart on China - Market size and forecast 2022-2027 ($ million)
Exhibit 94: Data Table on China - Market size and forecast 2022-2027 ($ million)
Exhibit 95: Chart on China - Year-over-year growth 2022-2027 (%)
Exhibit 96: Data Table on China - Year-over-year growth 2022-2027 (%)
9.11 Japan - Market size and forecast 2022-2027
Exhibit 97: Chart on Japan - Market size and forecast 2022-2027 ($ million)
Exhibit 98: Data Table on Japan - Market size and forecast 2022-2027 ($ million)
Exhibit 99: Chart on Japan - Year-over-year growth 2022-2027 (%)
Exhibit 100: Data Table on Japan - Year-over-year growth 2022-2027 (%)
9.12 Market opportunity by geography
Exhibit 101: Market opportunity by geography ($ million)
10 Drivers, Challenges, and Trends
10.1 Market drivers
10.2 Market challenges
10.3 Impact of drivers and challenges
Exhibit 102: Impact of drivers and challenges in 2022 and 2027
10.4 Market trends
11 Vendor Landscape
11.1 Overview
11.2 Vendor landscape
Exhibit 103: Overview on Criticality of inputs and Factors of differentiation
11.3 Landscape disruption
Exhibit 104: Overview on factors of disruption
11.4 Industry risks
Exhibit 105: Impact of key risks on business
12 Vendor Analysis
12.1 Vendors covered
Exhibit 106: Vendors covered
12.2 Market positioning of vendors
Exhibit 107: Matrix on vendor position and classification
12.3 Advanced Brain Monitoring Inc.
Exhibit 108: Advanced Brain Monitoring Inc. - Overview
Exhibit 109: Advanced Brain Monitoring Inc. - Product / Service
Exhibit 110: Advanced Brain Monitoring Inc. - Key offerings
Exhibit 111: Boston Scientific Corp. - Overview
Exhibit 112: Boston Scientific Corp. - Business segments
Exhibit 113: Boston Scientific Corp. - Key news
Exhibit 114: Boston Scientific Corp. - Key offerings
Exhibit 115: Boston Scientific Corp. - Segment focus
12.5 BrainScope Co. Inc.
Exhibit 116: BrainScope Co. Inc. - Overview
Exhibit 117: BrainScope Co. Inc. - Product / Service
Exhibit 118: BrainScope Co. Inc. - Key offerings
12.6 Canon Inc.
Exhibit 119: Canon Inc. - Overview
Exhibit 120: Canon Inc. - Business segments
Exhibit 121: Canon Inc. - Key offerings
Exhibit 122: Canon Inc. - Segment focus
12.7 Compumedics Ltd.
Exhibit 123: Compumedics Ltd. - Overview
Exhibit 124: Compumedics Ltd. - Product / Service
Exhibit 125: Compumedics Ltd. - Key offerings
12.8 Elekta AB
Exhibit 126: Elekta AB - Overview
Exhibit 127: Elekta AB - Business segments
Exhibit 128: Elekta AB - Key news
Exhibit 129: Elekta AB - Key offerings
Exhibit 130: Elekta AB - Segment focus
12.9 General Electric Co.
Exhibit 131: General Electric Co. - Overview
Exhibit 132: General Electric Co. - Business segments
Exhibit 133: General Electric Co. - Key news
Exhibit 134: General Electric Co. - Key offerings
Exhibit 135: General Electric Co. - Segment focus
12.10 InfraScan Inc.
Exhibit 136: InfraScan Inc. - Overview
Exhibit 137: InfraScan Inc. - Product / Service
Exhibit 138: InfraScan Inc. - Key offerings
Exhibit 139: Integra Lifesciences Holdings Corp. - Overview
Exhibit 140: Integra Lifesciences Holdings Corp. - Business segments
Exhibit 141: Integra Lifesciences Holdings Corp. - Key news
Exhibit 142: Integra Lifesciences Holdings Corp. - Key offerings
Exhibit 143: Integra Lifesciences Holdings Corp. - Segment focus
12.12 Koninklijke Philips NV
Exhibit 144: Koninklijke Philips NV - Overview
Exhibit 145: Koninklijke Philips NV - Business segments
Exhibit 146: Koninklijke Philips NV - Key news
Exhibit 147: Koninklijke Philips NV - Key offerings
Exhibit 148: Koninklijke Philips NV - Segment focus
12.13 NanoDx Inc.
Exhibit 149: NanoDx Inc. - Overview
Exhibit 150: NanoDx Inc. - Product / Service
Exhibit 151: NanoDx Inc. - Key offerings
12.14 Natus Medical Inc.
Exhibit 152: Natus Medical Inc. - Overview
Exhibit 153: Natus Medical Inc. - Product / Service
Exhibit 154: Natus Medical Inc. - Key news
Exhibit 155: Natus Medical Inc. - Key offerings
12.15 Nihon Kohden Corp.
Exhibit 156: Nihon Kohden Corp. - Overview
Exhibit 157: Nihon Kohden Corp. - Product / Service
Exhibit 158: Nihon Kohden Corp. - Key news
Exhibit 159: Nihon Kohden Corp. - Key offerings
12.16 NovaSignal Corp.
Exhibit 160: NovaSignal Corp. - Overview
Exhibit 161: NovaSignal Corp. - Product / Service
Exhibit 162: NovaSignal Corp. - Key offerings
12.17 RAUMEDIC AG
Exhibit 163: RAUMEDIC AG - Overview
Exhibit 164: RAUMEDIC AG - Product / Service
Exhibit 165: RAUMEDIC AG - Key offerings
13 Appendix
13.1 Scope of the report
13.2 Inclusions and exclusions checklist
Exhibit 166: Inclusions checklist
Exhibit 167: Exclusions checklist
13.3 Currency conversion rates for US$
Exhibit 168: Currency conversion rates for US$
13.4 Research methodology
Exhibit 169: Research methodology
Exhibit 170: Validation techniques employed for market sizing
Exhibit 171: Information sources
13.5 List of abbreviations
Exhibit 172: List of abbreviations
About Us
Technavio is a leading global technology research and advisory company. Their research and analysis focus on emerging market trends and provide actionable insights to help businesses identify market opportunities and develop effective strategies to optimize their market positions. With over 500 specialized analysts, Technavio's report library consists of more than 17,000 reports and counting, covering 800 technologies, spanning 50 countries. Their client base consists of enterprises of all sizes, including more than 100 Fortune 500 companies. This growing client base relies on Technavio's comprehensive coverage, extensive research, and actionable market insights to identify opportunities in existing and potential markets and assess their competitive positions within changing market scenarios.
Contact
Technavio Research
Jesse Maida
Media & Marketing Executive
US: +1 844 364 1100
UK: +44 203 893 3200
Email: [email protected]
Website: www.technavio.com/
SOURCE Technavio
For more details,please visit the original website
The content of the article does not represent any opinions of Synapse and its affiliated companies. If there is any copyright infringement or error, please contact us, and we will deal with it within 24 hours.
Organizations
Indications
Targets
-Drugs
-Hot reports


Get started for free today!
Accelerate Strategic R&D decision making with Synapse, PatSnap’s AI-powered Connected Innovation Intelligence Platform Built for Life Sciences Professionals.
Start your data trial now!
Synapse data is also accessible to external entities via APIs or data packages. Leverages most recent intelligence information, enabling fullest potential.