7% of the Growth of Disposable Respiratory Masks Market to Originate from Rest of World (ROW) | Technavio
10 Jun 2022
This report analyzes the disposable respiratory masks market by product (facemasks and LMA) and geography (North America, Europe, Asia, and Rest of World (ROW))
NEW YORK, June 10, 2022 /PRNewswire/ -- One of the key trends in the disposable respiratory masks market will be a
focus on improvements in materials used and the design of disposable respiratory masks. The demand for respiratory masks has increased across the world since the outbreak of COVID-19. Vendors are launching new products with improved materials and design to provide high safety and efficacy.
Preview
Source: PRNewswire
Technavio has announced its latest market research report titled Disposable Respiratory Masks Market by Product and Geography - Forecast and Analysis 2022-2026
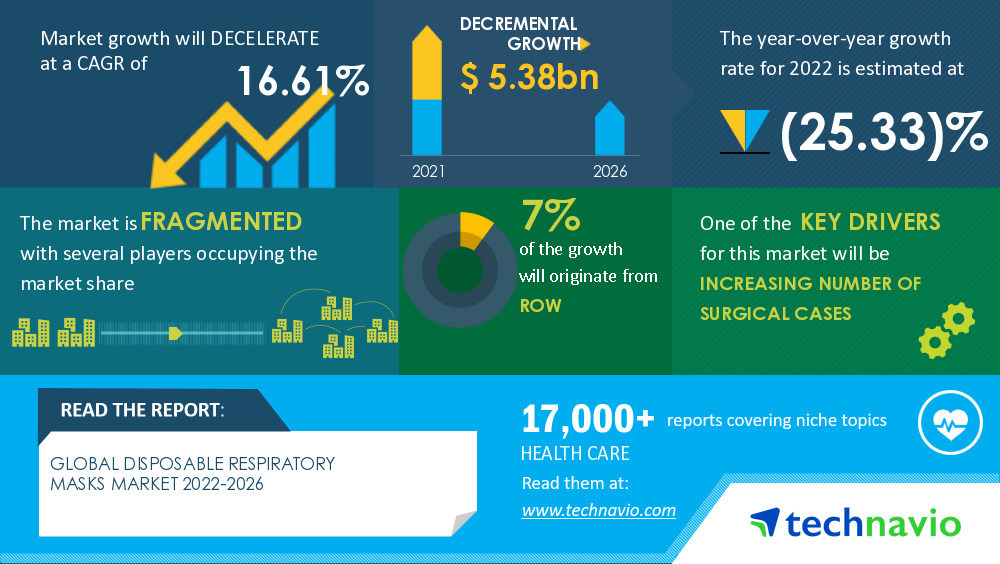
The global disposable respiratory masks market size is expected to decline by USD 5.38 bn from 2021 to 2026. Moreover, the growth momentum of the market will decelerate at a CAGR of 16.61% during the forecast period, according to Technavio's latest market report.
Download a Sample Report
to learn about additional highlights related to the market
Disposable Respiratory Masks Market: Market Segmentation
By product, the
facemasks segment will have significant market share growth during the forecast period. With the rise in awareness about hospital-acquired infections (HAI), the demand for respiratory facemasks is expected to increase during the forecast period. This will drive the growth of the disposable respiratory masks market.
By geography, Rest of World (ROW) will account for 7% of the market's growth during the forecast period. The growth of this region to attributed to factors such as the growth of the aging population. Moreover, market growth in this region will be faster than the growth of the market in other regions.
Disposable Respiratory Masks Market: Major Growth Drivers
The
increasing number of surgical cases is driving the disposable respiratory masks market growth. Chronic conditions are increasing drastically, which is resulting in a rise in the number of surgical procedures. Disposable respiratory masks are recommended for surgeons and nurses during surgical procedures to prevent HAIs.
Gain more insights into the global trends impacting the future of the disposable respiratory masks market.
View our Sample Report
Disposable Respiratory Masks Market: Key Vendor Analysis
The disposable respiratory masks market is fragmented. Vendors are deploying growth strategies such as M&A and joint ventures, product launches, online and brick-and-mortar sales of products, expansion of product portfolio, and geographical reach to compete in the market.
Some of the key vendors operating in the market include 3M Corp., Ambu AS, Cardinal Health Inc., Cartel Healthcare Pvt. Ltd., Hafele America Co., Hans Rudolph Inc., Honeywell International Inc., Innosparks Pte. Ltd., JSP Ltd., Louis M. Gerson Co. Inc., Mallcom India Ltd., Moldex-Metric Inc., Novo Klinik-Service GmbH, Parcil Safety, Protective Industrial Products Inc., ResMed Inc., Salus Products, SHIGEMATSU WORKS Co. Ltd., Thermo Fisher Scientific Inc., and W.W. Grainger Inc. among others.
Reasons to Buy Disposable Respiratory Masks Market Report:
CAGR of the market during the forecast period 2022-2026
Detailed information on factors that will assist disposable respiratory masks market growth during the next five years
Estimation of the disposable respiratory masks market size and its contribution to the parent market
Predictions on upcoming trends and changes in consumer behavior
The growth of the disposable respiratory masks market across North America, Europe, Asia, and Rest of World (ROW)
Analysis of the market's competitive landscape and detailed information on vendors
Comprehensive details of factors that will challenge the growth of disposable respiratory masks market vendors
Our insights and analysis can help your business reach its potential.
Request a Sample Report
Related Reports
Medical Disposable Gloves Market by Product and Geography - Forecast and Analysis 2022-2026
Laboratory Disposables Market by End-user and Geography - Forecast and Analysis 2022-2026
Table of Contents
1 Executive Summary
1.1 Market overview
Exhibit 01: Executive Summary – Chart on Market Overview
Exhibit 02: Executive Summary – Data Table on Market Overview
Exhibit 03: Executive Summary – Chart on Global Market Characteristics
Exhibit 04: Executive Summary – Chart on Market by Geography
Exhibit 05: Executive Summary – Chart on Market Segmentation by Product
Exhibit 06: Executive Summary – Chart on Incremental Growth
Exhibit 07: Executive Summary – Data Table on Incremental Growth
Exhibit 08: Executive Summary – Chart on Vendor Market Positioning
2 Market Landscape
2.1 Market ecosystem
Exhibit 09: Parent market
Exhibit 10: Market Characteristics
3 Market Sizing
3.1 Market definition
Exhibit 11: Offerings of vendors included in the market definition
3.2 Market segment analysis
Exhibit 12: Market segments
3.3 Market size 2021
3.4 Market outlook: Forecast for 2021-2026
Exhibit 13: Chart on Global - Market size and forecast 2021-2026 ($ million)
Exhibit 14: Data Table on Global - Market size and forecast 2021-2026 ($ million)
Exhibit 15: Chart on Global Market: Year-over-year growth 2021-2026 (%)
Exhibit 16: Data Table on Global Market: Year-over-year growth 2021-2026 (%)
4 Five Forces Analysis
4.1 Five forces summary
Exhibit 17: Five forces analysis - Comparison between2021 and 2026
4.2 Bargaining power of buyers
Exhibit 18: Chart on Bargaining power of buyers – Impact of key factors 2021 and 2026
4.3 Bargaining power of suppliers
Exhibit 19: Bargaining power of suppliers – Impact of key factors in 2021 and 2026
4.4 Threat of new entrants
Exhibit 20: Threat of new entrants – Impact of key factors in 2021 and 2026
4.5 Threat of substitutes
Exhibit 21: Threat of substitutes – Impact of key factors in 2021 and 2026
4.6 Threat of rivalry
Exhibit 22: Threat of rivalry – Impact of key factors in 2021 and 2026
4.7 Market condition
Exhibit 23: Chart on Market condition - Five forces 2021 and 2026
5 Market Segmentation by Product
5.1 Market segments
Exhibit 24: Chart on Product - Market share 2021-2026 (%)
Exhibit 25: Data Table on Product - Market share 2021-2026 (%)
5.2 Comparison by Product
Exhibit 26: Chart on Comparison by Product
Exhibit 27: Data Table on Comparison by Product
5.3 Facemasks - Market size and forecast 2021-2026
Exhibit 28: Chart on Facemasks - Market size and forecast 2021-2026 ($ million)
Exhibit 29: Data Table on Facemasks - Market size and forecast 2021-2026 ($ million)
Exhibit 30: Chart on Facemasks - Year-over-year growth 2021-2026 (%)
Exhibit 31: Data Table on Facemasks - Year-over-year growth 2021-2026 (%)
5.4 LMA - Market size and forecast 2021-2026
Exhibit 32: Chart on LMA - Market size and forecast 2021-2026 ($ million)
Exhibit 33: Data Table on LMA - Market size and forecast 2021-2026 ($ million)
Exhibit 34: Chart on LMA - Year-over-year growth 2021-2026 (%)
Exhibit 35: Data Table on LMA - Year-over-year growth 2021-2026 (%)
5.5 Market opportunity by Product
Exhibit 36: Market opportunity by Product ($ million)
6 Customer Landscape
6.1 Customer landscape overview
Exhibit 37: Analysis of price sensitivity, lifecycle, customer purchase basket, adoption rates, and purchase criteria
7 Geographic Landscape
7.1 Geographic segmentation
Exhibit 38: Chart on Market share by geography 2021-2026 (%)
Exhibit 39: Data Table on Market share by geography 2021-2026 (%)
7.2 Geographic comparison
Exhibit 40: Chart on Geographic comparison
Exhibit 41: Data Table on Geographic comparison
7.3 North America - Market size and forecast 2021-2026
Exhibit 42: Chart on North America - Market size and forecast 2021-2026 ($ million)
Exhibit 43: Data Table on North America - Market size and forecast 2021-2026 ($ million)
Exhibit 44: Chart on North America - Year-over-year growth 2021-2026 (%)
Exhibit 45: Data Table on North America - Year-over-year growth 2021-2026 (%)
7.4 Europe - Market size and forecast 2021-2026
Exhibit 46: Chart on Europe - Market size and forecast 2021-2026 ($ million)
Exhibit 47: Data Table on Europe - Market size and forecast 2021-2026 ($ million)
Exhibit 48: Chart on Europe - Year-over-year growth 2021-2026 (%)
Exhibit 49: Data Table on Europe - Year-over-year growth 2021-2026 (%)
7.5 Asia - Market size and forecast 2021-2026
Exhibit 50: Chart on Asia - Market size and forecast 2021-2026 ($ million)
Exhibit 51: Data Table on Asia - Market size and forecast 2021-2026 ($ million)
Exhibit 52: Chart on Asia - Year-over-year growth 2021-2026 (%)
Exhibit 53: Data Table on Asia - Year-over-year growth 2021-2026 (%)
7.6 Rest of World (ROW) - Market size and forecast 2021-2026
Exhibit 54: Chart on Rest of World (ROW) - Market size and forecast 2021-2026 ($ million)
Exhibit 55: Data Table on Rest of World (ROW) - Market size and forecast 2021-2026 ($ million)
Exhibit 56: Chart on Rest of World (ROW) - Year-over-year growth 2021-2026 (%)
Exhibit 57: Data Table on Rest of World (ROW) - Year-over-year growth 2021-2026 (%)
7.7 US - Market size and forecast 2021-2026
Exhibit 58: Chart on US - Market size and forecast 2021-2026 ($ million)
Exhibit 59: Data Table on US - Market size and forecast 2021-2026 ($ million)
Exhibit 60: Chart on US - Year-over-year growth 2021-2026 (%)
Exhibit 61: Data Table on US - Year-over-year growth 2021-2026 (%)
7.8 Germany - Market size and forecast 2021-2026
Exhibit 62: Chart on Germany - Market size and forecast 2021-2026 ($ million)
Exhibit 63: Data Table on Germany - Market size and forecast 2021-2026 ($ million)
Exhibit 64: Chart on Germany - Year-over-year growth 2021-2026 (%)
Exhibit 65: Data Table on Germany - Year-over-year growth 2021-2026 (%)
7.9 China - Market size and forecast 2021-2026
Exhibit 66: Chart on China - Market size and forecast 2021-2026 ($ million)
Exhibit 67: Data Table on China - Market size and forecast 2021-2026 ($ million)
Exhibit 68: Chart on China - Year-over-year growth 2021-2026 (%)
Exhibit 69: Data Table on China - Year-over-year growth 2021-2026 (%)
7.10 UK - Market size and forecast 2021-2026
Exhibit 70: Chart on UK - Market size and forecast 2021-2026 ($ million)
Exhibit 71: Data Table on UK - Market size and forecast 2021-2026 ($ million)
Exhibit 72: Chart on UK - Year-over-year growth 2021-2026 (%)
Exhibit 73: Data Table on UK - Year-over-year growth 2021-2026 (%)
7.11 India - Market size and forecast 2021-2026
Exhibit 74: Chart on India - Market size and forecast 2021-2026 ($ million)
Exhibit 75: Data Table on India - Market size and forecast 2021-2026 ($ million)
Exhibit 76: Chart on India - Year-over-year growth 2021-2026 (%)
Exhibit 77: Data Table on India - Year-over-year growth 2021-2026 (%)
7.12 Market opportunity by geography
Exhibit 78: Market opportunity by geography ($ million)
8 Drivers, Challenges, and Trends
8.1 Market drivers
8.2 Market challenges
8.3 Impact of drivers and challenges
Exhibit 79: Impact of drivers and challenges in 2021 and 2026
8.4 Market trends
9 Vendor Landscape
9.1 Overview
9.2 Vendor landscape
Exhibit 80: Overview on Criticality of inputs and Factors of differentiation
9.3 Landscape disruption
Exhibit 81: Overview on factors of disruption
9.4 Industry risks
Exhibit 82: Impact of key risks on business
10 Vendor Analysis
10.1 Vendors covered
Exhibit 83: Vendors covered
10.2 Market positioning of vendors
Exhibit 84: Matrix on vendor position and classification
10.3 3M Corp.
Exhibit 85: 3M Corp. - Overview
Exhibit 86: 3M Corp. - Business segments
Exhibit 87: 3M Corp. - Key news
Exhibit 88: 3M Corp. - Key offerings
Exhibit 89: 3M Corp. - Segment focus
10.4 Ambu AS
Exhibit 90: Ambu AS - Overview
Exhibit 91: Ambu AS - Business segments
Exhibit 92: Ambu AS - Key offerings
Exhibit 93: Ambu AS - Segment focus
10.5 Cardinal Health Inc.
Exhibit 94: Cardinal Health Inc. - Overview
Exhibit 95: Cardinal Health Inc. - Business segments
Exhibit 96: Cardinal Health Inc. - Key news
Exhibit 97: Cardinal Health Inc. - Key offerings
Exhibit 98: Cardinal Health Inc. - Segment focus
10.6 Cartel Healthcare Pvt. Ltd.
Exhibit 99: Cartel Healthcare Pvt. Ltd. - Overview
Exhibit 100: Cartel Healthcare Pvt. Ltd. - Product / Service
Exhibit 101: Cartel Healthcare Pvt. Ltd. - Key offerings
10.7 Hafele America Co.
Exhibit 102: Hafele America Co. - Overview
Exhibit 103: Hafele America Co. - Product / Service
Exhibit 104: Hafele America Co. - Key offerings
Exhibit 105: Honeywell International Inc. - Overview
Exhibit 106: Honeywell International Inc. - Business segments
Exhibit 107: Honeywell International Inc. - Key news
Exhibit 108: Honeywell International Inc. - Key offerings
Exhibit 109: Honeywell International Inc. - Segment focus
10.9 Moldex-Metric Inc.
Exhibit 110: Moldex-Metric Inc. - Overview
Exhibit 111: Moldex-Metric Inc. - Product / Service
Exhibit 112: Moldex-Metric Inc. - Key offerings
10.10 ResMed Inc.
Exhibit 113: ResMed Inc. - Overview
Exhibit 114: ResMed Inc. - Business segments
Exhibit 115: ResMed Inc. - Key news
Exhibit 116: ResMed Inc. - Key offerings
Exhibit 117: ResMed Inc. - Segment focus
10.11 SHIGEMATSU WORKS Co. Ltd.
Exhibit 118: SHIGEMATSU WORKS Co. Ltd. - Overview
Exhibit 119: SHIGEMATSU WORKS Co. Ltd. - Product / Service
Exhibit 120: SHIGEMATSU WORKS Co. Ltd. - Key offerings
Exhibit 121: Thermo Fisher Scientific Inc. - Overview
Exhibit 122: Thermo Fisher Scientific Inc. - Business segments
Exhibit 123: Thermo Fisher Scientific Inc. - Key news
Exhibit 124: Thermo Fisher Scientific Inc. - Key offerings
Exhibit 125: Thermo Fisher Scientific Inc. - Segment focus
11.1 Scope of the report
11.2 Inclusions and exclusions checklist
Exhibit 126: Inclusions checklist
Exhibit 127: Exclusions checklist
11.3 Currency conversion rates for US$
Exhibit 128: Currency conversion rates for US$
11.4 Research methodology
Exhibit 129: Research methodology
Exhibit 130: Validation techniques employed for market sizing
Exhibit 131: Information sources
11.5 List of abbreviations
Exhibit 132: List of abbreviations
About Us
Technavio is a leading global technology research and advisory company. Their research and analysis focus on emerging market trends and provide actionable insights to help businesses identify market opportunities and develop effective strategies to optimize their market positions. With over 500 specialized analysts, Technavio's report library consists of more than 17,000 reports and counting, covering 800 technologies, spanning across 50 countries. Their client base consists of enterprises of all sizes, including more than 100 Fortune 500 companies. This growing client base relies on Technavio's comprehensive coverage, extensive research, and actionable market insights to identify opportunities in existing and potential markets and assess their competitive positions within changing market scenarios.
Contact
Technavio Research
Jesse Maida
US: +1 844 364 1100
UK: +44 203 893 3200
Email: [email protected]
Website: www.technavio.com/
SOURCE Technavio
For more details,please visit the original website
The content of the article does not represent any opinions of Synapse and its affiliated companies. If there is any copyright infringement or error, please contact us, and we will deal with it within 24 hours.
Organizations
Indications
Targets
-Drugs
-Hot reports


Get started for free today!
Accelerate Strategic R&D decision making with Synapse, PatSnap’s AI-powered Connected Innovation Intelligence Platform Built for Life Sciences Professionals.
Start your data trial now!
Synapse data is also accessible to external entities via APIs or data packages. Leverages most recent intelligence information, enabling fullest potential.