Medical Injection Molding Machines Market to grow by USD 580.96 Mn; Plastics segment to generate maximum revenue - Technavio
14 Nov 2022
NEW YORK, Nov. 14, 2022 /PRNewswire/ -- The "
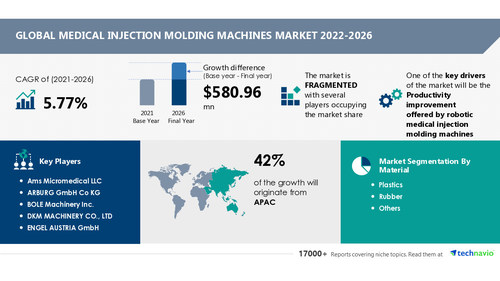
Medical Injection Molding Machines Market by Material and Geography - Forecast and Analysis 2022-2026" report has been added to Technavio's offering. The report expects the market size to grow by USD 580.96 million, accelerating at a CAGR of 5.77% during the forecast period. The medical injection molding machines market report offers a comprehensive analysis of the strategies adopted by vendors and the trends, drivers, and challenges affecting the market size.
Download a Free Sample Report Now
Continue Reading
Preview
Source: PRNewswire
Technavio has announced its latest market research report titled Global Medical Injection Molding Machines Market 2022-2026
This report presents a detailed picture of the market through study, synthesis, and summation of data from multiple sources by analyzing key parameters. The report identifies productivity improvement offered by robotic medical injection molding machines as one of the major factors driving the growth of the market. The increased use of cobots in the injection molding process will also be crucial in fueling the growth of the market over the forecast period.
The medical injection molding machines market covers the following areas:
Medical Injection Molding Machines Market Sizing
Medical Injection Molding Machines Market Forecast
Medical Injection Molding Machines Market Analysis
Major Revenue-generating Segment
By material, the market is analyzed across segments such as plastics, rubber, and others. The market growth will be significant in the plastics segment during the forecast period. The plastic medical injection molding technique is mainly used to produce rigid plastic products. Polypropylene, acrylonitrile butadiene styrene, and high-density polyethylene are some major materials used to produce plastic medical injection molding machines. Factors such as the low cost, compatibility, and flexibility of these materials make them suitable for packaging applications. This, in turn, is driving the growth of the segment.
Discover Industrial Machinery industry potential and make informed business decisions based on qualitative and quantitative evidence highlighted in Technavio reports. Request a Free Sample Report
Key Vendors Covered
Ams Micromedical LLC: The company offers medical injection molding machines with technologies such as wire EDM with rotary axis and deep hole micro drilling.
ARBURG GmbH Co KG: The company offers medical injection molding machines such as Allrounder injection molding machines.
ENGEL AUSTRIA GmbH: The company offers medical injection molding machines such as victory, duo, duo speed, and flexseal.
HARBEC: The company offers medical injection molding machines to produce components such as blood pressure cuffs and hoses, IV components, dialysis components, reagent closures, and spinal implants.
Hillenbrand Inc.: The company through its subsidiary offers medical injection molding machines such as powerpak, roboshot, q series, and c series.
BOLE Machinery Inc.
DKM MACHINERY CO., LTD
Haitian International Holdings Ltd.
Gain access to more vendor profiles available with Technavio. Buy Now!
Technavio's library includes over 17,000+ reports covering more than 2,000 emerging technologies. Subscribe to our "Basic Plan" at just USD 5,000 and get lifetime access to our Technavio Insights
Related Reports:
The
thermoplastic micro molding market share is expected to increase by USD 804.31 million from 2021 to 2026, and the market's growth momentum will accelerate at a CAGR of 13.62%. The strong demand from the automotive industry is notably driving the thermoplastic micro molding market growth, although factors such as the increasing disparity between demand and supply may impede the market growth.
The
blow molding machinery market is projected to grow by USD 994.14 million with a CAGR of 4.21% during the forecast period 2021 to 2026. The growth of the e-commerce industry is one of the key factors driving the blow molding machinery market growth.
Key Topics Covered:
1 Executive Summary
1.1 Market overview
Exhibit 01: Executive Summary – Chart on Market Overview
Exhibit 02: Executive Summary – Data Table on Market Overview
Exhibit 03: Executive Summary – Chart on Global Market Characteristics
Exhibit 04: Executive Summary – Chart on Market by Geography
Exhibit 05: Executive Summary – Chart on Market Segmentation by Material
Exhibit 06: Executive Summary – Chart on Incremental Growth
Exhibit 07: Executive Summary – Data Table on Incremental Growth
Exhibit 08: Executive Summary – Chart on Vendor Market Positioning
2 Market Landscape
2.1 Market ecosystem
Exhibit 09: Parent market
Exhibit 10: Market Characteristics
3 Market Sizing
3.1 Market definition
Exhibit 11: Offerings of vendors included in the market definition
3.2 Market segment analysis
Exhibit 12: Market segments
3.3 Market size 2021
3.4 Market outlook: Forecast for 2021-2026
Exhibit 13: Chart on Global - Market size and forecast 2021-2026 ($ million)
Exhibit 14: Data Table on Global - Market size and forecast 2021-2026 ($ million)
Exhibit 15: Chart on Global Market: Year-over-year growth 2021-2026 (%)
Exhibit 16: Data Table on Global Market: Year-over-year growth 2021-2026 (%)
4 Five Forces Analysis
4.1 Five forces summary
Exhibit 17: Five forces analysis - Comparison between 2021 and 2026
4.2 Bargaining power of buyers
Exhibit 18: Chart on Bargaining power of buyers – Impact of key factors 2021 and 2026
4.3 Bargaining power of suppliers
Exhibit 19: Bargaining power of suppliers – Impact of key factors in 2021 and 2026
4.4 Threat of new entrants
Exhibit 20: Threat of new entrants – Impact of key factors in 2021 and 2026
4.5 Threat of substitutes
Exhibit 21: Threat of substitutes – Impact of key factors in 2021 and 2026
4.6 Threat of rivalry
Exhibit 22: Threat of rivalry – Impact of key factors in 2021 and 2026
4.7 Market condition
Exhibit 23: Chart on Market condition - Five forces 2021 and 2026
5 Market Segmentation by Material
5.1 Market segments
Exhibit 24: Chart on Material - Market share 2021-2026 (%)
Exhibit 25: Data Table on Material - Market share 2021-2026 (%)
5.2 Comparison by Material
Exhibit 26: Chart on Comparison by Material
Exhibit 27: Data Table on Comparison by Material
5.3 Plastics - Market size and forecast 2021-2026
Exhibit 28: Chart on Plastics - Market size and forecast 2021-2026 ($ million)
Exhibit 29: Data Table on Plastics - Market size and forecast 2021-2026 ($ million)
Exhibit 30: Chart on Plastics - Year-over-year growth 2021-2026 (%)
Exhibit 31: Data Table on Plastics - Year-over-year growth 2021-2026 (%)
5.4 Rubber - Market size and forecast 2021-2026
Exhibit 32: Chart on Rubber - Market size and forecast 2021-2026 ($ million)
Exhibit 33: Data Table on Rubber - Market size and forecast 2021-2026 ($ million)
Exhibit 34: Chart on Rubber - Year-over-year growth 2021-2026 (%)
Exhibit 35: Data Table on Rubber - Year-over-year growth 2021-2026 (%)
5.5 Others - Market size and forecast 2021-2026
Exhibit 36: Chart on Others - Market size and forecast 2021-2026 ($ million)
Exhibit 37: Data Table on Others - Market size and forecast 2021-2026 ($ million)
Exhibit 38: Chart on Others - Year-over-year growth 2021-2026 (%)
Exhibit 39: Data Table on Others - Year-over-year growth 2021-2026 (%)
5.6 Market opportunity by Material
Exhibit 40: Market opportunity by Material ($ million)
6 Customer Landscape
6.1 Customer landscape overview
Exhibit 41: Analysis of price sensitivity, lifecycle, customer purchase basket, adoption rates, and purchase criteria
7 Geographic Landscape
7.1 Geographic segmentation
Exhibit 42: Chart on Market share by geography 2021-2026 (%)
Exhibit 43: Data Table on Market share by geography 2021-2026 (%)
7.2 Geographic comparison
Exhibit 44: Chart on Geographic comparison
Exhibit 45: Data Table on Geographic comparison
7.3 APAC - Market size and forecast 2021-2026
Exhibit 46: Chart on APAC - Market size and forecast 2021-2026 ($ million)
Exhibit 47: Data Table on APAC - Market size and forecast 2021-2026 ($ million)
Exhibit 48: Chart on APAC - Year-over-year growth 2021-2026 (%)
Exhibit 49: Data Table on APAC - Year-over-year growth 2021-2026 (%)
7.4 North America - Market size and forecast 2021-2026
Exhibit 50: Chart on North America - Market size and forecast 2021-2026 ($ million)
Exhibit 51: Data Table on North America - Market size and forecast 2021-2026 ($ million)
Exhibit 52: Chart on North America - Year-over-year growth 2021-2026 (%)
Exhibit 53: Data Table on North America - Year-over-year growth 2021-2026 (%)
7.5 Europe - Market size and forecast 2021-2026
Exhibit 54: Chart on Europe - Market size and forecast 2021-2026 ($ million)
Exhibit 55: Data Table on Europe - Market size and forecast 2021-2026 ($ million)
Exhibit 56: Chart on Europe - Year-over-year growth 2021-2026 (%)
Exhibit 57: Data Table on Europe - Year-over-year growth 2021-2026 (%)
7.6 South America - Market size and forecast 2021-2026
Exhibit 58: Chart on South America - Market size and forecast 2021-2026 ($ million)
Exhibit 59: Data Table on South America - Market size and forecast 2021-2026 ($ million)
Exhibit 60: Chart on South America - Year-over-year growth 2021-2026 (%)
Exhibit 61: Data Table on South America - Year-over-year growth 2021-2026 (%)
7.7 Middle East and Africa - Market size and forecast 2021-2026
Exhibit 62: Chart on Middle East and Africa - Market size and forecast 2021-2026 ($ million)
Exhibit 63: Data Table on Middle East and Africa - Market size and forecast 2021-2026 ($ million)
Exhibit 64: Chart on Middle East and Africa - Year-over-year growth 2021-2026 (%)
Exhibit 65: Data Table on Middle East and Africa - Year-over-year growth 2021-2026 (%)
7.8 US - Market size and forecast 2021-2026
Exhibit 66: Chart on US - Market size and forecast 2021-2026 ($ million)
Exhibit 67: Data Table on US - Market size and forecast 2021-2026 ($ million)
Exhibit 68: Chart on US - Year-over-year growth 2021-2026 (%)
Exhibit 69: Data Table on US - Year-over-year growth 2021-2026 (%)
7.9 China - Market size and forecast 2021-2026
Exhibit 70: Chart on China - Market size and forecast 2021-2026 ($ million)
Exhibit 71: Data Table on China - Market size and forecast 2021-2026 ($ million)
Exhibit 72: Chart on China - Year-over-year growth 2021-2026 (%)
Exhibit 73: Data Table on China - Year-over-year growth 2021-2026 (%)
7.10 Japan - Market size and forecast 2021-2026
Exhibit 74: Chart on Japan - Market size and forecast 2021-2026 ($ million)
Exhibit 75: Data Table on Japan - Market size and forecast 2021-2026 ($ million)
Exhibit 76: Chart on Japan - Year-over-year growth 2021-2026 (%)
Exhibit 77: Data Table on Japan - Year-over-year growth 2021-2026 (%)
7.11 Germany - Market size and forecast 2021-2026
Exhibit 78: Chart on Germany - Market size and forecast 2021-2026 ($ million)
Exhibit 79: Data Table on Germany - Market size and forecast 2021-2026 ($ million)
Exhibit 80: Chart on Germany - Year-over-year growth 2021-2026 (%)
Exhibit 81: Data Table on Germany - Year-over-year growth 2021-2026 (%)
7.12 India - Market size and forecast 2021-2026
Exhibit 82: Chart on India - Market size and forecast 2021-2026 ($ million)
Exhibit 83: Data Table on India - Market size and forecast 2021-2026 ($ million)
Exhibit 84: Chart on India - Year-over-year growth 2021-2026 (%)
Exhibit 85: Data Table on India - Year-over-year growth 2021-2026 (%)
7.13 Market opportunity by geography
Exhibit 86: Market opportunity by geography ($ million)
8 Drivers, Challenges, and Trends
8.1 Market drivers
8.2 Market challenges
8.3 Impact of drivers and challenges
Exhibit 87: Impact of drivers and challenges in 2021 and 2026
8.4 Market trends
9 Vendor Landscape
9.1 Overview
9.2 Vendor landscape
Exhibit 88: Overview on Criticality of inputs and Factors of differentiation
9.3 Landscape disruption
Exhibit 89: Overview on factors of disruption
9.4 Industry risks
Exhibit 90: Impact of key risks on business
10 Vendor Analysis
10.1 Vendors covered
Exhibit 91: Vendors covered
10.2 Market positioning of vendors
Exhibit 92: Matrix on vendor position and classification
10.3 Ams Micromedical LLC
Exhibit 93: Ams Micromedical LLC - Overview
Exhibit 94: Ams Micromedical LLC - Product / Service
Exhibit 95: Ams Micromedical LLC - Key offerings
10.4 ARBURG GmbH Co KG
Exhibit 96: ARBURG GmbH Co KG - Overview
Exhibit 97: ARBURG GmbH Co KG - Product / Service
Exhibit 98: ARBURG GmbH Co KG - Key offerings
10.5 ENGEL AUSTRIA GmbH
Exhibit 99: ENGEL AUSTRIA GmbH - Overview
Exhibit 100: ENGEL AUSTRIA GmbH - Product / Service
Exhibit 101: ENGEL AUSTRIA GmbH - Key offerings
10.6 HARBEC
Exhibit 102: HARBEC - Overview
Exhibit 103: HARBEC - Product / Service
Exhibit 104: HARBEC - Key offerings
10.7 Hillenbrand Inc.
Exhibit 105: Hillenbrand Inc. - Overview
Exhibit 106: Hillenbrand Inc. - Business segments
Exhibit 107: Hillenbrand Inc. - Key offerings
Exhibit 108: Hillenbrand Inc. - Segment focus
10.8 Husky Technologies
Exhibit 109: Husky Technologies - Overview
Exhibit 110: Husky Technologies - Product / Service
Exhibit 111: Husky Technologies - Key news
Exhibit 112: Husky Technologies - Key offerings
Exhibit 113: KraussMaffei Group GmbH - Overview
Exhibit 114: KraussMaffei Group GmbH - Product / Service
Exhibit 115: KraussMaffei Group GmbH - Key offerings
10.10 Proto Labs Inc.
Exhibit 116: Proto Labs Inc. - Overview
Exhibit 117: Proto Labs Inc. - Business segments
Exhibit 118: Proto Labs Inc. - Key offerings
Exhibit 119: Proto Labs Inc. - Segment focus
Exhibit 120: Sumitomo Heavy Industries, Ltd. - Overview
Exhibit 121: Sumitomo Heavy Industries, Ltd. - Product / Service
Exhibit 122: Sumitomo Heavy Industries, Ltd. - Key offerings
10.12 The Japan Steel Works Ltd.
Exhibit 123: The Japan Steel Works Ltd. - Overview
Exhibit 124: The Japan Steel Works Ltd. - Business segments
Exhibit 125: The Japan Steel Works Ltd. - Key offerings
Exhibit 126: The Japan Steel Works Ltd. - Segment focus
11.1 Scope of the report
11.2 Inclusions and exclusions checklist
Exhibit 127: Inclusions checklist
Exhibit 128: Exclusions checklist
11.3 Currency conversion rates for US$
Exhibit 129: Currency conversion rates for US$
11.4 Research methodology
Exhibit 130: Research methodology
Exhibit 131: Validation techniques employed for market sizing
Exhibit 132: Information sources
11.5 List of abbreviations
Exhibit 133: List of abbreviations
About Us
Technavio is a leading global technology research and advisory company. Their research and analysis focuses on emerging market trends and provides actionable insights to help businesses identify market opportunities and develop effective strategies to optimize their market positions. With over 500 specialized analysts, Technavio's report library consists of more than 17,000 reports and counting, covering 800 technologies, spanning across 50 countries. Their client base consists of enterprises of all sizes, including more than 100 Fortune 500 companies. This growing client base relies on Technavio's comprehensive coverage, extensive research, and actionable market insights to identify opportunities in existing and potential markets and assess their competitive positions within changing market scenarios.
Contact
Technavio Research
Jesse Maida
US: +1 844 364 1100
UK: +44 203 893 3200
Email: [email protected]
Website: www.technavio.com/
SOURCE Technavio
For more details,please visit the original website
The content of the article does not represent any opinions of Synapse and its affiliated companies. If there is any copyright infringement or error, please contact us, and we will deal with it within 24 hours.
Organizations
Indications
-Targets
-Drugs
-Hot reports


Get started for free today!
Accelerate Strategic R&D decision making with Synapse, PatSnap’s AI-powered Connected Innovation Intelligence Platform Built for Life Sciences Professionals.
Start your data trial now!
Synapse data is also accessible to external entities via APIs or data packages. Leverages most recent intelligence information, enabling fullest potential.