Hepatitis B and C diagnostics market size to increase by USD 2,055.79 million; North America to account for 47% of market growth - Technavio
24 Jan 2023
NEW YORK, Jan. 24, 2023 /PRNewswire/ -- The
Hepatitis B and C Diagnostics Market by Type, Disease Type, and Geography - Forecast and Analysis 2023-2027 report has been published by Technavio. Market size is forecast to grow by
USD 2,055.79 million between 2022 and 2027. However, the growth momentum will decelerate at a
CAGR of 6.12%. The report provides a comprehensive analysis of growth opportunities at regional levels, new product launches, the latest trends, and the post-pandemic recovery of the global market.
Download A PDF Sample Report
Regional Analysis
Continue Reading
Preview
Source: PRNewswire
Technavio has announced its latest market research report titled Global Hepatitis B and C Diagnostics Market 2023-2027
By region, the global hepatitis B and C diagnostics market is segmented into North America, Europe, Asia, and Rest of World (ROW). North America will account for
47% of market growth during the forecast period. Factors such as the increasing incidence of infections and new product launches by established companies are driving the growth of the hepatitis B and C diagnostics market in North America.
Buy the report
Company Profiles
The hepatitis B and C diagnostics market report includes information on the key products and recent developments of leading vendors, including:
Abbott Laboratories - The company offers Hepatitis B and C Diagnostics solutions through two tests conducted to identify viremia which can be improved by promoting reflex testing where the same sample is used for both tests required to diagnose HCV, under the brand names of Alinity, ARCHITECT, and AlinIQ.
bioMerieux SA - The company offers Hepatitis B and C Diagnostics solutions for monitoring chronic hepatitis and determination of hepatitis immune status, under the brand name VIDAS.
Danaher Corp. - The company offers Hepatitis B and C Diagnostics solutions for on-demand molecular testing for diagnosis and monitoring of HCV using GeneXpert technology, under the brand name Xpert.
DiaSorin SpA - The company offers Hepatitis B and C Diagnostics solutions with a wide range of instruments and highly sensitive and specific assays on the ELISA format, under the brand name of LIAISON.
Market Dynamics
The market is driven by factors such as the growing demand for molecular diagnostics in diagnosis of HBV and HCV, strategies of healthcare organizations toward simplifying diagnostic process, and the rising demand for POC diagnostics. However, the low penetration of HBV and HCV diagnostic tests is hindering the market growth.
Competitive Analysis
The competitive scenario categorizes companies based on various performance indicators. Some of the factors considered include the financial performance of companies over the past few years, growth strategies, product innovations, new product launches, investments, and growth in market share among others.
Request a Sample
Market Segmentation
By type, the market is segmented into immunodiagnostics and NAT. The immunodiagnostics segment accounted for the largest share of the market in 2022.
By geography, the market is segmented into North America, Europe, Asia, and Rest of World (ROW). North America held the largest share of the market in 2022.
Related Reports:
The
human combination vaccines market is estimated to grow at a CAGR of 8.13% between 2022 and 2027. The size of the market is forecast to increase by USD 6,046.98 million. The rise in cases of infectious diseases notably drives the market growth, although factors such as the incompatibility of vaccine components may impede the market growth.
The
medical diagnostics market is estimated to grow at a CAGR of 6.15% between 2022 and 2027. The size of the market is forecast to increase by USD 74.58 billion. The high prevalence of infectious diseases is notably driving the market growth, although factors such as the lack of trained laboratory technicians may impede the market growth.
Technavio's library includes over 17,000+ reports, covering more than 2,000 emerging technologies.
Subscribe to our "Basic Plan" at just USD 5,000 and get lifetime access to Technavio Insights
What are the key data covered in this hepatitis B and C diagnostics market report?
CAGR of the market during the forecast period.
Detailed information on factors that will drive the growth of the market between 2023 and 2027
Precise estimation of the size of the hepatitis B and C diagnostics market and its contribution to the parent market.
Accurate predictions about upcoming trends and changes in consumer behavior.
Growth of the market across North America, Europe, Asia, and Rest of World (ROW).
A thorough analysis of the market's competitive landscape and detailed information about vendors.
Comprehensive analysis of factors that will challenge the growth of hepatitis B and C diagnostics market vendors.
Hepatitis B and C Diagnostics Market Scope
Table of contents:
1 Executive Summary
1.1 Market overview
Exhibit 01: Executive Summary – Chart on Market Overview
Exhibit 02: Executive Summary – Data Table on Market Overview
Exhibit 03: Executive Summary – Chart on Global Market Characteristics
Exhibit 04: Executive Summary – Chart on Market by Geography
Exhibit 05: Executive Summary – Chart on Market Segmentation by Type
Exhibit 06: Executive Summary – Chart on Market Segmentation by Disease Type
Exhibit 07: Executive Summary – Chart on Incremental Growth
Exhibit 08: Executive Summary – Data Table on Incremental Growth
Exhibit 09: Executive Summary – Chart on Vendor Market Positioning
2 Market Landscape
2.1 Market ecosystem
Exhibit 10: Parent market
Exhibit 11: Market Characteristics
3 Market Sizing
3.1 Market definition
Exhibit 12: Offerings of vendors included in the market definition
3.2 Market segment analysis
Exhibit 13: Market segments
3.3 Market size 2022
3.4 Market outlook: Forecast for 2022-2027
Exhibit 14: Chart on Global - Market size and forecast 2022-2027 ($ million)
Exhibit 15: Data Table on Global - Market size and forecast 2022-2027 ($ million)
Exhibit 16: Chart on Global Market: Year-over-year growth 2022-2027 (%)
Exhibit 17: Data Table on Global Market: Year-over-year growth 2022-2027 (%)
4 Historic Market Size
4.1 Global hepatitis B and C diagnostics market 2017 - 2021
Exhibit 18: Historic Market Size – Data Table on Global hepatitis B and C diagnostics market 2017 - 2021 ($ million)
4.2 Procedure Segment Analysis 2017 - 2021
Exhibit 19: Historic Market Size – Procedure Segment 2017 - 2021 ($ million)
4.3 Diseases Segment Analysis 2017 - 2021
Exhibit 20: Historic Market Size – Diseases Segment 2017 - 2021 ($ million)
4.4 Geography Segment Analysis 2017 - 2021
Exhibit 21: Historic Market Size – Geography Segment 2017 - 2021 ($ million)
4.5 Country Segment Analysis 2017 - 2021
Exhibit 22: Historic Market Size – Country Segment 2017 - 2021 ($ million)
5 Five Forces Analysis
5.1 Five forces summary
Exhibit 23: Five forces analysis - Comparison between 2022 and 2027
5.2 Bargaining power of buyers
Exhibit 24: Chart on Bargaining power of buyers – Impact of key factors 2022 and 2027
5.3 Bargaining power of suppliers
Exhibit 25: Bargaining power of suppliers – Impact of key factors in 2022 and 2027
5.4 Threat of new entrants
Exhibit 26: Threat of new entrants – Impact of key factors in 2022 and 2027
5.5 Threat of substitutes
Exhibit 27: Threat of substitutes – Impact of key factors in 2022 and 2027
5.6 Threat of rivalry
Exhibit 28: Threat of rivalry – Impact of key factors in 2022 and 2027
5.7 Market condition
Exhibit 29: Chart on Market condition - Five forces 2022 and 2027
6 Market Segmentation by Type
6.1 Market segments
Exhibit 30: Chart on Type - Market share 2022-2027 (%)
Exhibit 31: Data Table on Type - Market share 2022-2027 (%)
6.2 Comparison by Type
Exhibit 32: Chart on Comparison by Type
Exhibit 33: Data Table on Comparison by Type
6.3 Immunodiagnostics - Market size and forecast 2022-2027
Exhibit 34: Chart on Immunodiagnostics - Market size and forecast 2022-2027 ($ million)
Exhibit 35: Data Table on Immunodiagnostics - Market size and forecast 2022-2027 ($ million)
Exhibit 36: Chart on Immunodiagnostics - Year-over-year growth 2022-2027 (%)
Exhibit 37: Data Table on Immunodiagnostics - Year-over-year growth 2022-2027 (%)
6.4 NAT - Market size and forecast 2022-2027
Exhibit 38: Chart on NAT - Market size and forecast 2022-2027 ($ million)
Exhibit 39: Data Table on NAT - Market size and forecast 2022-2027 ($ million)
Exhibit 40: Chart on NAT - Year-over-year growth 2022-2027 (%)
Exhibit 41: Data Table on NAT - Year-over-year growth 2022-2027 (%)
6.5 Market opportunity by Type
Exhibit 42: Market opportunity by Type ($ million)
7 Market Segmentation by Disease Type
7.1 Market segments
Exhibit 43: Chart on Disease Type - Market share 2022-2027 (%)
Exhibit 44: Data Table on Disease Type - Market share 2022-2027 (%)
7.2 Comparison by Disease Type
Exhibit 45: Chart on Comparison by Disease Type
Exhibit 46: Data Table on Comparison by Disease Type
7.3 Hepatitis B - Market size and forecast 2022-2027
Exhibit 47: Chart on Hepatitis B - Market size and forecast 2022-2027 ($ million)
Exhibit 48: Data Table on Hepatitis B - Market size and forecast 2022-2027 ($ million)
Exhibit 49: Chart on Hepatitis B - Year-over-year growth 2022-2027 (%)
Exhibit 50: Data Table on Hepatitis B - Year-over-year growth 2022-2027 (%)
7.4 Hepatitis C - Market size and forecast 2022-2027
Exhibit 51: Chart on Hepatitis C - Market size and forecast 2022-2027 ($ million)
Exhibit 52: Data Table on Hepatitis C - Market size and forecast 2022-2027 ($ million)
Exhibit 53: Chart on Hepatitis C - Year-over-year growth 2022-2027 (%)
Exhibit 54: Data Table on Hepatitis C - Year-over-year growth 2022-2027 (%)
7.5 Market opportunity by Disease Type
Exhibit 55: Market opportunity by Disease Type ($ million)
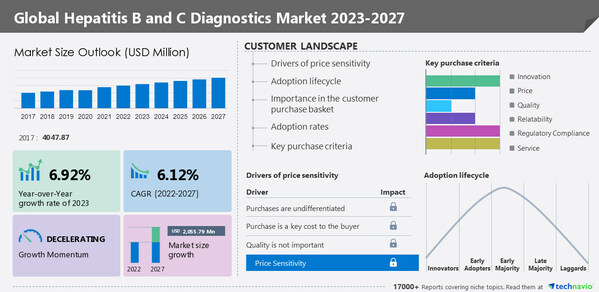
8 Customer Landscape
8.1 Customer landscape overview
Exhibit 56: Analysis of price sensitivity, lifecycle, customer purchase basket, adoption rates, and purchase criteria
9 Geographic Landscape
9.1 Geographic segmentation
Exhibit 57: Chart on Market share by geography 2022-2027 (%)
Exhibit 58: Data Table on Market share by geography 2022-2027 (%)
9.2 Geographic comparison
Exhibit 59: Chart on Geographic comparison
Exhibit 60: Data Table on Geographic comparison
9.3 North America - Market size and forecast 2022-2027
Exhibit 61: Chart on North America - Market size and forecast 2022-2027 ($ million)
Exhibit 62: Data Table on North America - Market size and forecast 2022-2027 ($ million)
Exhibit 63: Chart on North America - Year-over-year growth 2022-2027 (%)
Exhibit 64: Data Table on North America - Year-over-year growth 2022-2027 (%)
9.4 Europe - Market size and forecast 2022-2027
Exhibit 65: Chart on Europe - Market size and forecast 2022-2027 ($ million)
Exhibit 66: Data Table on Europe - Market size and forecast 2022-2027 ($ million)
Exhibit 67: Chart on Europe - Year-over-year growth 2022-2027 (%)
Exhibit 68: Data Table on Europe - Year-over-year growth 2022-2027 (%)
9.5 Asia - Market size and forecast 2022-2027
Exhibit 69: Chart on Asia - Market size and forecast 2022-2027 ($ million)
Exhibit 70: Data Table on Asia - Market size and forecast 2022-2027 ($ million)
Exhibit 71: Chart on Asia - Year-over-year growth 2022-2027 (%)
Exhibit 72: Data Table on Asia - Year-over-year growth 2022-2027 (%)
9.6 Rest of World (ROW) - Market size and forecast 2022-2027
Exhibit 73: Chart on Rest of World (ROW) - Market size and forecast 2022-2027 ($ million)
Exhibit 74: Data Table on Rest of World (ROW) - Market size and forecast 2022-2027 ($ million)
Exhibit 75: Chart on Rest of World (ROW) - Year-over-year growth 2022-2027 (%)
Exhibit 76: Data Table on Rest of World (ROW) - Year-over-year growth 2022-2027 (%)
9.7 US - Market size and forecast 2022-2027
Exhibit 77: Chart on US - Market size and forecast 2022-2027 ($ million)
Exhibit 78: Data Table on US - Market size and forecast 2022-2027 ($ million)
Exhibit 79: Chart on US - Year-over-year growth 2022-2027 (%)
Exhibit 80: Data Table on US - Year-over-year growth 2022-2027 (%)
9.8 Germany - Market size and forecast 2022-2027
Exhibit 81: Chart on Germany - Market size and forecast 2022-2027 ($ million)
Exhibit 82: Data Table on Germany - Market size and forecast 2022-2027 ($ million)
Exhibit 83: Chart on Germany - Year-over-year growth 2022-2027 (%)
Exhibit 84: Data Table on Germany - Year-over-year growth 2022-2027 (%)
9.9 UK - Market size and forecast 2022-2027
Exhibit 85: Chart on UK - Market size and forecast 2022-2027 ($ million)
Exhibit 86: Data Table on UK - Market size and forecast 2022-2027 ($ million)
Exhibit 87: Chart on UK - Year-over-year growth 2022-2027 (%)
Exhibit 88: Data Table on UK - Year-over-year growth 2022-2027 (%)
9.10 Japan - Market size and forecast 2022-2027
Exhibit 89: Chart on Japan - Market size and forecast 2022-2027 ($ million)
Exhibit 90: Data Table on Japan - Market size and forecast 2022-2027 ($ million)
Exhibit 91: Chart on Japan - Year-over-year growth 2022-2027 (%)
Exhibit 92: Data Table on Japan - Year-over-year growth 2022-2027 (%)
9.11 China - Market size and forecast 2022-2027
Exhibit 93: Chart on China - Market size and forecast 2022-2027 ($ million)
Exhibit 94: Data Table on China - Market size and forecast 2022-2027 ($ million)
Exhibit 95: Chart on China - Year-over-year growth 2022-2027 (%)
Exhibit 96: Data Table on China - Year-over-year growth 2022-2027 (%)
9.12 Market opportunity by geography
Exhibit 97: Market opportunity by geography ($ million)
10 Drivers, Challenges, and Trends
10.1 Market drivers
10.2 Market challenges
10.3 Impact of drivers and challenges
Exhibit 98: Impact of drivers and challenges in 2022 and 2027
10.4 Market trends
11 Vendor Landscape
11.1 Overview
11.2 Vendor landscape
Exhibit 99: Overview on Criticality of inputs and Factors of differentiation
11.3 Landscape disruption
Exhibit 100: Overview on factors of disruption
11.4 Industry risks
Exhibit 101: Impact of key risks on business
12 Vendor Analysis
12.1 Vendors covered
Exhibit 102: Vendors covered
12.2 Market positioning of vendors
Exhibit 103: Matrix on vendor position and classification
12.3 Abbott Laboratories
Exhibit 104: Abbott Laboratories - Overview
Exhibit 105: Abbott Laboratories - Business segments
Exhibit 106: Abbott Laboratories - Key news
Exhibit 107: Abbott Laboratories - Key offerings
Exhibit 108: Abbott Laboratories - Segment focus
Exhibit 109: Bio Rad Laboratories Inc. - Overview
Exhibit 110: Bio Rad Laboratories Inc. - Business segments
Exhibit 111: Bio Rad Laboratories Inc. - Key news
Exhibit 112: Bio Rad Laboratories Inc. - Key offerings
Exhibit 113: Bio Rad Laboratories Inc. - Segment focus
12.5 bioMerieux SA
Exhibit 114: bioMerieux SA - Overview
Exhibit 115: bioMerieux SA - Product / Service
Exhibit 116: bioMerieux SA - Key offerings
12.6 DAAN Gene Co. Ltd.
Exhibit 117: DAAN Gene Co. Ltd. - Overview
Exhibit 118: DAAN Gene Co. Ltd. - Product / Service
Exhibit 119: DAAN Gene Co. Ltd. - Key offerings
12.7 DiaSorin SpA
Exhibit 120: DiaSorin SpA - Overview
Exhibit 121: DiaSorin SpA - Business segments
Exhibit 122: DiaSorin SpA - Key news
Exhibit 123: DiaSorin SpA - Key offerings
Exhibit 124: DiaSorin SpA - Segment focus
12.8 Enzo Biochem Inc.
Exhibit 125: Enzo Biochem Inc. - Overview
Exhibit 126: Enzo Biochem Inc. - Product / Service
Exhibit 127: Enzo Biochem Inc. - Key offerings
Exhibit 128: F. Hoffmann La Roche Ltd. - Overview
Exhibit 129: F. Hoffmann La Roche Ltd. - Business segments
Exhibit 130: F. Hoffmann La Roche Ltd. - Key news
Exhibit 131: F. Hoffmann La Roche Ltd. - Key offerings
Exhibit 132: F. Hoffmann La Roche Ltd. - Segment focus
12.10 Grifols SAGrifols SA
Exhibit 133: Grifols SA - Overview
Exhibit 134: Grifols SA - Business segments
Exhibit 136: Grifols SA - Segment focus
12.11 Hologic Inc.
Exhibit 137: Hologic Inc. - Overview
Exhibit 138: Hologic Inc. - Business segments
Exhibit 139: Hologic Inc. - Key news
Exhibit 140: Hologic Inc. - Key offerings
Exhibit 141: Hologic Inc. - Segment focus
12.12 MedMira Inc.
Exhibit 142: MedMira Inc. - Overview
Exhibit 143: MedMira Inc. - Product / Service
Exhibit 144: MedMira Inc. - Key offerings
Exhibit 145: OraSure Technologies Inc. - Overview
Exhibit 146: OraSure Technologies Inc. - Business segments
Exhibit 147: OraSure Technologies Inc. - Key offerings
Exhibit 148: OraSure Technologies Inc. - Segment focus
12.14 PerkinElmer Inc.
Exhibit 149: PerkinElmer Inc. - Overview
Exhibit 150: PerkinElmer Inc. - Business segments
Exhibit 151: PerkinElmer Inc. - Key news
Exhibit 152: PerkinElmer Inc. - Key offerings
Exhibit 153: PerkinElmer Inc. - Segment focus
12.15 QIAGEN NV
Exhibit 154: QIAGEN NV - Overview
Exhibit 155: QIAGEN NV - Product / Service
Exhibit 156: QIAGEN NV - Key news
Exhibit 157: QIAGEN NV - Key offerings
12.16 Randox Laboratories Ltd.
Exhibit 158: Randox Laboratories Ltd. - Overview
Exhibit 159: Randox Laboratories Ltd. - Product / Service
Exhibit 160: Randox Laboratories Ltd. - Key offerings
12.17 Siemens AG
Exhibit 161: Siemens AG - Overview
Exhibit 162: Siemens AG - Business segments
Exhibit 163: Siemens AG - Key news
Exhibit 164: Siemens AG - Key offerings
Exhibit 165: Siemens AG - Segment focus
13 Appendix
13.1 Scope of the report
13.2 Inclusions and exclusions checklist
Exhibit 166: Inclusions checklist
Exhibit 167: Exclusions checklist
13.3 Currency conversion rates for US$
Exhibit 168: Currency conversion rates for US$
13.4 Research methodology
Exhibit 169: Research methodology
Exhibit 170: Validation techniques employed for market sizing
Exhibit 171: Information sources
13.5 List of abbreviations
Exhibit 172: List of abbreviations
About Us
Technavio is a leading global technology research and advisory company. Their research and analysis focus on emerging market trends and provides actionable insights to help businesses identify market opportunities and develop effective strategies to optimize their market positions. With over 500 specialized analysts, Technavio's report library consists of more than 17,000 reports and counting, covering 800 technologies, spanning across 50 countries. Their client base consists of enterprises of all sizes, including more than 100 Fortune 500 companies. This growing client base relies on Technavio's comprehensive coverage, extensive research, and actionable market insights to identify opportunities in existing and potential markets and assess their competitive positions within changing market scenarios.
Contact
Technavio Research
Jesse Maida
Media & Marketing Executive
US: +1 844 364 1100
UK: +44 203 893 3200
Email: [email protected]
Website: www.technavio.com/
SOURCE Technavio
For more details,please visit the original website
The content of the article does not represent any opinions of Synapse and its affiliated companies. If there is any copyright infringement or error, please contact us, and we will deal with it within 24 hours.
Organizations
Indications
Targets
-Drugs
Chat with Hiro
Hot reports


Get started for free today!
Accelerate Strategic R&D decision making with Synapse, PatSnap’s AI-powered Connected Innovation Intelligence Platform Built for Life Sciences Professionals.
Start your data trial now!
Synapse data is also accessible to external entities via APIs or data packages. Empower better decisions with the latest in pharmaceutical intelligence.