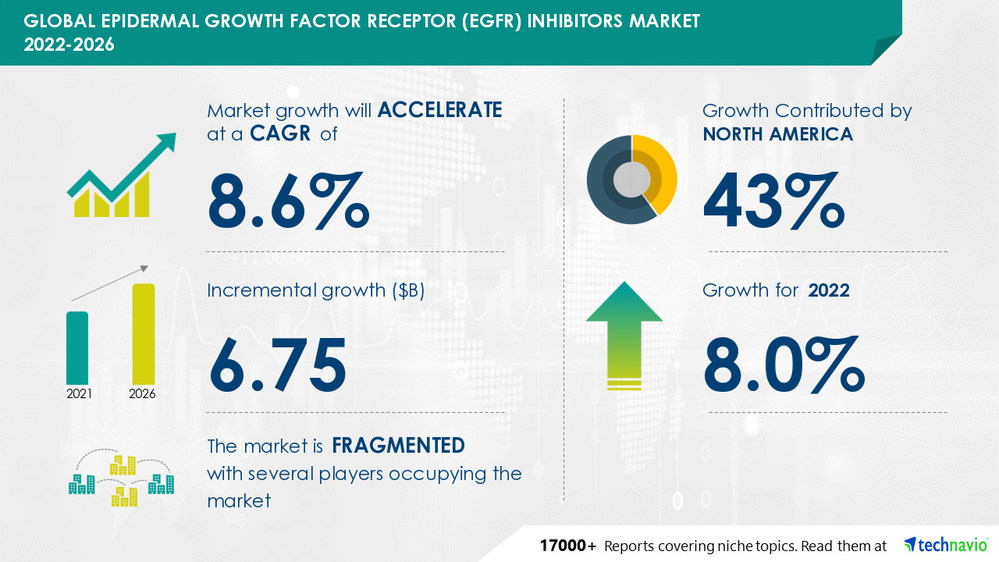
NEW YORK, June 21, 2022 /PRNewswire/ -- The epidermal growth factor receptor (EGFR) inhibitors market size is expected to grow by
USD 6.75 billion from 2021 to 2026 at a
CAGR of 8.6% as per the latest market report by Technavio. The epidermal growth factor receptor (EGFR) inhibitors market is
fragmented and the vendors are deploying growth strategies such as investment in R and D to compete in the market. The epidermal growth factor receptor (EGFR) inhibitors market report offers information on several market vendors, including Amgen Inc., Apollomics Inc., AstraZeneca Plc, Boehringer Ingelheim International GmbH, Bristol Myers Squibb Co., Checkpoint Therapeutics Inc., Eli Lilly and Co., F. Hoffmann La Roche Ltd., Jiangsu Hansoh Pharmaceutical Group Co. Ltd., Jiangsu Hengrui Pharmaceuticals Co. Ltd., Johnson and Johnson Inc., Novartis AG, Pfizer Inc., Puma Biotechnology Inc., and Takeda Pharmaceutical Co. Ltd. among others. Few vendors with key offerings -
Technavio has announced its latest market research report titled Epidermal Growth Factor Receptor (EGFR) Inhibitors Market by Indication and Geography - Forecast and Analysis 2022-2026
Amgen Inc. - The company offers epidermal growth factor receptor that provides medications which include Aimovig injection, Arnasep, Avsola, Blincyto, Corlanor, Lumacars, and many more, under the brand name of Amgen Inc.
Apollomics Inc. - The company offers epidermal growth factor receptor that provides tumor inhibitors, chemotherapy, and immuno-oncology drugs for cancer patients.
AstraZeneca Plc - The company offers epidermal growth factor receptor that provides therapy for oncology, biopharmaceuticals, cardiovascular, renal and metabolism, respiratory, and immunology, under the brand name of AstraZeneca Plc.
Boehringer Ingelheim International GmbH - The company offers epidermal growth factor receptor that provides medications and therapy for heart disease, cancer, lung disease, mental disease, skin disease, and retinal disease.
Bristol Myers Squibb Co. - The company operates in a single segment and is engaged in the discovery, development, licensing, manufacturing, marketing, distribution, and sale of innovative medicines for various diseases.
To know about all major vendor offerings - Request a sample report
Read the 120-page report with TOC on "Epidermal Growth Factor Receptor (EGFR) Inhibitors Market Analysis Report by Geography (North America, Europe, Asia, and Rest of World (ROW)) and Market Landscape (lung cancer, colorectal cancer, breast cancer, and others), and the Segment Forecasts, 2022-2026". Gain competitive intelligence about market leaders. Track key industry opportunities, trends, and threats. Information on marketing, brand, strategy and market development, sales, and supply functions.
Get ready to achieve excellent business outcomes from this exclusive Epidermal Growth Factor Receptor (EGFR) Inhibitor Market report by Technavio. The report will include highlights of the overall market which includes frequently asked questions such as -
What are historical revenue figures and estimated revenue figures as well as CAGR during the forecast timeframe?
What is the current trend taking place in the market space?
Which are business tactics that will influence competitive scenarios along with defining the growth potential of the market?
What are market drivers, restraints, and challenges impacting demand & growth of the market?
Which regions & segments will garner massive revenue and emerge as market leaders in upcoming years?
The competitive scenario provided in the
Epidermal Growth Factor Receptor (EGFR) Inhibitor Market report analyzes, evaluates, and positions companies based on various performance indicators. Some of the factors considered for this analysis include the financial performance of companies over the past few years, growth strategies, product innovations, new product launches, investments, growth in market share, etc. Don't wait, make a strategic approach & boost your business goals with our Epidermal Growth Factor Receptor (EGFR) Inhibitor Market Forecast Report -
Buy Now!
Epidermal Growth Factor Receptor (EGFR) Inhibitor Market: Drivers & Challenges
The key factor driving the global epidermal growth factor receptor (EGFR) inhibitors market growth is
the strong prevalence of major cancer indications. The US reports the highest number of cancer cases in the world. According to the Union for International Cancer Control (UICC), there were 19.1 million cancer cases in 2020, which resulted in 10 million deaths globally. In addition, the number of breast cancer cases increased by 24% in 2020 when compared with 2019. Moreover, the International Agency for Research on Cancer (IARC) has estimated that there will be around 29.4 million cancer cases by 2040, which will result in the death of 16.4 million people due to cancer. Despite the increasing prevalence of cancer, the market still witnesses a huge unmet need, which has created an opportunity for vendors to conduct a study on drugs such as EGFR inhibitors for the treatment of cancer indications. Such factors are expected to support the market growth during the forecast period.
However, one of the key challenges to the global epidermal growth factor receptor (EGFR) inhibitors market growth is the
high treatment costs. For instance, the treatment using IRESSA, a novel EGFR inhibitor by AstraZeneca, is priced at approximately USD 8100 for a supply of 30 tablets. Similarly, the yearly cost of treatment using TAGRISSO by AstraZeneca is approximately USD 13,000 per month or USD 156,000 per year for the treatment of NSCLC. ERBITUX, a novel EGFR inhibitor by Eli Lilly and Company, is priced at approximately USD 80,000 for 18 weeks of treatment for head and neck cancer, and colorectal cancer, making the treatment cost up to USD 235,000 per year. Drugs such as TYKERB by Novartis and TARCEVA by Roche are also priced on the higher end, with the yearly treatment costs going as high as USD 30,000. Thus, the high cost of the approved EGFR inhibitors is expected to hinder the growth of the global EGFR inhibitors market during the forecast period.
To know about other drivers & challenges - Click Now!
Epidermal Growth Factor Receptor (EGFR) Inhibitors Market: Segmentation Analysis
Geography Outlook (Revenue, USD bn, 2021-2026)
North America - size and forecast 2021-2026
Europe - size and forecast 2021-2026
Asia - size and forecast 2021-2026
Rest of World (ROW) - size and forecast 2021-2026
Landscape Outlook (Revenue, USD bn, 2021-2026)
Lung cancer - size and forecast 2021-2026
Colorectal cancer - size and forecast 2021-2026
Breast cancer - size and forecast 2021-2026
Others - size and forecast 2021-2026
To know about the contribution of each segment -
Grab an Exclusive Sample Report
Related Reports:
The
breast implant market size is expected to reach a value of USD 437.17 million at a CAGR of 5.80% from 2020 to 2025.
The
orthopedic 3D printing devices market share is expected to increase by USD 901.59 million from 2020 to 2025, and the market's growth momentum will accelerate at a CAGR of 15.61%.
Table of Content
1 Executive Summary
1.1 Market overview
Exhibit 01: Executive Summary – Chart on Market Overview
Exhibit 02: Executive Summary – Data Table on Market Overview
Exhibit 03: Executive Summary – Chart on Global Market Characteristics
Exhibit 04: Executive Summary – Chart on Market by Geography
Exhibit 05: Executive Summary – Chart on Market Segmentation by Indication
Exhibit 06: Executive Summary – Chart on Incremental Growth
Exhibit 07: Executive Summary – Data Table on Incremental Growth
Exhibit 08: Executive Summary – Chart on Vendor Market Positioning
2 Market Landscape
2.1 Market ecosystem
Exhibit 09: Parent market
Exhibit 10: Market Characteristics
3 Market Sizing
3.1 Market definition
Exhibit 11: Offerings of vendors included in the market definition
3.2 Market segment analysis
Exhibit 12: Market segments
3.3 Market size 2021
3.4 Market outlook: Forecast for 2021-2026
Exhibit 13: Chart on Global - Market size and forecast 2021-2026 ($ million)
Exhibit 14: Data Table on Global - Market size and forecast 2021-2026 ($ million)
Exhibit 15: Chart on Global Market: Year-over-year growth 2021-2026 (%)
Exhibit 16: Data Table on Global Market: Year-over-year growth 2021-2026 (%)
4 Five Forces Analysis
4.1 Five forces summary
Exhibit 17: Five forces analysis - Comparison between 2021 and 2026
4.2 Bargaining power of buyers
Exhibit 18: Bargaining power of buyers – Impact of key factors in 2021 and 2026
4.3 Bargaining power of suppliers
Exhibit 19: Bargaining power of suppliers – Impact of key factors in 2021 and 2026
4.4 Threat of new entrants
Exhibit 20: Threat of new entrants – Impact of key factors in 2021 and 2026
4.5 Threat of substitutes
Exhibit 21: Threat of substitutes – Impact of key factors in 2021 and 2026
4.6 Threat of rivalry
Exhibit 22: Threat of rivalry – Impact of key factors in 2021 and 2026
4.7 Market condition
Exhibit 23: Chart on Market condition - Five forces 2021 and 2026
5 Market Segmentation by Indication
5.1 Market segments
Exhibit 24: Chart on Indication - Market share 2021-2026 (%)
Exhibit 25: Data Table on Indication - Market share 2021-2026 (%)
5.2 Comparison by Indication
Exhibit 26: Chart on Comparison by Indication
Exhibit 27: Data Table on Comparison by Indication
5.3 Lung cancer - Market size and forecast 2021-2026
Exhibit 28: Chart on Lung cancer - Market size and forecast 2021-2026 ($ million)
Exhibit 29: Data Table on Lung cancer - Market size and forecast 2021-2026 ($ million)
Exhibit 30: Chart on Lung cancer - Year-over-year growth 2021-2026 (%)
Exhibit 31: Data Table on Lung cancer - Year-over-year growth 2021-2026 (%)
5.4 Colorectal cancer - Market size and forecast 2021-2026
Exhibit 32: Chart on Colorectal cancer - Market size and forecast 2021-2026 ($ million)
Exhibit 33: Data Table on Colorectal cancer - Market size and forecast 2021-2026 ($ million)
Exhibit 34: Chart on Colorectal cancer - Year-over-year growth 2021-2026 (%)
Exhibit 35: Data Table on Colorectal cancer - Year-over-year growth 2021-2026 (%)
5.5 Breast cancer - Market size and forecast 2021-2026
Exhibit 36: Chart on Breast cancer - Market size and forecast 2021-2026 ($ million)
Exhibit 37: Data Table on Breast cancer - Market size and forecast 2021-2026 ($ million)
Exhibit 38: Chart on Breast cancer - Year-over-year growth 2021-2026 (%)
Exhibit 39: Data Table on Breast cancer - Year-over-year growth 2021-2026 (%)
5.6 Others - Market size and forecast 2021-2026
Exhibit 40: Chart on Others - Market size and forecast 2021-2026 ($ million)
Exhibit 41: Data Table on Others - Market size and forecast 2021-2026 ($ million)
Exhibit 42: Chart on Others - Year-over-year growth 2021-2026 (%)
Exhibit 43: Data Table on Others - Year-over-year growth 2021-2026 (%)
5.7 Market opportunity by Indication
Exhibit 44: Market opportunity by Indication ($ million)
6 Customer Landscape
6.1 Customer landscape overview
Exhibit 45: Analysis of price sensitivity, lifecycle, customer purchase basket, adoption rates, and purchase criteria
7 Geographic Landscape
7.1 Geographic segmentation
Exhibit 46: Chart on Market share by geography 2021-2026 (%)
Exhibit 47: Data Table on Market share by geography 2021-2026 (%)
7.2 Geographic comparison
Exhibit 48: Chart on Geographic comparison
Exhibit 49: Data Table on Geographic comparison
7.3 North America - Market size and forecast 2021-2026
Exhibit 50: Chart on North America - Market size and forecast 2021-2026 ($ million)
Exhibit 51: Data Table on North America - Market size and forecast 2021-2026 ($ million)
Exhibit 52: Chart on North America - Year-over-year growth 2021-2026 (%)
Exhibit 53: Data Table on North America - Year-over-year growth 2021-2026 (%)
7.4 Europe - Market size and forecast 2021-2026
Exhibit 54: Chart on Europe - Market size and forecast 2021-2026 ($ million)
Exhibit 55: Data Table on Europe - Market size and forecast 2021-2026 ($ million)
Exhibit 56: Chart on Europe - Year-over-year growth 2021-2026 (%)
Exhibit 57: Data Table on Europe - Year-over-year growth 2021-2026 (%)
7.5 Asia - Market size and forecast 2021-2026
Exhibit 58: Chart on Asia - Market size and forecast 2021-2026 ($ million)
Exhibit 59: Data Table on Asia - Market size and forecast 2021-2026 ($ million)
Exhibit 60: Chart on Asia - Year-over-year growth 2021-2026 (%)
Exhibit 61: Data Table on Asia - Year-over-year growth 2021-2026 (%)
7.6 Rest of World (ROW) - Market size and forecast 2021-2026
Exhibit 62: Chart on Rest of World (ROW) - Market size and forecast 2021-2026 ($ million)
Exhibit 63: Data Table on Rest of World (ROW) - Market size and forecast 2021-2026 ($ million)
Exhibit 64: Chart on Rest of World (ROW) - Year-over-year growth 2021-2026 (%)
Exhibit 65: Data Table on Rest of World (ROW) - Year-over-year growth 2021-2026 (%)
7.7 US - Market size and forecast 2021-2026
Exhibit 66: Chart on US - Market size and forecast 2021-2026 ($ million)
Exhibit 67: Data Table on US - Market size and forecast 2021-2026 ($ million)
Exhibit 68: Chart on US - Year-over-year growth 2021-2026 (%)
Exhibit 69: Data Table on US - Year-over-year growth 2021-2026 (%)
7.8 Germany - Market size and forecast 2021-2026
Exhibit 70: Chart on Germany - Market size and forecast 2021-2026 ($ million)
Exhibit 71: Data Table on Germany - Market size and forecast 2021-2026 ($ million)
Exhibit 72: Chart on Germany - Year-over-year growth 2021-2026 (%)
Exhibit 73: Data Table on Germany - Year-over-year growth 2021-2026 (%)
7.9 UK - Market size and forecast 2021-2026
Exhibit 74: Chart on UK - Market size and forecast 2021-2026 ($ million)
Exhibit 75: Data Table on UK - Market size and forecast 2021-2026 ($ million)
Exhibit 76: Chart on UK - Year-over-year growth 2021-2026 (%)
Exhibit 77: Data Table on UK - Year-over-year growth 2021-2026 (%)
7.10 Canada - Market size and forecast 2021-2026
Exhibit 78: Chart on Canada - Market size and forecast 2021-2026 ($ million)
Exhibit 79: Data Table on Canada - Market size and forecast 2021-2026 ($ million)
Exhibit 80: Chart on Canada - Year-over-year growth 2021-2026 (%)
Exhibit 81: Data Table on Canada - Year-over-year growth 2021-2026 (%)
7.11 France - Market size and forecast 2021-2026
Exhibit 82: Chart on France - Market size and forecast 2021-2026 ($ million)
Exhibit 83: Data Table on France - Market size and forecast 2021-2026 ($ million)
Exhibit 84: Chart on France - Year-over-year growth 2021-2026 (%)
Exhibit 85: Data Table on France - Year-over-year growth 2021-2026 (%)
7.12 Market opportunity by geography
Exhibit 86: Market opportunity by geography ($ million)
8 Drivers, Challenges, and Trends
8.1 Market drivers
8.2 Market challenges
8.3 Impact of drivers and challenges
Exhibit 87: Impact of drivers and challenges in 2021 and 2026
8.4 Market trends
9 Vendor Landscape
9.1 Overview
9.2 Vendor landscape
Exhibit 88: Overview on Criticality of inputs and Factors of differentiation
9.3 Landscape disruption
Exhibit 89: Overview on factors of disruption
9.4 Industry risks
Exhibit 90: Impact of key risks on business
10 Vendor Analysis
10.1 Vendors covered
Exhibit 91: Vendors covered
10.2 Market positioning of vendors
Exhibit 92: Matrix on vendor position and classification
10.3 Amgen Inc.
Exhibit 93: Amgen Inc. - Overview
Exhibit 94: Amgen Inc. - Product / Service
Exhibit 95: Amgen Inc. - Key offerings
10.4 Apollomics Inc.
Exhibit 96: Apollomics Inc. - Overview
Exhibit 97: Apollomics Inc. - Product / Service
Exhibit 98: Apollomics Inc. - Key news
Exhibit 99: Apollomics Inc. - Key offerings
10.5 AstraZeneca Plc
Exhibit 100: AstraZeneca Plc - Overview
Exhibit 101: AstraZeneca Plc - Product / Service
Exhibit 102: AstraZeneca Plc - Key news
Exhibit 103: AstraZeneca Plc - Key offerings
10.6 Boehringer Ingelheim International GmbH
Exhibit 104: Boehringer Ingelheim International GmbH - Overview
Exhibit 105: Boehringer Ingelheim International GmbH - Business segments
Exhibit 106: Boehringer Ingelheim International GmbH - Key news
Exhibit 107: Boehringer Ingelheim International GmbH - Key offerings
Exhibit 108: Boehringer Ingelheim International GmbH - Segment focus
10.7 Checkpoint Therapeutics Inc.
Exhibit 109: Checkpoint Therapeutics Inc. - Overview
Exhibit 110: Checkpoint Therapeutics Inc. - Business segments
Exhibit 111: Checkpoint Therapeutics Inc. - Key offerings
Exhibit 112: Checkpoint Therapeutics Inc. - Segment focus
10.8 Eli Lilly and Co.
Exhibit 113: Eli Lilly and Co. - Overview
Exhibit 114: Eli Lilly and Co. - Business segments
Exhibit 115: Eli Lilly and Co. - Key offerings
Exhibit 116: Eli Lilly and Co. - Segment focus
10.9 F. Hoffmann La Roche Ltd.
Exhibit 117: F. Hoffmann La Roche Ltd. - Overview
Exhibit 118: F. Hoffmann La Roche Ltd. - Business segments
Exhibit 119: F. Hoffmann La Roche Ltd. - Key news
Exhibit 120: F. Hoffmann La Roche Ltd. - Key offerings
Exhibit 121: F. Hoffmann La Roche Ltd. - Segment focus
10.10 Novartis AG
Exhibit 122: Novartis AG - Overview
Exhibit 123: Novartis AG - Business segments
Exhibit 124: Novartis AG - Key offerings
Exhibit 125: Novartis AG - Segment focus
10.11 Pfizer Inc.
Exhibit 126: Pfizer Inc. - Overview
Exhibit 127: Pfizer Inc. - Product / Service
Exhibit 128: Pfizer Inc. - Key news
Exhibit 129: Pfizer Inc. - Key offerings
10.12 Puma Biotechnology Inc.
Exhibit 130: Puma Biotechnology Inc. - Overview
Exhibit 131: Puma Biotechnology Inc. - Business segments
Exhibit 132: Puma Biotechnology Inc. - Key news
Exhibit 133: Puma Biotechnology Inc. - Key offerings
Exhibit 134: Puma Biotechnology Inc. - Segment focus
11 Appendix
11.1 Scope of the report
11.2 Inclusions and exclusions checklist
Exhibit 135: Inclusions checklist
Exhibit 136: Exclusions checklist
11.3 Currency conversion rates for US$
Exhibit 137: Currency conversion rates for US$
11.4 Research methodology
Exhibit 138: Research methodology
Exhibit 139: Validation techniques employed for market sizing
Exhibit 140: Information sources
11.5 List of abbreviations
Exhibit 141: List of abbreviations
About Technavio
Technavio is a leading global technology research and advisory company. Their research and analysis focuses on emerging market trends and provides actionable insights to help businesses identify market opportunities and develop effective strategies to optimize their market positions.
With over 500 specialized analysts, Technavio's report library consists of more than 17,000 reports and counting, covering 800 technologies, spanning across 50 countries. Their client base consists of enterprises of all sizes, including more than 100 Fortune 500 companies. This growing client base relies on Technavio's comprehensive coverage, extensive research, and actionable market insights to identify opportunities in existing and potential markets and assess their competitive positions within changing market scenarios.
Contacts
Technavio Research
Jesse Maida
Media & Marketing Executive
US: +1 844 364 1100
UK: +44 203 893 3200
Email: [email protected]
Website:
SOURCE Technavio