Last update 28 Sep 2024

Don't Just Sit There Sell Something Ltd.
Last update 28 Sep 2024
Overview
Related
100 Clinical Results associated with Don't Just Sit There Sell Something Ltd.
Login to view more data
0 Patents (Medical) associated with Don't Just Sit There Sell Something Ltd.
Login to view more data
7
News (Medical) associated with Don't Just Sit There Sell Something Ltd.29 Sep 2022
MISSION, Kan., Sept. 29, 2022 /PRNewswire/ -- (Family Features) If you're a woman who tries to stay healthy, you may exercise several times per week, watch what you eat and get 7-9 hours of sleep each night. But are you listening to your lungs?
Chronic obstructive pulmonary disease (COPD), a leading cause of disability and death in the United States, takes an especially heavy toll on women. You may think problems like shortness of breath, frequent coughs or wheezing are just signs of getting older, but it's important to pay attention to these symptoms and discuss them with your doctor.
Photo courtesy of Getty Images
COPD is a serious lung disease that causes breathing problems and worsens over time. It has often been considered a man's disease. Yet more U.S. women than men have been diagnosed with COPD in the past decade, and over the past 20 years more women have died from it, according to the U.S. Centers for Disease Control and Prevention.
Women tend to develop COPD earlier in life than men and are more likely to have severe symptoms and be hospitalized with the disease. The good news? According to the National Heart, Lung, and Blood Institute, there are steps you can take to reduce your risk for COPD.
Don't Smoke
You probably already know cigarette smoking is harmful
– but did you know that women may be more vulnerable to the effects of smoking? Women who smoke tend to get COPD at younger ages and with less cigarettes smoked than men. COPD is the leading cause of death among U.S. women smokers.
If you do smoke, it's never too late to quit.
If you thought vaping was a healthy alternative to smoking, think again. Researchers are still learning about the long-term health effects of e-cigarettes, but they may contain as many, if not more, harmful chemicals than tobacco cigarettes.
Avoid
Pollutants
Among people with COPD who have never smoked, most are women. Women may be more vulnerable to indoor and outdoor air pollution. Women's smaller lungs and airways mean the same amount of inhaled pollutants may cause more damage.
Working in places like nail salons, hair salons or dry cleaners can expose you to harmful chemicals. If you're exposed to chemical fumes at your job, talk to your employer about ways to limit exposure. Better ventilation and wearing a mask can help.
Stay Current on Vaccines
People at risk for COPD are more likely to have serious problems resulting from some vaccine-preventable diseases. Ask a health care provider about getting vaccinated against the flu, pneumococcal disease and COVID-19.
Talk to Your Doctor About COPD
Women with COPD tend to be diagnosed later than men when the disease is more severe and treatments are less effective. If you think you could be at risk, or you are having symptoms, bring it up with your health care provider. Treatment can ease symptoms and improve your ability to exercise.
Learn More to Breathe Better
Find more information on COPD from NHLBI's Learn More Breathe Better® program at copd.nhlbi.nih.gov.
Photo courtesy of Getty Images
Michael French
[email protected]
1-888-824-3337
editors.familyfeatures.com
About Family Features Editorial Syndicate
A leading source for high-quality food, lifestyle and home and garden content, Family Features provides readers with topically and seasonally relevant tips, takeaways, information, recipes, videos, infographics and more. Find additional articles and information at Culinary.net and eLivingToday.com.
SOURCE Family Features Editorial Syndicate

Vaccine
22 Jun 2022
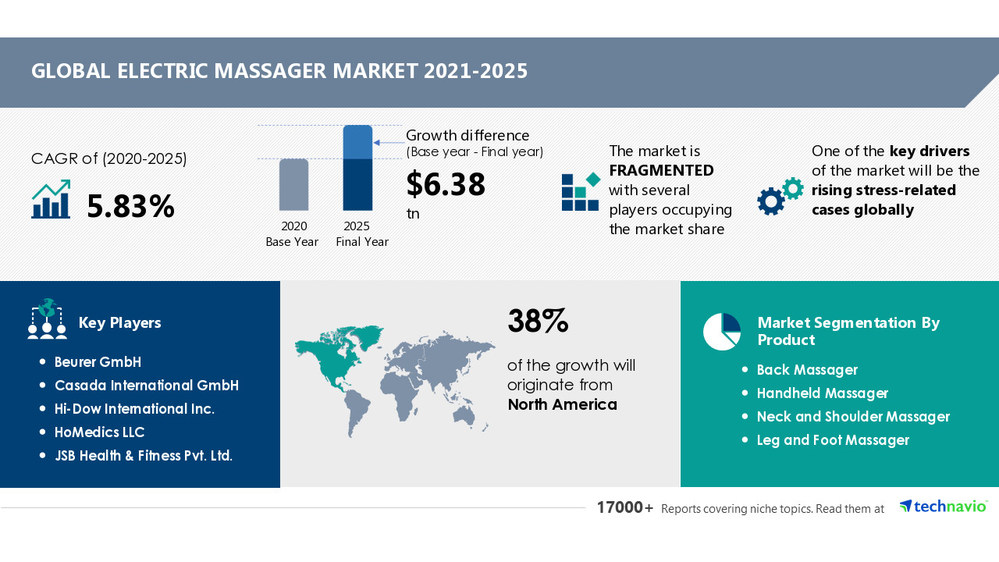
NEW YORK, June 22, 2022 /PRNewswire/ -- According to the research report "Electric Massager Market by Product, End-user, and Geography - Forecast and Analysis", the market witnessed a YOY growth of 5.70% at a CAGR of 5.83% during the forecast period. The report is segmented by product (back massager, handheld massager, neck and shoulder massager, leg and foot massager, and eye care massager), end-user (commercial and residential), and geography (APAC, North America, Europe, and South America).
For more insights on YOY and CAGR, Read Sample Report
Technavio has announced its latest market research report titled Electric Massager Market by Product, End-user, and Geography - Forecast and Analysis 2021-2025
Vendor Insights
Global Electric Massager Market is fragmented and the vendors are deploying various organic and inorganic growth strategies to compete in the market.
The growing competition in the market is compelling vendors to adopt various growth strategies such as promotional activities and spending on advertisements to improve the visibility of their services. Some vendors are also adopting inorganic growth strategies such as M&As to remain competitive in the market.
The report analyzes the market's competitive landscape and offers information on several market vendors, including:
Beurer GmbH
Casada International GmbH
Hi-Dow International Inc.
HoMedics LLC
JSB Health & Fitness Pvt. Ltd.
Mettler Electronics Corp.
OMRON Corp.
Panasonic Corp.
Prospera Corp.
Zynex Inc.
Find additional highlights on the growth strategies adopted by vendors and their product offerings,
Read Sample Report
.
Geographical Market Analysis
North America will account for 38% of the market's growth. In North America, the United States is the most important market for electric massagers. The market in this region will increase faster than the markets in South America and the Middle East and Africa.
Over the projected period, the rising number of stress-related instances in the world would aid the expansion of the electric massager market in North America.
Furthermore, countries such as the US, UK, China, Germany, and France are expected to emerge as prominent markets for Electric Massager Market during the forecast period.
Know more about this market's geographical distribution along with a detailed analysis of the top regions.
Click Here for Sample Report.
Key Segment Analysis
The back massager segment's share of the electric massager market will expand significantly. The expansion of the back massager is fueled by
the aging population and their demand for frequent healthcare. Working professionals with busy work schedules are becoming increasingly stressed, and sitting at their workstations for lengthy periods of time can result in chronic back discomfort. Back massagers might help you get rid of your back discomfort and aches.
View Sample
:
to know additional highlights and key points on various market segments and their impact in coming years.
Key Market Drivers & Challenges:
The
growing number of stress-related instances around the world will propel the electric massager market to new heights. Stress levels that are rising can hinder a person's leisure and daily activities. This might result in physical deconditioning and muscle weakness, which can lead to back pain. Muscle tension and contraction difficulties might arise as a result of severe chronic stress, putting uneven pressure on the bones and resulting in subluxations. Electric massagers will undoubtedly become more popular in the coming years as these therapeutic effects can be obtained without the usage of medications.
However, the
low penetration of electric massagers in emerging nations will be a major impediment to the growth of the global electric massager industry.
Get a Sample
for highlights
on market Drivers & Challenges affecting the Electric Massager Market.
Customize Your Report
Don't miss out on the opportunity to speak to our analyst and know more insights about this market report. Our analysts can also help you customize this report according to your needs. Our analysts and industry experts will work directly with you to understand your requirements and provide you with customized data in a short amount of time.
Do reach out to our analysts for more customized reports as per your requirements. Speak to an Analyst now!
Related Reports:
Organic Tampons Market by Distribution Channel and Geography - Forecast and Analysis 2022-2026
Cotton Pads Market by Distribution Channel and Geography - Forecast and Analysis 2022-2026
Table of Contents
1 Executive Summary
2 Market Landscape
2.1 Market ecosystem
Exhibit 01: Parent market
Exhibit 02: Market characteristics
2.2 Value chain analysis
Exhibit 03: Value Chain Analysis: Personal Products
3 Market Sizing
3.1 Market definition
Exhibit 04: Offerings of vendors included in the market definition
3.2 Market segment analysis
Exhibit 05: Market segments
3.3 Market size 2020
3.4 Market outlook: Forecast for 2020 - 2025
Exhibit 06: Global - Market size and forecast 2020 - 2025 ($ million)
Exhibit 07: Global market: Year-over-year growth 2020 - 2025 (%)
4 Five Forces Analysis
4.1 Five Forces Summary
Exhibit 08: Five forces analysis 2020 & 2025
4.2 Bargaining power of buyers
Exhibit 09: Bargaining power of buyers
4.3 Bargaining power of suppliers
Exhibit 10: Bargaining power of suppliers
4.4 Threat of new entrants
Exhibit 11: Threat of new entrants
4.5 Threat of substitutes
Exhibit 12: Threat of substitutes
4.6 Threat of rivalry
Exhibit 13: Threat of rivalry
4.7 Market condition
Exhibit 14: Market condition - Five forces 2020
5 Market Segmentation by Product
5.1 Market segments
Exhibit 15: Product - Market share 2020-2025 (%)
5.2 Comparison by Product
Exhibit 16: Comparison by Product
5.3 Back massager - Market size and forecast 2020-2025
Exhibit 17: Back massager - Market size and forecast 2020-2025 ($ million)
Exhibit 18: Back massager - Year-over-year growth 2020-2025 (%)
5.4 Handheld massager - Market size and forecast 2020-2025
Exhibit 19: Handheld massager - Market size and forecast 2020-2025 ($ million)
Exhibit 20: Handheld massager - Year-over-year growth 2020-2025 (%)
5.5 Neck and shoulder massager - Market size and forecast 2020-2025
Exhibit 21: Neck and shoulder massager - Market size and forecast 2020-2025 ($ million)
Exhibit 22: Neck and shoulder massager - Year-over-year growth 2020-2025 (%)
5.6 Leg and foot massager - Market size and forecast 2020-2025
Exhibit 23: Leg and foot massager - Market size and forecast 2020-2025 ($ million)
Exhibit 24: Leg and foot massager - Year-over-year growth 2020-2025 (%)
5.7 Eye care massager - Market size and forecast 2020-2025
Exhibit 25: Eye care massager - Market size and forecast 2020-2025 ($ million)
Exhibit 26: Eye care massager - Year-over-year growth 2020-2025 (%)
5.8 Market opportunity by Product
Exhibit 27: Market opportunity by Product
6 Market Segmentation by End-user
6.1 Market segments
Exhibit 28: End-user - Market share 2020-2025 (%)
6.2 Comparison by End-user
Exhibit 29: Comparison by End-user
6.3 Commercial - Market size and forecast 2020-2025
Exhibit 30: Commercial - Market size and forecast 2020-2025 ($ million)
Exhibit 31: Commercial - Year-over-year growth 2020-2025 (%)
6.4 Residential - Market size and forecast 2020-2025
Exhibit 32: Residential - Market size and forecast 2020-2025 ($ million)
Exhibit 33: Residential - Year-over-year growth 2020-2025 (%)
6.5 Market opportunity by End-user
Exhibit 34: Market opportunity by End-user
7 Customer landscape
8 Geographic Landscape
8.1 Geographic segmentation
Exhibit 36: Market share by geography 2020-2025 (%)
8.2 Geographic comparison
Exhibit 37: Geographic comparison
8.3 North America - Market size and forecast 2020-2025
Exhibit 38: North America - Market size and forecast 2020-2025 ($ million)
Exhibit 39: North America - Year-over-year growth 2020-2025 (%)
8.4 Europe - Market size and forecast 2020-2025
Exhibit 40: Europe - Market size and forecast 2020-2025 ($ million)
Exhibit 41: Europe - Year-over-year growth 2020-2025 (%)
8.5 APAC - Market size and forecast 2020-2025
Exhibit 42: APAC - Market size and forecast 2020-2025 ($ million)
Exhibit 43: APAC - Year-over-year growth 2020-2025 (%)
8.6 South America - Market size and forecast 2020-2025
Exhibit 44: South America - Market size and forecast 2020-2025 ($ million)
Exhibit 45: South America - Year-over-year growth 2020-2025 (%)
8.7 MEA - Market size and forecast 2020-2025
Exhibit 46: MEA - Market size and forecast 2020-2025 ($ million)
Exhibit 47: MEA - Year-over-year growth 2020-2025 (%)
8.8 Key leading countries
Exhibit 48: Key leading countries
8.9 Market opportunity by geography
9 Drivers, Challenges, and Trends
9.1 Market drivers
9.2 Market challenges
Exhibit 50: Impact of drivers and challenges
9.3 Market trends
10 Vendor Landscape
10.1 Overview
Exhibit 51: Vendor landscape
10.2 Landscape disruption
Exhibit 52: Landscape disruption
Exhibit 53: Industry risks
11 Vendor Analysis
11.1 Vendors covered
Exhibit 54: Vendors covered
11.2 Market positioning of vendors
Exhibit 55: Market positioning of vendors
11.3 Beurer GmbH
Exhibit 56: Beurer GmbH - Overview
Exhibit 57: Beurer GmbH - Product and service
Exhibit 58: Beurer GmbH - Key offerings
11.4 Casada International GmbH
Exhibit 59: Casada International GmbH - Overview
Exhibit 60: Casada International GmbH - Product and service
Exhibit 61: Casada International GmbH - Key offerings
11.5 Hi-Dow International Inc.
Exhibit 62: Hi-Dow International Inc. - Overview
Exhibit 63: Hi-Dow International Inc. - Product and service
Exhibit 64: Hi-Dow International Inc. - Key offerings
11.6 HoMedics LLC
Exhibit 65: HoMedics LLC - Overview
Exhibit 66: HoMedics LLC - Product and service
Exhibit 67: HoMedics LLC - Key offerings
11.7 JSB Health & Fitness Pvt. Ltd.
Exhibit 68: JSB Health & Fitness Pvt. Ltd. - Overview
Exhibit 69: JSB Health & Fitness Pvt. Ltd. - Product and service
Exhibit 70: JSB Health & Fitness Pvt. Ltd. - Key offerings
11.8 Mettler Electronics Corp.
Exhibit 71: Mettler Electronics Corp. - Overview
Exhibit 72: Mettler Electronics Corp. - Product and service
Exhibit 73: Mettler Electronics Corp. - Key offerings
11.9 OMRON Corp.
Exhibit 74: OMRON Corp. - Overview
Exhibit 75: OMRON Corp. - Business segments
Exhibit 76: OMRON Corp. - Key offerings
Exhibit 77: OMRON Corp. - Segment focus
11.10 Panasonic Corp.
Exhibit 78: Panasonic Corp. - Overview
Exhibit 79: Panasonic Corp. - Business segments
Exhibit 80: Panasonic Corp. - Key offerings
Exhibit 81: Panasonic Corp. - Segment focus
11.11 Prospera Corp.
Exhibit 82: Prospera Corp. - Overview
Exhibit 83: Prospera Corp. - Product and service
Exhibit 84: Prospera Corp. - Key offerings
11.12 Zynex Inc.
Exhibit 85: Zynex Inc. - Overview
Exhibit 86: Zynex Inc. - Product and service
Exhibit 87: Zynex Inc. - Key news
Exhibit 88: Zynex Inc. - Key offerings
12 Appendix
12.1 Scope of the report
12.2 Currency conversion rates for US$
Exhibit 89: Currency conversion rates for US$
12.3 Research methodology
Exhibit 90: Research Methodology
Exhibit 91: Validation techniques employed for market sizing
Exhibit 92: Information sources
12.4 List of abbreviations
Exhibit 93: List of abbreviations
About Us:
Technavio is a leading global technology research and advisory company. Their research and analysis focus on emerging market trends and provides actionable insights to help businesses identify market opportunities and develop effective strategies to optimize their market positions. With over 500 specialized analysts, Technavio's report library consists of more than 17,000 reports and counting, covering 800 technologies, spanning across 50 countries. Their client base consists of enterprises of all sizes, including more than 100 Fortune 500 companies. This growing client base relies on Technavio's comprehensive coverage, extensive research, and actionable market insights to identify opportunities in existing and potential markets and assess their competitive positions within changing market scenarios.
Contact
Technavio Research
Jesse Maida
Media & Marketing Executive
US: +1 844 364 1100
UK: +44 203 893 3200
Email: [email protected]
Website:
SOURCE Technavio
22 Jun 2022
NEW YORK, June 21, 2022 /PRNewswire/ -- According to the research report "
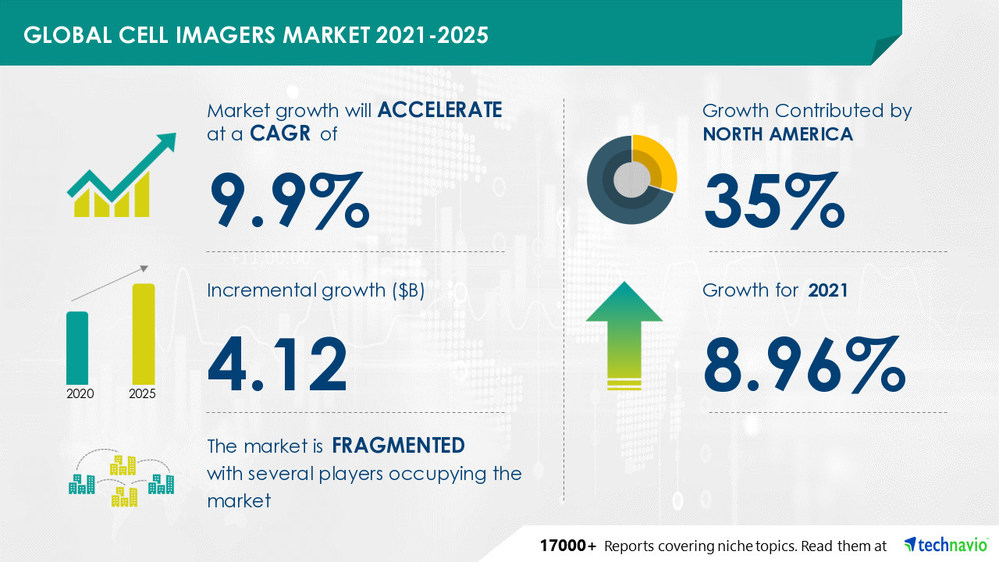
Cell Imagers Market by Product and Geography - Forecast and Analysis", the market witnessed a YOY growth of 8.96% at a CAGR of 9.9% during the forecast period. The report is segmented by
product (equipment, consumables, and software) and geography (North America, Europe, Asia, and ROW).
For more insights on YOY and CAGR, Read Sample Report
Technavio has announced its latest market research report titled Cell Imagers Market by Product and Geography - Forecast and Analysis 2021-2025
Vendor Insights
The global Cell Imagers Market is fragmented and the vendors are deploying various organic and inorganic growth strategies to compete in the market.
The growing competition in the market is compelling vendors to adopt various growth strategies such as promotional activities and spending on advertisements to improve the visibility of their services. Some vendors are also adopting inorganic growth strategies such as M&As to remain competitive in the market.
The report analyzes the market's competitive landscape and offers information on several market vendors, including:
Becton, Dickinson and Co.
Bio-Rad Laboratories Inc.
Carl Zeiss AG
General Electric Co.
Leica Microsystems
Merck KGaA
Olympus Corp.
PerkinElmer Inc.
Sartorius AG
Thermo Fisher Scientific Inc.
Find additional highlights on the growth strategies adopted by vendors and their product offerings,
Read Sample Report
.
Geographical Market Analysis
North America will account for 35% of market growth. The two biggest markets in North America for cell imagers are the US and Canada. This region's market will grow more slowly than the markets in any other regions.
Over the projected period, the prevalence of chronic diseases will rise, and the pharmaceutical and biotechnology industries will expand. These factors will support the expansion of the North American cell imagers market.
Furthermore, countries such as the US, Germany, Japan, UK, and Canada are expected to emerge as prominent markets for Cell Imagers Market during the forecast period.
Know more about this market's geographical distribution along with a detailed analysis of the top regions.
Click here to get a sample report.
Key Segment Analysis
The equipment segment's market share growth for cell imagers will be strong. Standard microscopes, confocal microscopes, cutting-edge fluorescence microscopes, and image capture tools are some of the instruments used in cell imaging. These systems do not need to be connected to a computer. The need for cell imaging equipment is primarily driven by extensive microscopy research, high-resolution solutions offered by various pieces of equipment, and equipment modification based on end-user preferences.
View Sample
:
to know additional highlights and key points on various market segments and their impact in coming years.
Key Market Drivers & Challenges:
A significant element influencing the rise of the worldwide cell imagers market share is the rising prevalence of chronic diseases. Some of the most important steps that can help prevent chronic diseases include regular health examinations, early disease screenings, and appropriate treatment planning. In order to improve processes and better comprehend the metastatic process, specifically to grasp the dynamics and adaptability of dissolving cancer cells, these techniques are being applied more and more in the research of animal cells.
However, the technical and economic challenges of super-resolution will be a major challenge for the global cell imagers market share growth.
Get a Sample
for highlights
on market Drivers & Challenges affecting the Cell Imagers Market.
Customize Your Report
Don't miss out on the opportunity to speak to our analyst and know more insights about this market report. Our analysts can also help you customize this report according to your needs. Our analysts and industry experts will work directly with you to understand your requirements and provide you with customized data in a short amount of time.
Do reach out to our analysts for more customized reports as per your requirements.
Speak to an analyst now!
Related Reports:
Rare Hemophilia Factors Market by Method and Geography - Forecast and Analysis 2022-2026
Obsessive-Compulsive Disorder Drugs Market by Product and Geography - Forecast and Analysis 2022-2026
Table of Contents
1 Executive Summary
2 Market Landscape
2.1 Market ecosystem
Exhibit 01: Parent market
Exhibit 02: Market characteristics
2.2 Value chain analysis
Exhibit 03: Value chain analysis: Pharmaceuticals Market
3 Market Sizing
3.1 Market definition
Exhibit 04: Offerings of vendors included in the market definition
3.2 Market segment analysis
Exhibit 05: Market segments
3.3 Market size 2020
3.4 Market outlook: Forecast for 2020 - 2025
Exhibit 06: Global - Market size and forecast 2020 - 2025 ($ million)
Exhibit 07: Global market: Year-over-year growth 2020 - 2025 (%)
4 Five Forces Analysis
4.1 Five forces summary
Exhibit 08: Five forces analysis 2020 & 2025
4.2 Bargaining power of buyers
Exhibit 09: Bargaining power of buyers
4.3 Bargaining power of suppliers
Exhibit 10: Bargaining power of suppliers
4.4 Threat of new entrants
Exhibit 11: Threat of new entrants
4.5 Threat of substitutes
Exhibit 12: Threat of substitutes
4.6 Threat of rivalry
Exhibit 13: Threat of rivalry
4.7 Market condition
Exhibit 14: Market condition - Five forces 2020
5 Market Segmentation by Product
5.1 Market segments
Exhibit 15: Product - Market share 2020-2025 (%)
5.2 Comparison by Product
Exhibit 16: Comparison by Product
5.3 Equipment - Market size and forecast 2020-2025
Exhibit 17: Equipment - Market size and forecast 2020-2025 ($ million)
Exhibit 18: Equipment - Year-over-year growth 2020-2025 (%)
5.4 Consumables - Market size and forecast 2020-2025
Exhibit 19: Consumables - Market size and forecast 2020-2025 ($ million)
Exhibit 20: Consumables - Year-over-year growth 2020-2025 (%)
5.5 Software - Market size and forecast 2020-2025
Exhibit 21: Software - Market size and forecast 2020-2025 ($ million)
Exhibit 22: Software - Year-over-year growth 2020-2025 (%)
5.6 Market opportunity by Product
Exhibit 23: Market opportunity by Product
6 Customer Landscape
7 Geographic Landscape
7.1 Geographic segmentation
Exhibit 25: Market share by geography 2020-2025 (%)
7.2 Geographic comparison
Exhibit 26: Geographic comparison
7.3 North America - Market size and forecast 2020-2025
Exhibit 27: North America - Market size and forecast 2020-2025 ($ million)
Exhibit 28: North America - Year-over-year growth 2020-2025 (%)
7.4 Europe - Market size and forecast 2020-2025
Exhibit 29: Europe - Market size and forecast 2020-2025 ($ million)
Exhibit 30: Europe - Year-over-year growth 2020-2025 (%)
7.5 Asia - Market size and forecast 2020-2025
Exhibit 31: Asia - Market size and forecast 2020-2025 ($ million)
Exhibit 32: Asia - Year-over-year growth 2020-2025 (%)
7.6 ROW - Market size and forecast 2020-2025
Exhibit 33: ROW - Market size and forecast 2020-2025 ($ million)
Exhibit 34: ROW - Year-over-year growth 2020-2025 (%)
7.7 Key leading countries
Exhibit 35: Key leading countries
7.8 Market opportunity by geography
Exhibit 36: Market opportunity by geography ($ million)
8 Drivers, Challenges, and Trends
8.1 Market drivers
8.2 Market challenges
Exhibit 37: Impact of drivers and challenges
8.3 Market trends
9 Vendor Landscape
9.1 Vendor Landscape
Exhibit 38: Vendor landscape
9.2 Landscape disruption
Exhibit 39: Landscape disruption
Exhibit 40: Industry risks
10 Vendor Analysis
10.1 Vendors covered
Exhibit 41: Vendors covered
10.2 Market positioning of vendors
Exhibit 42: Market positioning of vendors
10.3 Becton, Dickinson and Co.
Exhibit 43: Becton, Dickinson and Co. - Overview
Exhibit 44: Becton, Dickinson and Co. - Business segments
Exhibit 45: Becton, Dickinson and Co. – Key news
Exhibit 46: Becton, Dickinson and Co. - Key offerings
Exhibit 47: Becton, Dickinson and Co. - Segment focus
10.4 Bio-Rad Laboratories Inc.
Exhibit 48: Bio-Rad Laboratories Inc. - Overview
Exhibit 49: Bio-Rad Laboratories Inc. - Business segments
Exhibit 50: Bio-Rad Laboratories Inc. – Key news
Exhibit 51: Bio-Rad Laboratories Inc. - Key offerings
Exhibit 52: Bio-Rad Laboratories Inc. - Segment focus
10.5 Carl Zeiss AG
10.6 General Electric Co.
Exhibit 58: General Electric Co. - Overview
Exhibit 59: General Electric Co. - Business segments
Exhibit 60: General Electric Co.– Key news
Exhibit 61: General Electric Co. - Key offerings
Exhibit 62: General Electric Co. - Segment focus
10.7 Leica Microsystems
Exhibit 63: Leica Microsystems - Overview
Exhibit 64: Leica Microsystems - Product and service
Exhibit 65: Leica Microsystems – Key news
Exhibit 66: Leica Microsystems - Key offerings
10.8 Merck KGaA
Exhibit 67: Merck KGaA - Overview
Exhibit 68: Merck KGaA - Business segments
Exhibit 69: Merck KGaA– Key news
Exhibit 70: Merck KGaA - Key offerings
Exhibit 71: Merck KGaA - Segment focus
10.9 Olympus Corp.
Exhibit 72: Olympus Corp. - Overview
Exhibit 73: Olympus Corp. - Business segments
Exhibit 74: Olympus Corp. – Key news
Exhibit 75: Olympus Corp. - Key offerings
Exhibit 76: Olympus Corp. - Segment focus
10.10 PerkinElmer Inc.
Exhibit 77: PerkinElmer Inc. - Overview
Exhibit 78: PerkinElmer Inc. - Business segments
Exhibit 79: PerkinElmer Inc. – Key news
Exhibit 80: PerkinElmer Inc. - Key offerings
Exhibit 81: PerkinElmer Inc. - Segment focus
10.11 Sartorius AG
Exhibit 82: Sartorius AG - Overview
Exhibit 83: Sartorius AG - Business segments
Exhibit 84: Sartorius AG – Key news
Exhibit 85: Sartorius AG - Key offerings
Exhibit 86: Sartorius AG - Segment focus
10.12 Thermo Fisher Scientific Inc.
Exhibit 87: Thermo Fisher Scientific Inc. - Overview
Exhibit 88: Thermo Fisher Scientific Inc. - Business segments
Exhibit 89: Thermo Fisher Scientific Inc.– Key news
Exhibit 90: Thermo Fisher Scientific Inc. - Key offerings
Exhibit 91: Thermo Fisher Scientific Inc. - Segment focus
11 Appendix
11.1 Scope of the report
11.2 Currency conversion rates for US$
Exhibit 92: Currency conversion rates for US$
11.3 Research methodology
Exhibit 93: Research Methodology
Exhibit 94: Validation techniques employed for market sizing
Exhibit 95: Information sources
11.4 List of abbreviations
Exhibit 96: List of abbreviations
About Us:
Technavio is a leading global technology research and advisory company. Their research and analysis focus on emerging market trends and provides actionable insights to help businesses identify market opportunities and develop effective strategies to optimize their market positions. With over 500 specialized analysts, Technavio's report library consists of more than 17,000 reports and counting, covering 800 technologies, spanning across 50 countries. Their client base consists of enterprises of all sizes, including more than 100 Fortune 500 companies. This growing client base relies on Technavio's comprehensive coverage, extensive research, and actionable market insights to identify opportunities in existing and potential markets and assess their competitive positions within changing market scenarios.
Contact
Technavio Research
Jesse Maida
Media & Marketing Executive
US: +1 844 364 1100
UK: +44 203 893 3200
Email: [email protected]
Website:
SOURCE Technavio
100 Deals associated with Don't Just Sit There Sell Something Ltd.
Login to view more data
100 Translational Medicine associated with Don't Just Sit There Sell Something Ltd.
Login to view more data
Corporation Tree
Boost your research with our corporation tree data.
login
or

Pipeline
Pipeline Snapshot as of 06 Oct 2024
No data posted
Login to keep update
Deal
Boost your decision using our deal data.
login
or

Translational Medicine
Boost your research with our translational medicine data.
login
or

Profit
Explore the financial positions of over 360K organizations with Synapse.
login
or

Grant & Funding(NIH)
Access more than 2 million grant and funding information to elevate your research journey.
login
or

Investment
Gain insights on the latest company investments from start-ups to established corporations.
login
or

Financing
Unearth financing trends to validate and advance investment opportunities.
login
or

Chat with Hiro
Get started for free today!
Accelerate Strategic R&D decision making with Synapse, PatSnap’s AI-powered Connected Innovation Intelligence Platform Built for Life Sciences Professionals.
Start your data trial now!
Synapse data is also accessible to external entities via APIs or data packages. Empower better decisions with the latest in pharmaceutical intelligence.
Bio
Bio Sequences Search & Analysis
Sign up for free
Chemical
Chemical Structures Search & Analysis
Sign up for free