Request Demo
Last update 29 Aug 2025

Fabric Genomics, Inc.
Last update 29 Aug 2025
Overview
Related
100 Clinical Results associated with Fabric Genomics, Inc.
Login to view more data
0 Patents (Medical) associated with Fabric Genomics, Inc.
Login to view more data
13
Literatures (Medical) associated with Fabric Genomics, Inc.01 Dec 2024·AMERICAN JOURNAL OF HUMAN GENETICS
Prequalification of genome-based newborn screening for severe childhood genetic diseases through federated training based on purifying hyperselection
Article
Author: Guidugli, Lucia ; Hansen, Christian ; Sanford, Erica ; Cao, Bryant ; Baker, Mei ; Hall, Kevin P ; Feigenbaum, Annette ; Schleit, Jennifer ; Wright, Meredith ; Liang, Yupu ; Chambers, Christina ; Moore, Barry ; Willis, Mary J ; Kunard, Chris M ; Batalov, Sergey ; Kiel, Mark ; Ellsworth, Katarzyna ; Protopsaltis, Liana ; Ontiveros, Eric ; Smith, Laurie D ; Shelnutt, Seth ; Yandell, Mark ; Defay, Thomas ; Schwartz, Steve ; Van Der Kraan, Lucita ; Owen, Mallory J ; Krilow, Chad ; Blincow, Eric ; Reimers, Rebecca ; Wigby, Kristen ; Mowrey, William R ; Lefebvre, Sebastien ; Olsen, Lauren ; Oh, Danny ; Caylor, Sara ; Mardach, Rebecca ; Bainbridge, Matthew ; Madhavrao, Lakshminarasimha ; Scharer, Gunter ; Mehtalia, Shyamal S ; Leipzig, Jeremy ; Kwon, Hugh ; Kingsmore, Stephen F ; Oriol, Albert ; Frise, Erwin
Genome-sequence-based newborn screening (gNBS) has substantial potential to improve outcomes in hundreds of severe childhood genetic disorders (SCGDs). However, a major impediment to gNBS is imprecision due to variants classified as pathogenic (P) or likely pathogenic (LP) that are not SCGD causal. gNBS with 53,855 P/LP variants, 342 genes, 412 SCGDs, and 1,603 therapies was positive in 74% of UK Biobank (UKB470K) adults, suggesting 97% false positives. We used the phenomenon of purifying hyperselection, which acts to decrease the frequency of SCGD causal diplotypes, to reduce false positives. Training of gene-disease-inheritance mode-diplotype tetrads in 618,290 control and affected subjects identified 293 variants or haplotypes and seven genes with variable inheritance contributing higher positive diplotype counts than consistent with purifying hyperselection and with little or no evidence of SCGD causality. With these changes, 2.0% of UKB470K adults were positive. In contrast, gNBS was positive in 7.2% of 3,118 critically ill children with suspected SCGDs and 7.9% of 705 infant deaths. When compared with rapid diagnostic genome sequencing (RDGS), gNBS had 99.1% recall. In eight true-positive children, gNBS was projected to decrease time to diagnosis by a median of 121 days and avoid life-threatening disease presentations in four children, organ damage in six children, ∼$1.25 million in healthcare cost, and ten (1.4%) infant deaths. Federated training predicated on purifying hyperselection provides a general framework to attain high precision in population screening. Federated training across many biobanks and clinical trials can provide a privacy-preserving mechanism for qualification of gNBS in diverse genetic ancestries.
01 Dec 2023·Nature Methods
Author Correction: Mapping the genomic landscape of CRISPR–Cas9 cleavage
Author: Young, Joshua K ; Lau, Elaine ; Gradia, Scott ; May, Andrew P ; Lied, Alexandra M ; Settle, Alexander H ; Donohoue, Paul D ; Cigan, Mark ; Cameron, Peter ; Carter, Matthew M ; Capurso, Daniel ; Edwards, Leslie S ; Jones, Brittnee N ; Garner, Elizabeth ; Banh, Lynda M ; Fuller, Chris K ; Thompson, Matthew S ; Slorach, Euan M ; Vidal, Bastien ; Llaca, Victor ; Deschamps, Stéphane
01 Jun 2023·American journal of human genetics
Response to Grosse et al.
Letter
Author: Guidugli, Lucia ; Ellsworth, Katarzyna ; Mowrey, William R ; Hall, Kevin P ; Le, Jennie ; Smith, Laurie D ; Kiel, Mark ; Dimmock, David P ; Kwon, Yong H ; Caylor, Sara ; Kunard, Chris M ; Shelnutt, Seth ; Bainbridge, Matthew ; Wolen, Aaron R ; Owen, Mallory J ; Schwartz, Steve ; Wigby, Kristen ; Batalov, Sergey ; Tokita, Mari ; Del Angel, Guillermo ; Rosales, Edwin ; Lefebvre, Sebastien ; Ding, Yan ; Hobbs, Charlotte A ; Mardach, Rebecca ; Scharer, Gunter ; Kingsmore, Stephen F ; Chambers, Christina ; Hansen, Christian ; Green, Robert C ; Defay, Thomas ; Oh, Danny ; Feigenbaum, Annette ; Tran, Duke ; Benson, Wendy ; Reese, Martin G ; Willis, Mary J ; Van Der Kraan, Lucita ; Blincow, Eric ; Powley, George ; Kahn, Scott D ; Papadopoulos, Stavros ; Krilow, Chad ; Sanford, Erica ; Madhavrao, Lakshminarasimha ; Veeraraghavan, Narayanan ; Mehtalia, Shyamal S ; Perry, James ; Frise, Erwin ; Oriol, Albert ; Wright, Meredith
32
News (Medical) associated with Fabric Genomics, Inc.29 Jul 2025
GAITHERSBURG, Md.--(BUSINESS WIRE)--GeneDx Holdings Corp. (Nasdaq: WGS), a leader in delivering improved health outcomes through genomic insights, today reported its financial results for the second quarter of 2025.
“Crossing the $100 million revenue mark and delivering our fourth consecutive profitable quarter is a major milestone for GeneDx, putting us on a path for more growth at scale and enabling us to reach more patients while reducing unnecessary spend across the global healthcare system,” said Katherine Stueland, CEO of GeneDx. “Our strong second quarter performance was driven by our core business, underscoring its strength and resilience. These results, coupled with the ever-expanding opportunities ahead, including general pediatrics, demonstrate that we’re just beginning to deliver on the promise of how our technology can fundamentally change the way genomics can inform healthcare, shifting from reactive to proactive care.”
Second Quarter 2025 Financial Results (Unaudited)1,2
Revenues
Revenues grew to $102.7 million, an increase of 49% year-over-year.
Exome and genome test revenue grew to $85.9 million, an increase of 69% year-over-year.
Exome and genome volume
Exome and genome test results volume grew to 23,102, an increase of 28% year-over-year.
Exome and genome represented 41% of all tests, up from 31% in the second quarter of 2024.
Gross margin
Adjusted gross margin expanded to 71%, up from 62% in the second quarter of 2024. Total GAAP gross margin was 69%.
Total GAAP gross margin was 69%.
Operating expenses
Adjusted total operating expenses were $57.8 million, representing 56% of revenue in the second quarter of 2025, compared to 65% of revenue in the second quarter of 2024. Total GAAP operating expenses were $61.9 million.
Total GAAP operating expenses were $61.9 million.
Net Income
Adjusted net income was $15.0 million compared to an adjusted net loss of $2.0 million in the second quarter of 2024. GAAP net income was $10.8 million.
GAAP net income was $10.8 million.
Cash position
Cash, cash equivalents, marketable securities and restricted cash was $135.5 million as of June 30, 2025.
Cash flow for the second quarter 2025 primarily included: $33.2 million used to acquire Fabric Genomics, net of cash acquired, partially offset by; $10.4 million in cash generated from operations.
$33.2 million used to acquire Fabric Genomics, net of cash acquired, partially offset by;
$10.4 million in cash generated from operations.
1.
Revenue and adjusted gross margin growth rates exclude revenue and costs of sales from the exited Legacy Sema4 diagnostic testing business.
2.
Adjusted gross margin, adjusted total operating expenses and adjusted net income/(loss) are non-GAAP financial measures. See appendix for a reconciliation of GAAP to Non-GAAP figures presented.
GeneDx Full Year 2025 Guidance
GeneDx has raised certain elements of its full year 2025 guidance and expects to deliver:
Metric
Previous Guidance
Updated Guidance
Revenue
$360 to $375 million
$400 to $415 million
Growth in exome and genome revenue
30%
48% to 52%
Growth in exome and genome volume
30%
30%
Adjusted gross margin
66% to 68%
68% to 71%
Adjusted net income
Positive each quarter and for full year
Positive each quarter and for full year
Second Quarter 2025 and Recent Business Highlights
Strategic Expansion and Market Access
Announced that the American Academy of Pediatrics now recommends exome and genome sequencing as first-tier tests for children with global developmental delay or intellectual disability, positioning pediatricians to offer exome and genome testing to their patients.
Expanded commercial focus to include calling on providers treating children with inborn errors of immunity (IEI) , a group of nearly 500 genetic disorders that impair immune function.
Accelerated adoption of exome and genome sequencing coverage by state Medicaid programs, bringing the total states covering exome or genome sequencing in the pediatric outpatient setting to 35 with the recent addition of Colorado and Maine, and the total states covering rapid genome sequencing in the neonatal intensive care unit (NICU) to 17 with the recent addition of Virginia, Ohio, and Oklahoma.
Innovation & Clinical Leadership
Acquired Fabric Genomics , enabling a hybrid centralized and decentralized model for delivering genomic insights globally.
Published SeqFirst study in the Journal of Pediatrics , showing rapid genomic testing reduced time to diagnosis from about 10 months to 13 days.
Published data in the American Journal of Medical Genetics underscoring GeneDx’s leadership in leveraging artificial intelligence (AI) to increase diagnostic yield and improve healthcare for patients with genetic conditions.
Webcast and Conference Call Details
GeneDx will host a conference call today, July 29, 2025, at 8:30 a.m. Eastern Time. Investors interested in listening to the conference call are required to register online. A live and archived webcast of the event will be available on the “Events” section of the GeneDx investor relations website at https://ir.genedx.com/.
Forward-Looking Statements
This press release contains certain forward-looking statements within the meaning of the federal securities laws, including statements regarding our future performance, future operations, plans, objectives of management, and our market opportunity, including our expected full year 2025 reported revenue, volume, adjusted gross margin and adjusted net income. These forward-looking statements generally are identified by the words “believe,” “project,” “expect,” “anticipate,” “estimate,” “intend,” “strategy,” “future,” “opportunity,” “plan,” “may,” “should,” “will,” “would,” “will be,” “will continue,” “will likely result,” and similar expressions. Forward-looking statements are predictions, projections and other statements about future events that are based on current expectations and assumptions and, as a result, are subject to risks and uncertainties. Many factors could cause actual future events to differ materially from the forward-looking statements in this press release, including but not limited to: (i) our ability to implement business plans, goals and forecasts, and identify and realize additional opportunities, (ii) the risk of downturns and a changing regulatory landscape in the highly competitive healthcare industry, (iii) the size and growth of the market in which we operate, (iv) our ability to pursue our new strategic direction, and (v) our ability to utilize our artificial intelligence tools that we use in our clinical interpretation platform. The foregoing list of factors is not exhaustive. You should carefully consider the foregoing factors and the other risks and uncertainties described in the “Risk Factors” sections of our Annual Report on Form 10-K for the fiscal year ended December 31, 2024, filed with the U.S. Securities and Exchange Commission (the “SEC”) on February 20, 2025, and our Quarterly Reports on Form 10-Q for the quarters ended March 31, 2025 and June 30, 2025, filed with the SEC on April 30, 2025 and July 29, 2025, respectively, and other documents filed by us from time to time with the SEC. These filings identify and address other important risks and uncertainties that could cause actual events and results to differ materially from those contained in the forward-looking statements. Forward-looking statements speak only as of the date they are made. Readers are cautioned not to put undue reliance on forward-looking statements, and we assume no obligation and do not intend to update or revise these forward-looking statements, whether as a result of new information, future events, or otherwise. We do not give any assurance that we will achieve our expectations.
About GeneDx
At GeneDx (Nasdaq: WGS), we believe that everyone deserves personalized, targeted medical care—and that it all begins with a genetic diagnosis. Fueled by one of the world’s largest rare disease data sets, our industry-leading exome and genome tests translate complex genomic data into clinical answers that unlock personalized health plans, accelerate drug discovery, and improve health system efficiencies. For more information, please visit genedx.com and connect with us on LinkedIn, Facebook, and Instagram.
Volume & Revenue 1
2Q25
1Q25
4Q24
3Q24
2Q24
Volumes
Whole exome, whole genome
23,102
20,562
20,676
19,262
18,017
Hereditary cancer
2,677
2,725
3,486
4,672
5,482
Other panels
29,894
28,228
30,115
35,095
34,204
Total
55,673
51,515
54,277
59,029
57,703
Revenue ($ millions)
Whole exome, whole genome
$
85.9
$
71.4
$
78.8
$
60.0
$
50.7
Hereditary cancer
1.8
2.2
2.8
3.3
3.8
Other panels
12.1
12.1
12.3
13.8
13.3
Data information
2.0
1.4
1.4
(0.5
)
1.1
Fabric Genomics
0.9
—
—
—
—
Total
$
102.7
$
87.1
$
95.3
$
76.6
$
68.9
Excludes volume and revenue from the exited Legacy Sema4 diagnostic testing business.
Unaudited Select Financial Information (in thousands)
Three months ended June 30, 2025
Three months ended June 30, 2024
GeneDx
Other1
Total
GeneDx
Other1
Total
Revenue
$
101,784
$
908
$
102,692
$
68,924
$
1,590
$
70,514
Adjusted cost of services
29,964
244
30,208
26,523
145
26,668
Adjusted gross profit (loss)
$
71,820
$
664
$
72,484
$
42,401
$
1,445
$
43,846
Adjusted gross margin %
70.6
%
73.1
%
70.6
%
61.5
%
90.9
%
62.2
%
Other includes revenue and cost of services from the Legacy Sema4 diagnostic testing business for both periods presented. For the three months ended June 30, 2025, Other includes revenue and cost of services from Fabric Genomics.
Three months ended June 30, 2025
Reported
Depreciation and amortization
Stock-based compensation expense
Restructuring costs
Change in FV of financial liabilities
Other
Adjusted
Diagnostic test revenue
$
99,823
$
—
$
—
$
—
$
—
$
—
$
99,823
Other revenue
2,869
—
—
—
—
—
2,869
Total revenue
102,692
—
—
—
—
—
102,692
Cost of services
31,790
(1,389
)
(193
)
—
—
—
30,208
Gross profit (loss)
70,902
1,389
193
—
—
—
72,484
Gross margin
69.0
%
70.6
%
Research and development
15,079
(209
)
(1,422
)
—
—
—
13,448
Selling and marketing
19,448
(1,298
)
(1,268
)
—
—
—
16,882
General and administrative
27,415
(3,295
)
(4,930
)
(73
)
—
8,342
27,459
Loss from operations
8,960
6,191
7,813
73
—
(8,342
)
14,695
Interest income (expense), net
(817
)
—
—
—
—
817
—
Other income (expense), net
2,420
—
—
—
(2,181
)
49
288
Income tax benefit
246
—
—
—
—
(246
)
—
Net income
$
10,809
$
6,191
$
7,813
$
73
$
(2,181
)
$
(7,722
)
$
14,983
Basic earnings per share*
$
0.38
$
0.52
Diluted earnings per share*
$
0.36
$
0.50
* Basic and diluted earnings per share are calculated based on 28,579,704 and 29,753,933 weighted average shares outstanding for the three months ended June 30, 2025, respectively.
Three months ended June 30, 2024
Reported
Depreciation and amortization
Stock-based compensation expense
Restructuring costs
Change in FV of financial liabilities
Other1
Adjusted
Diagnostic test revenue
$
69,439
$
—
$
—
$
—
$
—
$
—
$
69,439
Other revenue
1,075
—
—
—
—
—
1,075
Total revenue
70,514
—
—
—
—
—
70,514
Cost of services
27,562
(808
)
(86
)
—
—
—
26,668
Gross profit (loss)
42,952
808
86
—
—
—
43,846
Gross margin
60.9
%
62.2
%
Research and development
10,902
(211
)
(347
)
(35
)
—
—
10,309
Selling and marketing
16,585
(1,225
)
(368
)
(63
)
—
—
14,929
General and administrative
26,044
(2,974
)
(2,307
)
(150
)
—
—
20,613
Loss from operations
(10,579
)
5,218
3,108
248
—
—
(2,005
)
Interest income (expense), net
(894
)
—
—
—
—
894
—
Other income (expense), net
(17,890
)
—
—
—
4,409
13,450
(31
)
Income tax benefit
190
—
—
—
—
(190
)
—
Net loss
$
(29,173
)
$
5,218
$
3,108
$
248
$
4,409
$
14,154
$
(2,036
)
Basic loss per share*
$
(1.10
)
$
(0.08
)
Diluted loss per share*
$
(1.10
)
$
(0.08
)
* Basic and diluted loss per share are calculated based on 26,617,955 diluted weighted average shares outstanding for the three months ended June 30, 2024.
Other represents interest expense, net, and income tax (expense) benefit for all periods presented. Other for the three months ended June 30, 2025 includes transaction costs related to the acquisition of Fabric Genomics. Other for the three months ended June 30, 2024 includes legal costs related to a legal settlement.
GeneDx Holdings Corp.
Condensed Consolidated Balance Sheets
(in thousands, except share and per share amounts)
June 30, 2025 (Unaudited)
December 31, 2024
Assets:
Current assets:
Cash and cash equivalents
$
74,120
$
85,212
Marketable securities
60,438
55,973
Accounts receivable
48,028
37,629
Inventory, net
11,932
10,650
Prepaid expenses and other current assets
10,319
8,504
Total current assets
204,837
197,968
Operating lease right-of-use assets
24,978
25,613
Property and equipment, net
40,120
32,893
Goodwill
12,926
—
Intangible assets, net
176,689
158,600
Other assets1
4,313
4,306
Total assets
$
463,863
$
419,380
Liabilities and Stockholders’ Equity:
Current liabilities:
Accounts payable and accrued expenses
$
49,239
$
30,983
Short-term lease liabilities
3,083
3,336
Other current liabilities
19,084
20,498
Total current liabilities
71,406
54,817
Long-term debt, net of current portion
51,683
51,913
Long-term lease liabilities
59,619
60,919
Other liabilities
3,275
5,519
Deferred taxes
747
965
Total liabilities
186,730
174,133
Stockholders’ Equity:
Preferred stock
—
—
Class A common stock
2
2
Additional paid-in capital
1,624,513
1,596,889
Accumulated deficit
(1,348,194
)
(1,352,474
)
Accumulated other comprehensive income
812
830
Total stockholders’ equity
277,133
245,247
Total liabilities and stockholders’ equity
$
463,863
$
419,380
Other assets includes $990 thousand of restricted cash as of both June 30, 2025 and December 31, 2024.
GeneDx Holdings Corp.
Condensed Consolidated Statements of Operations (Unaudited)
(in thousands, except share and per share amounts)
Three months ended June 30,
Six months ended June 30,
2025
2024
2025
2024
Revenue
Diagnostic test revenue
$
99,823
$
69,439
$
185,582
$
130,543
Other revenue
2,869
1,075
4,225
2,393
Total revenue
102,692
70,514
189,807
132,936
Cost of services
31,790
27,562
60,429
52,573
Gross profit
70,902
42,952
129,378
80,363
Research and development
15,079
10,902
27,656
22,469
Selling and marketing
19,448
16,585
37,764
32,670
General and administrative
27,415
26,044
59,549
49,463
Income (loss) from operations
8,960
(10,579
)
4,409
(24,239
)
Non-operating income (expenses), net
Change in fair value of warrants and contingent liabilities
2,181
(4,409
)
1,081
(10,510
)
Interest expense, net
(817
)
(894
)
(1,457
)
(1,491
)
Other income (expense), net
239
(13,481
)
448
(13,444
)
Total non-operating income (expense), net
1,603
(18,784
)
72
(25,445
)
Income (loss) before income taxes
10,563
(29,363
)
$
4,481
$
(49,684
)
Income tax benefit (expense)
246
190
(201
)
272
Net income (loss)
$
10,809
$
(29,173
)
$
4,280
$
(49,412
)
Weighted average shares outstanding of Class A common stock - Basic
28,579,704
26,617,955
28,365,018
26,340,063
Earnings (loss) per share, Class A common stock- Basic
$
0.38
$
(1.10
)
$
0.15
$
(1.88
)
Weighted average shares outstanding of Class A common stock - Diluted
29,753,933
26,617,955
29,642,555
26,340,063
Earnings (loss) per share, Class A common stock- Diluted
$
0.36
$
(1.10
)
$
0.14
$
(1.88
)
GeneDx Holdings Corp.
Condensed Consolidated Statements of Cash Flows (Unaudited)
(in thousands)
Six months ended June 30,
2025
2024
Operating activities
Net income (loss)
$
4,280
$
(49,412
)
Adjustments to reconcile net income (loss) to net cash provided by (used in) operating activities:
Depreciation and amortization expense
11,869
10,466
Stock-based compensation expense
11,796
2,657
Change in fair value of warrants and contingent liabilities
(1,081
)
10,510
Deferred tax expense (benefit)
202
(272
)
Provision for excess and obsolete inventory
123
109
Legal reserves
—
13,450
Change in third party payor reserves
5,014
1,066
Other
1,387
1,738
Change in operating assets and liabilities:
Accounts receivable
(9,889
)
6,622
Inventory
(1,404
)
(1,654
)
Accounts payable and accrued expenses
7,199
(10,871
)
Other assets and liabilities
(8,894
)
(5,327
)
Net cash provided by (used in) operating activities
20,602
(20,918
)
Investing activities
Acquisition of business, net of cash acquired
(33,195
)
—
Purchases of property and equipment
(8,498
)
(1,795
)
Purchases of marketable securities
(30,770
)
(29,381
)
Proceeds from sales of marketable securities
—
598
Proceeds from maturities of marketable securities
26,705
8,720
Net cash used in investing activities
(45,758
)
(21,858
)
Financing activities
Proceeds from offerings, net of issuance costs
13,766
—
Proceeds from issuance of common stock pursuant to employee stock purchase plan
1,262
—
Exercise of stock options
800
161
Long-term debt principal payments
(602
)
—
Finance lease principal payments
(1,162
)
(990
)
Net cash provided by (used in) financing activities
14,064
(829
)
Net decrease in cash, cash equivalents and restricted cash
(11,092
)
(43,605
)
Cash, cash equivalents and restricted cash, at beginning of period
86,202
100,668
Cash, cash equivalents and restricted cash, at end of period (1)
$
75,110
$
57,063
Supplemental disclosures of cash flow information
Cash paid for interest
$
3,210
$
4,033
Cash paid for taxes
$
920
$
557
Stock consideration paid pursuant to exercise of Perceptive warrant
$
—
$
12,586
Purchases of property and equipment in accounts payable and accrued expenses
$
5,752
$
501
Assets acquired under capital lease obligations
$
—
$
689
Cash, cash equivalents and restricted cash at June 30, 2025 excludes marketable securities of $60.4 million.
Financial Statement
29 May 2025
For Illumina, its former employees are both a boon and a problem.
In the 27 years since its founding, the DNA sequencing company unlocked new frontiers in biology, medicine and business. In doing so, it also spawned an entire ecosystem of new companies.
Illumina veterans have founded more than 70 businesses, based on interviews, a review of LinkedIn pages and
a crowdsourced list
by former employees. These companies have raised $5.2 billion in venture capital, according to an
Endpoints News
tally of PitchBook data.
Many of them buy Illumina’s gene-reading technology. But increasingly, the sequencing giant’s offspring are building machines and applications that compete with it.
“Illumina no longer controls the ecosystem,” said John Stuelpnagel, who held executive roles at the company from 1998 to 2009. The year of his departure, he co-founded the genomics software company Fabric Genomics, and sits on the boards of several other firms in the industry.
Many ex-Illumina companies remain close to their former employer, both professionally and geographically in San Diego, which has become a genomics hub thanks to Illumina.
The intertwined relationship contrasts with perhaps the most well-known corporate lineage story. The “PayPal mafia” — including Elon Musk and Reid Hoffman — split off into unrelated ventures like Tesla and LinkedIn.
Unlike the PayPal alumni, some of Illumina’s former employees call themselves the “Illumina diaspora.” The club includes Element Biosciences, Cellanome and Scale Biosciences.
Such companies are doing much more than standard DNA sequencing, fueling a shift in the industry that has prompted
Illumina to expand into products
that analyze a wider set of biological data.
“The market is really changing, and our strategy at Illumina is changing too to adapt,” Illumina’s chief technology officer Steven Barnard said in an interview with Endpoints in April.
Illumina has not always managed its evolution well. In 2021, the company acquired Grail, which had been spun off from Illumina five years earlier. The $8 billion acquisition, part of Illumina’s bet on the early-detection cancer market, encountered regulatory pushback and ended in executive turnover, shareholder lawsuits and ultimately a divestiture of Grail.
After retrenching, the company is navigating a new era with its former employees as both its customers and its fiercest competition.
Illumina helped slash the cost of sequencing a human genome from billions of dollars to just a couple hundred dollars. That opened up a wide range of applications, from prenatal testing to cancer diagnostics.
As the market matured, the company could only cover so much territory, leaving opportunities for its former employees to pursue, along with a playbook.
Jay Flatley, who was Illumina’s CEO from 1999 to 2016, said the company taught operational and strategic discipline — qualities that have made ex-employees bankable as founders and leaders. Former Illumina employees are the CEOs of about 30 companies, according to data compiled by company alumni and Endpoints.
“People who hire CEOs of startups want somebody who is not necessarily just an inventor of technology, but has the ability to build the company,” Flatley said.
Among the early departures was Helmy Eltoukhy, who co-founded Guardant Health in 2012 to build cancer detection tests — an area Illumina wasn’t focused on at the time.
Once DNA sequencing costs plummeted, there were “diminishing returns,” said Eltoukhy, Guardant’s co-CEO. “Focusing on true clinical applications that could truly solve human health challenges was something that I found more fulfilling.”
Illustrating the rise of ex-Illumina companies, Guardant’s valuation has steadily increased since going public in 2018 and the company is now worth $4.7 billion. During that time frame, Illumina’s valuation has gone from $44 billion to $13 billion.
In 2023, Illumina and Guardant settled a lawsuit that accused Guardant of stealing trade secrets. As part of the settlement, the companies have shared samples to advance cancer research, and inked a long-term supply agreement.
But legal tensions between Illumina and some of its alumni are far from over.
Some ex-employees have reimagined the DNA sequencing process that makes up Illumina’s core market. One of the most prominent challengers is Element Biosciences, founded in 2017 by former Illumina scientists.
Earlier this month, Illumina sued Element, accusing it of using proprietary technology.
Element said in a statement that it is “proud of its strong history of innovation” and plans to defend itself in court.
Besides Element, drug giant Roche has poached Illumina employees to develop its
sequencing machine that was invented
by scientists without Illumina ties. Roche anticipates a limited commercial release in 2026, and eventually, a larger rollout is planned.
At one point, Illumina faced an executive exodus, though it appears that’s no longer the case. Voluntary employee turnover at the director level and above stood at 6% in 2023, down from 17% in 2021, according to Illumina’s most recent corporate and social responsibility report.
Shawn Baker, a former Illumina employee who runs the consulting firm SanDiegOmics, said Illumina’s struggles after the Grail deal likely contributed to departures, though it’s also natural for employees to split off from a maturing company.
“The question is, ‘How positive is this for Illumina?’ Probably some positive, some negative,” Baker said. “For employees who went away and founded a successful company, that could have been an internal project if Illumina had funded it.”
Barnard said one reason he’s stayed with the company for 27 years is that its innovative spirit is still intact. Specifically, a large chunk of each year is set aside for employees to dream up new ideas and decide which ones to tackle.
“In many organizations, you never give people the freedom to do that,” Barnard said. “It’s a bit of a cliché to say that innovation dies as a company gets bigger. It certainly does happen. But we still run it like a startup, right? So that urgency and innovation is seen when getting a cup of coffee or sitting at lunch.”
While Illumina faces competition from its diaspora, the company is also harnessing it.
Companies founded by ex-Illumina staffers often use the company’s sequencers to derive biological insights — or their technologies complement Illumina’s offerings.
“What we do ought to drive more sequencing, and Illumina is at the top of that list,” said Omead Ostadan, a former Illumina employee and the CEO of Cellanome. The company, founded in 2020, developed a platform to measure cell behaviors.
And in 2016, Illumina launched Illumina Ventures, which invests in startups aligned with its mission.
The fund operates independently, and Illumina doesn’t have control over its investment decisions. But the effort reflects the company’s broader strategy of growing the sequencing market while tying new ventures to Illumina’s platform.
One of these investees, the cell analysis company Fluent BioSciences, ended up being acquired by Illumina in 2024 as part of the company’s expansion beyond DNA sequencing.
Illumina, long the pick-and-shovel provider with its DNA sequencers, is increasingly moving toward the gold of downstream applications, such as pan-cancer diagnostics. Some of its markets, once too small for the company to pursue, now have the potential to be high-growth vehicles.
At times, that has the sequencing giant bumping into its diaspora.
In February,
the company announced
it was further expanding into multiomics — a catch-all for decoding not just DNA, but also RNA, proteins, and other parts of biology. The idea is to make the most of the customers Illumina already has by selling them kits and instruments that add multiomic functions to its DNA sequencers.
“We want to start using that power of our install base,” said Barnard, Illumina’s chief technology officer.
But that means competing with alumni. Scale Biosciences, founded in 2020, specializes in single-cell genomics to understand cellular diversity — and now Illumina is encroaching into its territory.
Scale CEO Giovanna Prout
,
who worked at Illumina from 2005 to 2017, said that in overlapping areas, her former employer has the advantage of commercial scale and name recognition, but her team has the advantage of nimbleness.
“Customers need to see their performance, and we’re not slowed down by 35 people in the room and bureaucracy and long decision-making,” Prout said.
Editor’s note: This article was updated to clarify Scale Biosciences’ specialization.
Acquisition
22 May 2025
GAITHERSBURG, Md.--(BUSINESS WIRE)--GeneDx (Nasdaq: WGS), a leader in delivering improved health outcomes through genomic insights, today announced the publication of a new article in the American Journal of Medical Genetics, demonstrating GeneDx’s leadership in applying artificial intelligence (AI) to accelerate and enhance genetic diagnostics. The article was published as part of an essay collection written by global experts addressing how AI is shaping, and will continue to shape, the future of medical genetics.
The GeneDx-authored article, “AI in the Clinical Genomics Laboratory,” underscores the promise of harnessing AI to increase diagnostic yield, reduce manual workflows, and scale precision medicine for all patients with suspected genetic conditions.
“AI can be a powerful tool to enhance the expertise of clinical genetics professionals,” said Tim Laurent, Director of AI at GeneDx. “From extracting phenotypic data from clinical notes to prioritizing genetic variants, we’re building intelligent, transparent systems that work hand-in-hand with our expert team of geneticists to accelerate diagnosis while ensuring accuracy.”
With one of the world’s most comprehensive and clinically curated genomic and phenotypic datasets, GeneDx has a durable strategic advantage in training and deploying AI models for diagnostics. This depth of data enables faster, more accurate diagnoses, and builds on a foundation of agile AI infrastructure, which allows GeneDx to drive transformational scale and efficiency across an already differentiated interpretation and analysis platform.
As the cost of genomic sequencing continues to decline and guidelines increasingly recommend exome and genome sequencing as standard of care, the volume of patients eligible for testing is expected to outpace the capacity of the current genetics workforce. GeneDx is strategically leveraging its unique dataset and cutting-edge AI technologies to close that gap.
“AI is not just a tool for efficiency and streamlining operations, it’s an engine for discovery,” said Bryan Dechairo, Chief Operating Officer at GeneDx. “Because AI is only as powerful as the data it's trained on, GeneDx is uniquely positioned to embed AI across our business – from clinical interpretation to lab operations – to meet the growing demand for genomic testing and deliver answers at scale.”
The publication comes on the heels of GeneDx’s acquisition of Fabric Genomics, a leader in AI interpretation. Together, GeneDx and Fabric Genomics are ushering in the next era of genomic medicine, enabling decentralized testing powered by centralized intelligence to set the standard of care across the globe.
About GeneDx:
At GeneDx (Nasdaq: WGS), we believe that everyone deserves personalized, targeted medical care—and that it all begins with a genetic diagnosis. Fueled by one of the world’s largest, rare disease data sets, our industry-leading exome and genome tests translate complex genomic data into clinical answers that unlock personalized health plans, accelerate drug discovery, and improve health system efficiencies. For more information, please visit genedx.com and connect with us on LinkedIn, Facebook, and Instagram.
Forward Looking Statements
This press release may contain “forward-looking statements” within the meaning of Section 21E of the Securities Exchange Act of 1934, as amended, and the U.S. Private Securities Litigation Reform Act of 1995. These forward-looking statements generally are identified by the words “believe,” “project,” “expect,” “anticipate,” “estimate,” “intend,” “strategy,” “future,” “opportunity,” “plan,” “may,” “should,” “will,” “would,” “will be,” “will continue,” “will likely result,” and similar expressions. Forward-looking statements are predictions, projections and other statements about future events that are based on current expectations and assumptions and, as a result, are subject to risks and uncertainties. Many factors could cause actual future events to differ materially from the forward-looking statements in this press release, including but not limited to: (i) our ability to implement business combinations, plans, goals and forecasts, and identify and realize additional opportunities, (ii) the risk of downturns and a changing regulatory landscape in the highly competitive healthcare industry, (iii) the size and growth of the market in which we operate, (iv) our ability to pursue our new strategic direction, and (v) our ability to enhance our artificial intelligence tools that we use in our clinical interpretation platform. The foregoing list of factors is not exhaustive. A further list and description of risks, uncertainties and other matters can be found in the “Risk Factors” section of our Annual Report on Form 10-K for the fiscal year ended December 31, 2024, and other documents filed by us from time to time with the SEC. These filings identify and address other important risks and uncertainties that could cause actual events and results to differ materially from those contained in the forward-looking statements. Forward-looking statements speak only as of the date they are made. Readers are cautioned not to put undue reliance on forward-looking statements, and we assume no obligation and do not intend to update or revise these forward-looking statements, whether as a result of new information, future events, or otherwise. We do not give any assurance that we will achieve our expectations.
100 Deals associated with Fabric Genomics, Inc.
Login to view more data
100 Translational Medicine associated with Fabric Genomics, Inc.
Login to view more data
Corporation Tree
Boost your research with our corporation tree data.
login
or

Pipeline
Pipeline Snapshot as of 04 Nov 2025
No data posted
Login to keep update
Deal
Boost your decision using our deal data.
login
or
Translational Medicine
Boost your research with our translational medicine data.
login
or
Profit
Explore the financial positions of over 360K organizations with Synapse.
login
or
Grant & Funding(NIH)
Access more than 2 million grant and funding information to elevate your research journey.
login
or
Investment
Gain insights on the latest company investments from start-ups to established corporations.
login
or
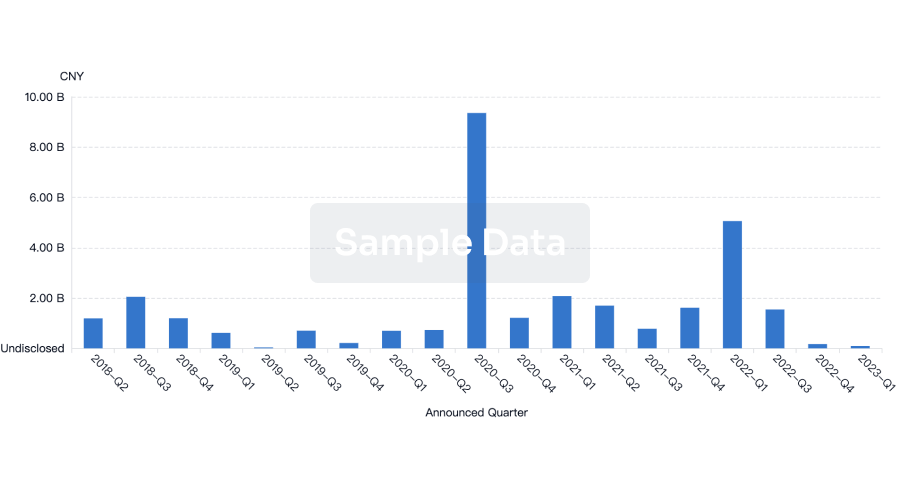
Financing
Unearth financing trends to validate and advance investment opportunities.
login
or
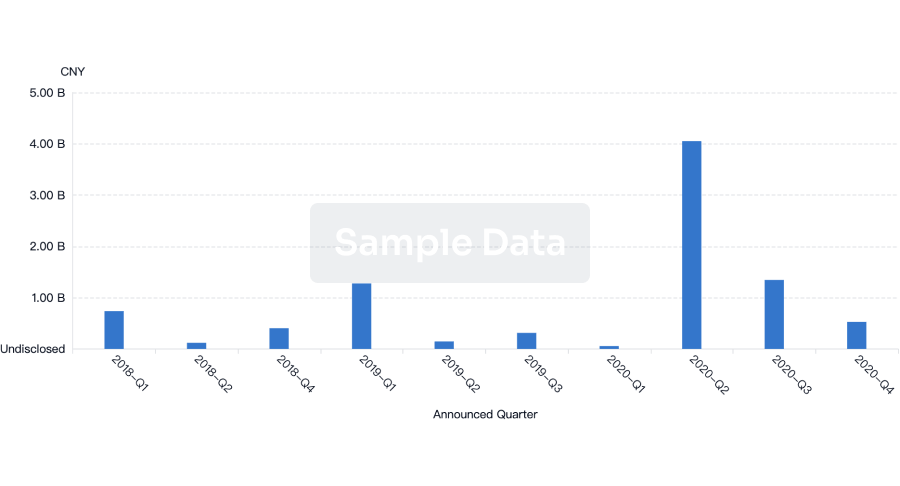
AI Agents Built for Biopharma Breakthroughs
Accelerate discovery. Empower decisions. Transform outcomes.
Get started for free today!
Accelerate Strategic R&D decision making with Synapse, PatSnap’s AI-powered Connected Innovation Intelligence Platform Built for Life Sciences Professionals.
Start your data trial now!
Synapse data is also accessible to external entities via APIs or data packages. Empower better decisions with the latest in pharmaceutical intelligence.
Bio
Bio Sequences Search & Analysis
Sign up for free
Chemical
Chemical Structures Search & Analysis
Sign up for free