Atezolizumab: brief review of its R&D progress and the clinical result in 2023 ESMO
Atezolizumab plus bevacizumab (AB) is one of the commonly used 1st-line regimen for advanced hepatocellular carcinoma (HCC) after its superior outcomes compared to sorafenib in IMbrave150 trial. However, the optimal treatment options for pts with HCC who progressed on the 1st-line AB remain unclear. On October 20, 2023, the clinical trial of Atezolizumabwas reported at the ESMO Congress.
Atezolizumab's R&D Progress
Atezolizumab is a monoclonal antibody drug that targets PDL1, a protein involved in regulating the immune system. It has been approved for use in various therapeutic areas, including neoplasms (tumors), hemic and lymphatic diseases, urogenital diseases, nervous system diseases, digestive system disorders, endocrinology and metabolic diseases, immune system diseases, cardiovascular diseases, skin and musculoskeletal diseases, other diseases, and respiratory diseases.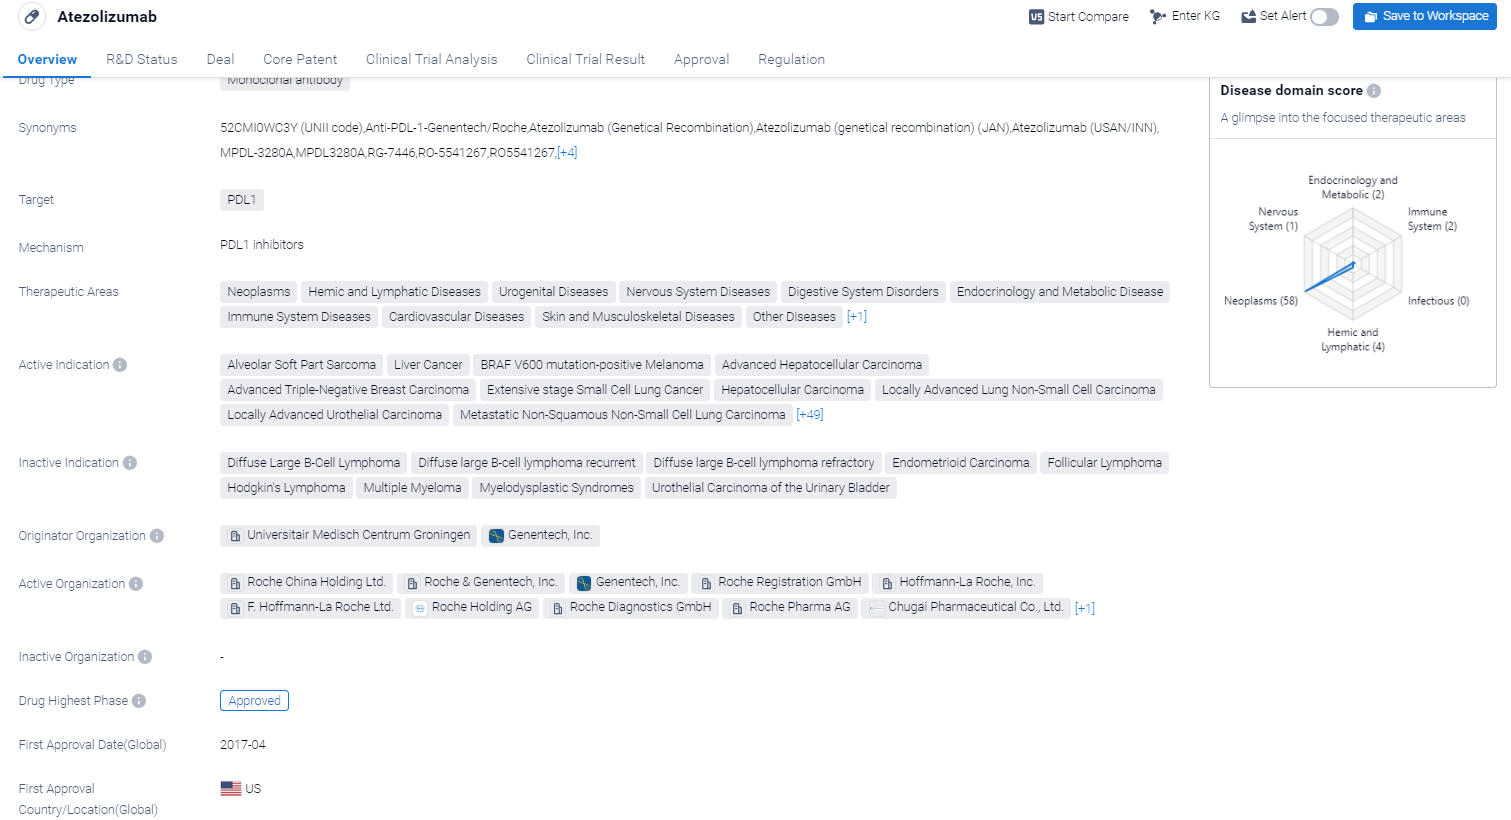
According to the Patsnap Synapse, Atezolizumab was developed by Universitair Medisch Centrum Groningen and Genentech, Inc. It received its first approval in the United States in April 2017. And the clinical trial areas for Atezolizumab are primarily in the United States, China, and France. The key indication is Neoplasms.
Detailed Clinical Outcome of Atezolizumab
This multi-national, multi-institutional, retrospective study aims to compare efficacy of different systemic 2nd-line treatments in pts with HCC who progressed on 1st-line AB.

In this study, pts with advanced HCC from 22 centers in 5 Asia-Pacific countries (Korea, Singapore, Hong Kong, Thailand, and Taiwan) were treated with the 1st-line AB and stopped due to any reasons, including disease progression or toxicity. The endpoints of this study included PFS or OS per 2nd-line regimen.
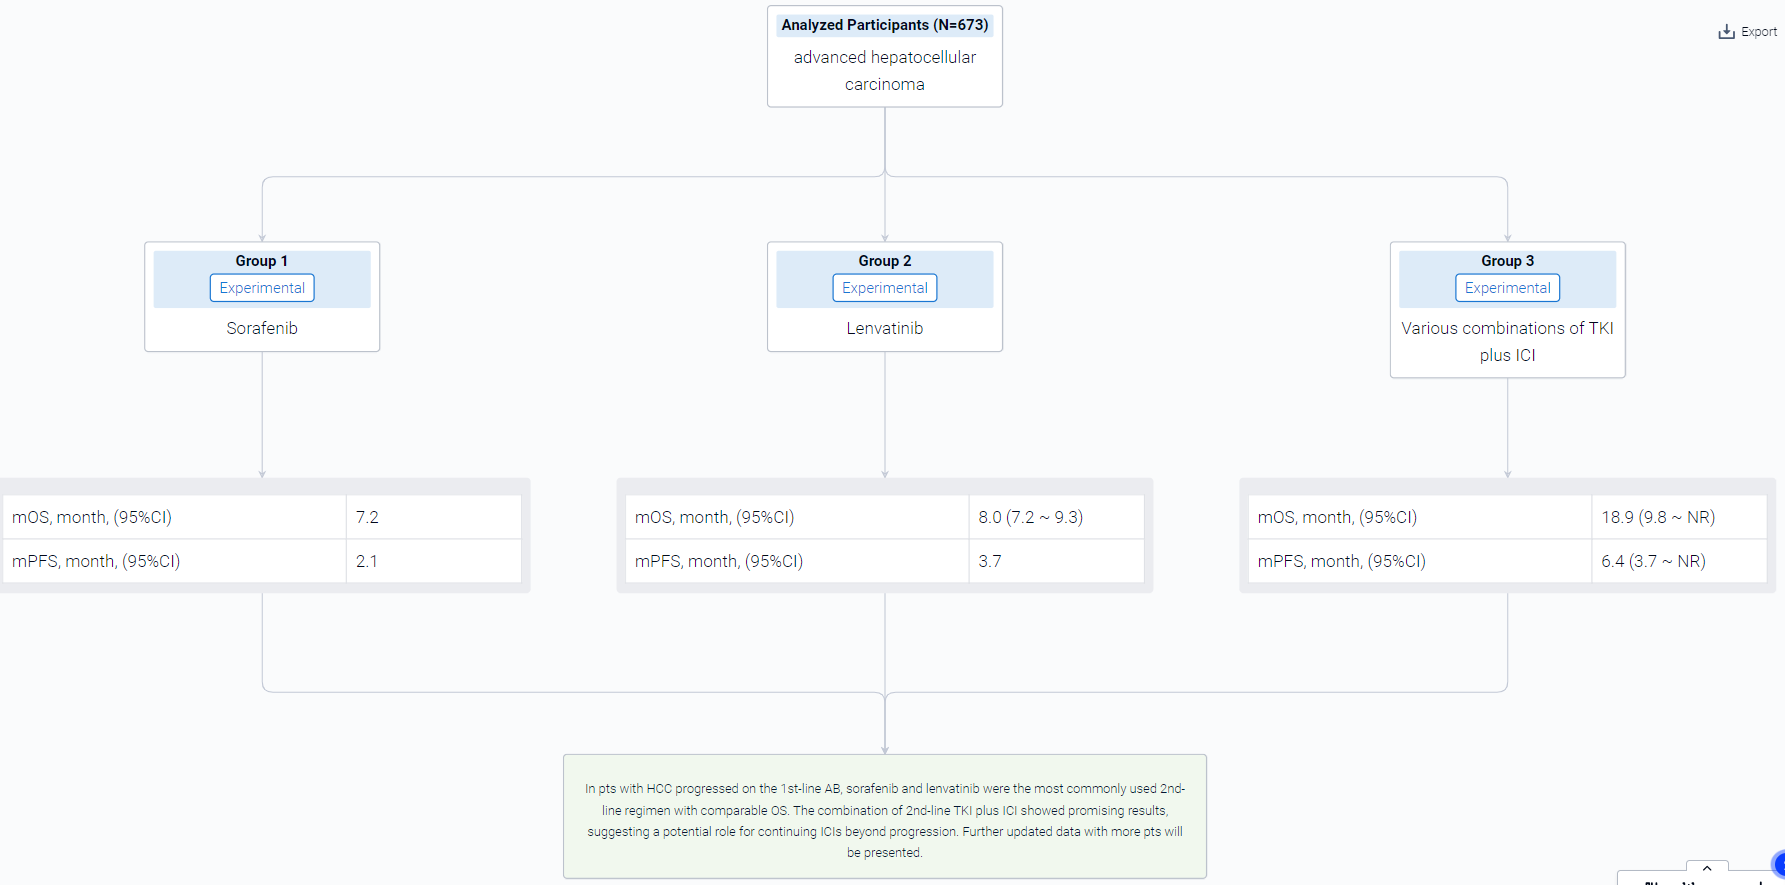
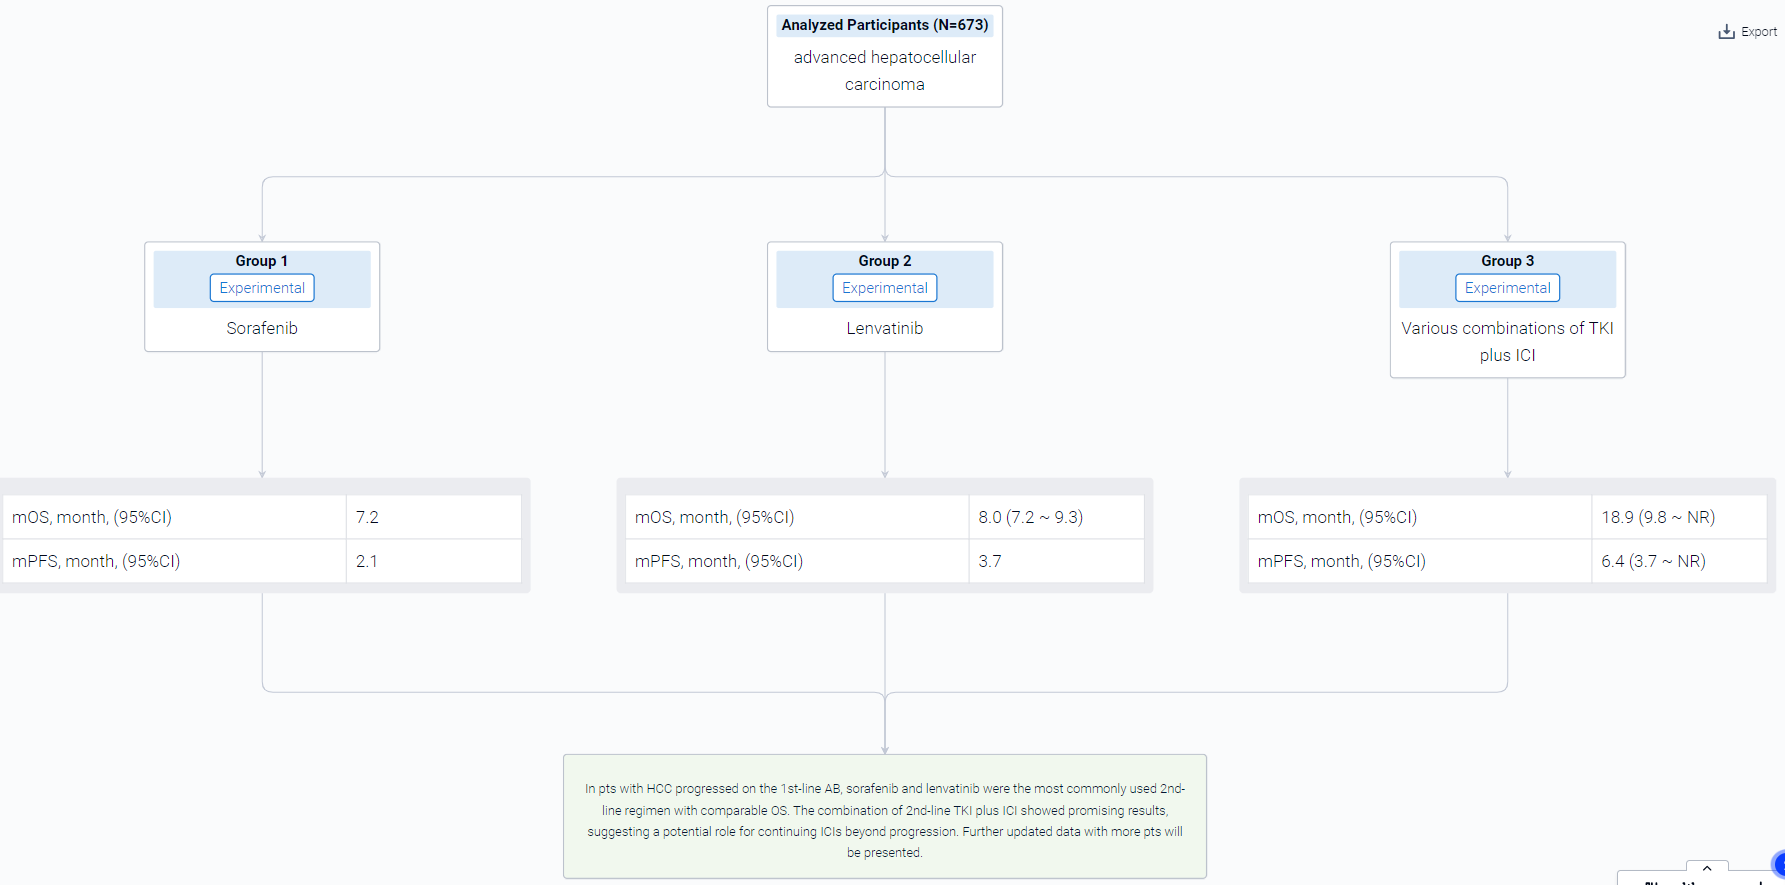
The result showed that From June 2016 to January 2023, a total of 673 pts with HCC were treated with 1st-line AB, out of which 369 pts (54.8%) started the subsequent treatment. For the main analysis population treated with 2nd-line systemic therapy (n=340), 18.5% (n=63) of pts were Child-Pugh class B. Sorafenib and lenvatinib were the most commonly used 2nd-line regimen (57.1% and 24.5%, respectively). Overall, the median PFS and OS were of 2.9 (95%CI 2.5-3.1) and 8.0 months (95%CI 7.2-9.3), respectively. Lenvatinib showed longer PFS than sorafenib (3.7 vs 2.1 months, P<0.0001), but no significant difference in OS (8 vs 7.2 months, P=0.094). Pts treated with various combinations of TKI plus ICI (n=32, 9.4%) showed PFS and OS of 6.4 (95%CI: 3.7-NR) and 18.9 (95%CI: 9.8-NR) months, respectively. Additional analyses showed that pts with shorter PFS of AB had shorter 2nd-line PFS compared to patients who achieved longer 1st-line PFS. 54.9% (161/293) of pts were treated with subsequent systemic treatment after progression on 2nd-line therapy.
It can be concluded that In pts with HCC progressed on the 1st-line AB, sorafenib and lenvatinib were the most commonly used 2nd-line regimen with comparable OS. The combination of 2nd-line TKI plus ICI showed promising results, suggesting a potential role for continuing ICIs beyond progression. Further updated data with more pts will be presented.
How to Easily View the Clinical Results Using Synapse Database?
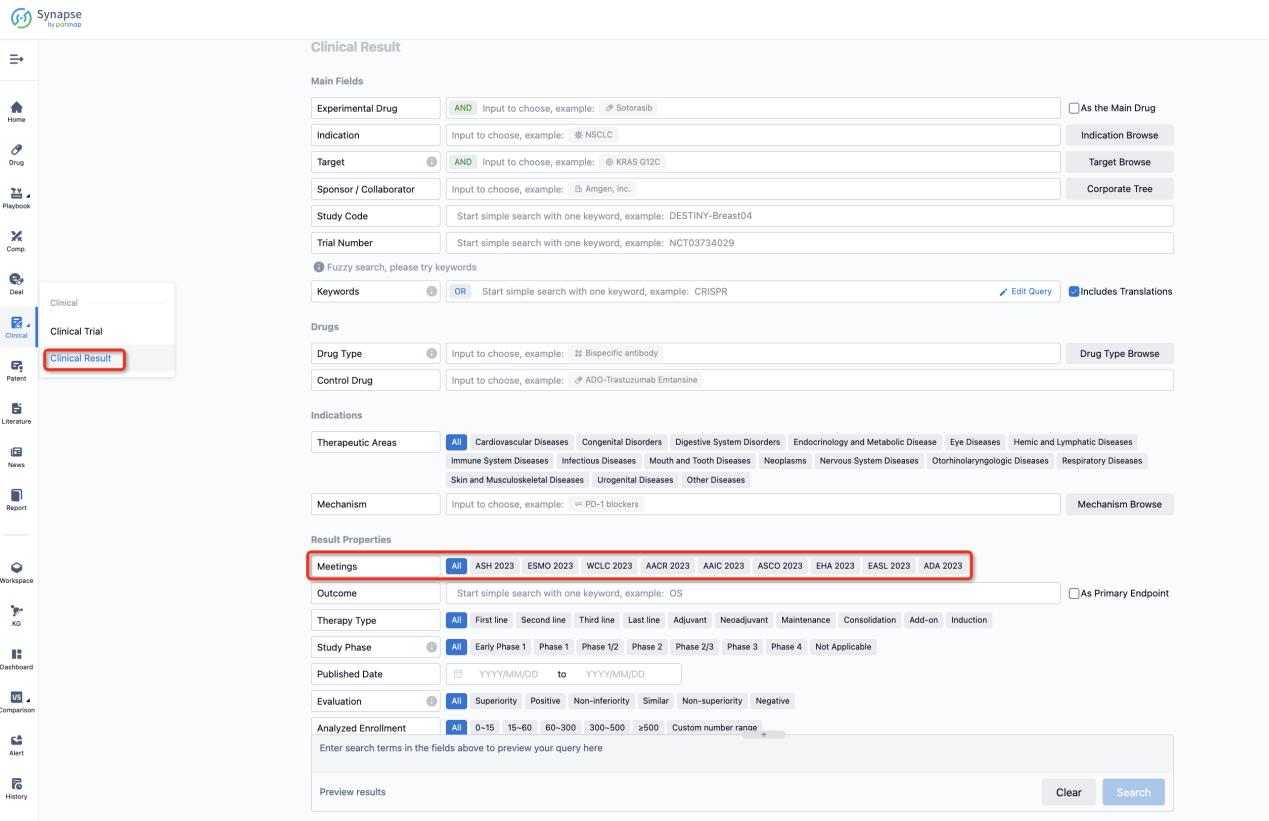
If you want to know the other clinical results of popular conferences, please lick on the “Clinical Results” on the homepage of Patsnap Synapse, which provides multi-dimensional screening and filtering of drugs, indications, targets, companies, result evaluation, release date, popular conferences, etc. to help you quickly locate the data you need.
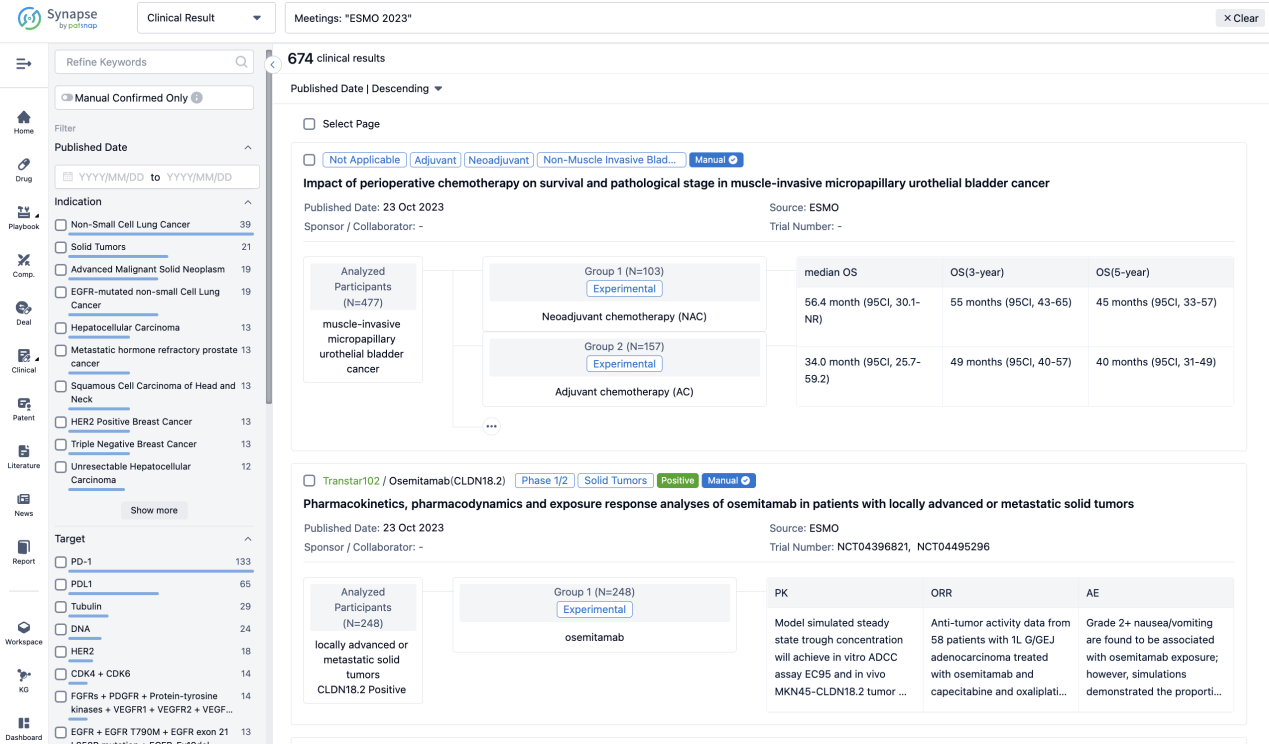
Select the clinical meeting you are interested in, such as ESMO. In the results, you can quickly locate the data you want to view by indication, phase and drug name.
A single result clearly shows important information such as registration number, phase, indication, Sponsor/Collaborator, biomarker, Trial number, dosing regimen and more.
If you would like to view more information about this result, you can go to the result detail page by clicking on the title.
Above the headings, we provide the original source of the outcome data. The basic information is supplemented with more information beyond the list, such as company, study. design, etc.

In the important Outcome Measures section, we provide both list and flowchart forms, which are convenient for you to overview the comparison group information and core indicator data.

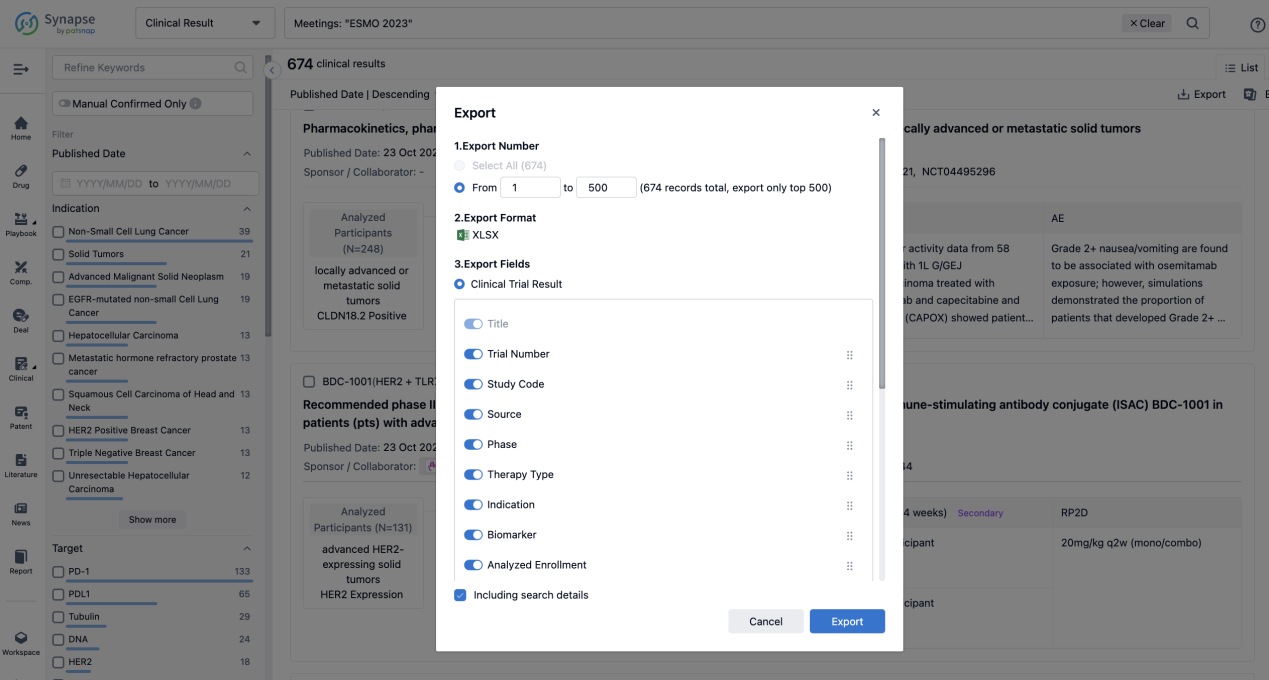
Finally, if you need to download these results, you can conveniently check the check boxes on the left side of the list, or directly click the "Export" button to download the data for personalized analysis and file sharing.
Click on the image below to embark on a brand new journey of drug discovery!

