Request Demo
Last update 23 Oct 2026
Talquetamab
Last update 23 Oct 2026
Overview
Basic Info
Drug Type Bispecific T-cell Engager (BiTE) |
Synonyms DuoBody, TALQUETAMAB-TGVS, 替吉妥单抗 + [7] |
Target |
Action stimulants, inhibitors |
Mechanism CD3 stimulants(T cell surface glycoprotein CD3 stimulants), GPRC5D inhibitors(G-protein coupled receptor family C group 5member D inhibitors), ADCC(Antibody-dependent cell-mediated cytotoxicity (ADCC) effects) |
Therapeutic Areas |
Active Indication |
Inactive Indication- |
Originator Organization |
Active Organization |
Inactive Organization- |
License Organization- |
Drug Highest PhaseApproved |
First Approval Date United States (09 Aug 2023), |
RegulationBreakthrough Therapy (United States), Accelerated Approval (United States), Orphan Drug (United States), Orphan Drug (European Union), PRIME (European Union), Priority Review (China), Breakthrough Therapy (China), Orphan Drug (Japan), Orphan Drug (South Korea), Conditional marketing approval (European Union), Conditional marketing approval (China) |

Login to view timeline
Structure/Sequence
Sequence Code 10086313H
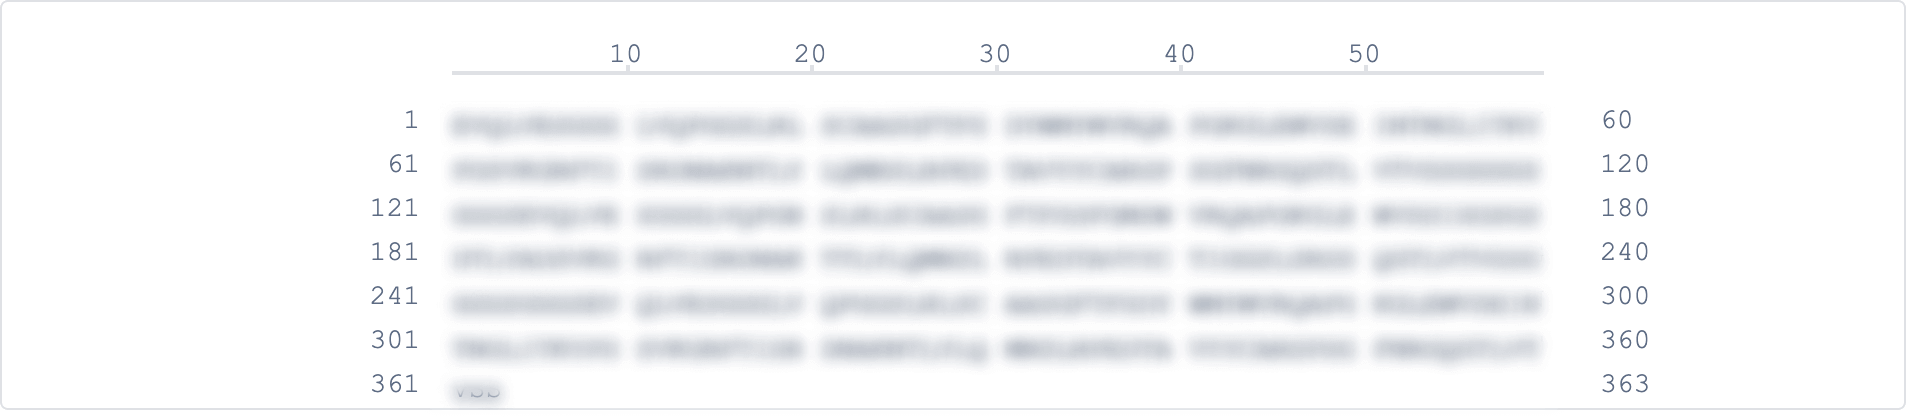
Source: *****
Sequence Code 10086327L
Source: *****
Sequence Code 453116282H
Source: *****
Sequence Code 525754800L
Source: *****
Related
48
Clinical Trials associated with TalquetamabNCT07474961
A Multicentre, Adaptive, Randomised, Multidomain, Platform Trial for Dose Optimization in the Treatment of Adult Patients With Haematological Diseases (BLOOD-dose): Core Protocol

NCT07029776
A Phase 2 Study Exploring the Use of Bispecific Antibodies to Improve Progression Free Survival in Patients With High-Risk Newly Diagnosed Multiple Myeloma (MMulti-Immune HR)

NCT07887984
Bispecific Antibody Therapy vs Autologous Stem Cell Transplantation as Consolidation for Newly Diagnosed, Standard Risk Multiple Myeloma

100 Clinical Results associated with Talquetamab
Login to view more data
100 Translational Medicine associated with Talquetamab
Login to view more data
100 Patents (Medical) associated with Talquetamab
Login to view more data
168
Literatures (Medical) associated with Talquetamab31 Dec 2026Hematology
Clinical features and management of GPRC5D-associated adverse events in novel GPRC5D × CD3 bispecific talquetamab-treated relapsed/refractory multiple myeloma patients: the MonumenTAL-1 China cohort experience
Article
Author: Campagna, Michela ; Qiu, Lugui ; Jin, Jie ; Zhang, Hong ; Gai, Xue ; Renaud, Thomas ; Xu, Qianqian ; Cai, Zhen ; Heuck, Christoph ; Fu, Chengcheng ; Zhu, Dian ; Masterson, Tara J. ; Lau, Bonnie W. ; Jing, Hongmei ; Li, Liang ; An, Gang ; Luo, Xinchao ; Liu, Rui ; Xia, Zhongjun ; He, Pengcheng
OBJECTIVES:
Talquetamab (G-protein-coupled receptor class C group 5 member D [GPRC5D] × CD3 bispecific antibody) demonstrated antitumor activity in relapsed/recurrent multiple myeloma (RRMM) in the phase I/II MonumenTAL-1 study. We report the safety profile of talquetamab in Chinese patients from MonumenTAL-1, focusing on GPRC5D-associated on-target/off-tumor adverse events (AEs).
METHODS:
Adult Chinese patients with heavily pretreated RRMM and measurable disease received subcutaneous talquetamab 0.4 mg/kg once weekly (QW) or 0.8 mg/kg biweekly (Q2W). Incidence, time to onset, duration, and recovery status of GPRC5D-associated AEs were reported. Data cutoffs: 29 February 2024 (QW cohort); 26 August 2024 (Q2W cohort).
RESULTS:
A total of 41 adult Chinese patients were included in this study (QW cohort, n = 29; Q2W cohort n = 12). Median treatment duration was 7.7 months (QW cohort) and 7.1 months (Q2W cohort); median follow-up was 16.3 and 13.9 months, respectively. GPRC5D on-target/off-tumor AEs, predominantly grade 1-2 (one grade 3 non-rash skin toxicity; QW cohort), were most commonly oral AEs (dysgeusia, dry mouth), skin AEs (rash, non-rash skin toxicity), and nail disorders; 50%-100% resolved by data cutoff. AEs were managed with supportive therapies. Talquetamab dose modification was needed in one case (grade 2 weight decrease).
DISCUSSION:
The generally mild GPRC5D-associated AEs were well tolerated and consistent with the known safety profile of talquetamab. Supportive management of these AEs without need for dose modification enabled prolonged treatment.
CONCLUSIONS:
Education of patients with RRMM on potential GPRC5D-associated AEs before starting treatment, and timely management upon experience, may ensure optimum exposure and thus maximum benefit with talquetamab.
31 Dec 2026JOURNAL OF MEDICAL ECONOMICS
Costs per responder for patients with relapsed or refractory multiple myeloma treated with Talquetamab compared with usual care
Article
Author: Mu, Fan ; Patel, Neel ; Yang, Chelsey ; Jiao, Tianze ; Liu, Yi-Hsuan ; Lee, Hans C. ; Zhang, Xinke ; Grajales-Cruz, Ariel F. ; Wang, Jiamin ; Goble, Joseph
AIMS:
To evaluate costs per responder for patients with triple-class exposed (TCE) relapsed or refractory multiple myeloma (RRMM) receiving talquetamab (Tal) on weekly (QW) and biweekly (Q2W) dosing schedules, compared with usual care from a United States commercial payer's perspective.
METHODS:
A cost per responder model was developed over a 6-month time horizon, incorporating pre-progression and post-progression costs. For Tal QW and Tal Q2W, pre-progression costs included costs of drug acquisition, inpatient step-up doses (hospitalization, pre-medication, and tocilizumab), outpatient visits, and monitoring. Pre-progression costs for usual care were estimated based on a weighted average of the 10 most used regimens in a real-world LocoMMotion/MoMMent study, including costs of acquisition, administration, co-medication, and monitoring. Post-progression costs included subsequent treatment for a subset of patients and terminal care costs prior to death. All costs were reported in 2025 United States Dollars. Clinical data of overall response rate (ORR), progression-free survival, and overall survival were obtained from an indirect treatment comparison using MonumenTAL-1 (September 2024 data cut) and LocoMMotion/MoMMent (October 2022 and August 2023 data cuts) as data sources. Deterministic sensitivity analyses and scenario analyses were conducted to assess the robustness of model results.
RESULTS:
Over the 6-month period, the total cost of care was $179,556 for usual care, $295,993 for Tal QW, and $315,135 for Tal Q2W. Despite higher costs, Tal demonstrated superior ORR, resulting in lower cost per responder: $575,962 for usual care, $405,470 for Tal QW, and $443,165 for Tal Q2W, representing a 23-30% reduction in cost per responder with Tal. Sensitivity and scenario analyses showed consistent findings.
CONCLUSION:
Although Tal QW and Q2W are associated with higher total per-patient costs compared with usual care, they offer improved clinical effectiveness, resulting in lower cost per responder. These findings suggest greater economic value for Tal in the treatment of TCE RRMM.
01 Dec 2026LEUKEMIA RESEARCH
Outpatient step-up dosing of teclistamab and talquetamab in relapsed or refractory
Article
Author: Forrest, Paul ; Kolluru, Pranav ; Garg, Ananya ; Davies, Faith E ; Lahoud, Oscar ; Morgan, Gareth J ; Shah, Kunal ; Kaminetzky, David ; Braunstein, Marc
BACKGROUND:
Bispecific T-cell-engaging antibodies against BCMA and GPRC5D demonstrate high efficacy in relapsed/refractory multiple myeloma (RRMM) but are associated with cytokine release syndrome (CRS) and immune effector cell-associated neurotoxicity syndrome (ICANS), traditionally prompting inpatient monitoring when commencing therapy. Contemporary step-up dosing and prophylactic strategies may enable safe outpatient administration.
PATIENTS AND METHODS:
We conducted a single-center retrospective study evaluating outpatient step-up dosing (SUD) of teclistamab or talquetamab in adults with RRMM. Patients met institutional outpatient eligibility criteria and received standard pre-medications; prophylactic tocilizumab was administered at physician discretion. The primary endpoint was incidence and severity of CRS/ICANS. Secondary endpoints included SUD completion, healthcare utilization, and need for hospitalization.
RESULTS:
Thirty-eight patients underwent 43 outpatient SUD initiations (teclistamab n = 30; talquetamab n = 13). Median age was 72 years, and disease burden was high. SUD completion occurred in 93%. CRS occurred in 26% of initiations and was exclusively grade 1-2; no grade ≥ 3 CRS occurred. One possible grade III ICANS event (2%) occurred after completion of SUD. CRS incidence was similar with and without prophylactic tocilizumab (29% vs 32%). Most events occurred during the first two step-up doses. Hospitalization occurred in 5 (12%) SUD initiations for CRS/ICANS events and overall healthcare utilization was modest.
CONCLUSION:
Outpatient administration of teclistamab and talquetamab SUD in RRMM is feasible and safe with low rates of low-grade CRS. Toxicities occur early and are manageable with structured monitoring, supporting outpatient delivery in appropriately selected patients.
182
News (Medical) associated with Talquetamab16 Oct 2026
Clinical ResultPhase 3Drug ApprovalLicense out/inImmunotherapy
13 Oct 2026
Phase 3Executive ChangeDrug ApprovalFinancial StatementClinical Result
07 Oct 2026
Clinical ResultPhase 3Phase 2VaccineImmunotherapy
100 Deals associated with Talquetamab
Login to view more data
External Link
| KEGG | Wiki | ATC | Drug Bank |
|---|---|---|---|
| D12180 | - | - | - |
R&D Status
Approved
10 top approved records. to view more data
Login
| Indication | Country/Location | Organization | Date |
|---|---|---|---|
| Refractory Multiple Myeloma | Japan | 24 Jun 2025 | |
| Relapse multiple myeloma | Japan | 24 Jun 2025 | |
| Multiple Myeloma | United States | 09 Aug 2023 |

Developing
10 top R&D records. to view more data
Login
| Indication | Highest Phase | Country/Location | Organization | Date |
|---|---|---|---|---|
| Residual Neoplasm | Phase 3 | - | 01 Sep 2026 | |
| Recurrent Multiple Myeloma | Phase 2 | United States | 17 Jul 2026 | |
| Recurrent Multiple Myeloma | Phase 2 | United States | 17 Jul 2026 | |
| Peripheral Stem Cell Transplantation | Phase 2 | United States | 05 Jun 2025 | |
| Smoldering Multiple Myeloma | Phase 2 | United States | 04 Dec 2023 | |
| Extramedullary Disease in Multiple Myeloma | Phase 2 | Spain | 21 Sep 2023 | |
| Hematologic Neoplasms | Phase 1 | United States | 16 Dec 2017 | |
| Hematologic Neoplasms | Phase 1 | Belgium | 16 Dec 2017 | |
| Hematologic Neoplasms | Phase 1 | Netherlands | 16 Dec 2017 | |
| Hematologic Neoplasms | Phase 1 | Spain | 16 Dec 2017 |


Login to view more data
Clinical Result
Clinical Result
Indication
Phase
Evaluation
View All Results
Not Applicable | 86 | pgoqusljbd(vrbxosansw) = uhkwlucjbd egrioqmeug (sdufzxjczh ) View more | Positive | 23 Sep 2026 | |||
Phase 2 | 50 | cucrrjkytx(npxbjfmmcm) = svyttocpqs gdxldwxfqp (mcgulrgjqg ) View more | Positive | 23 Sep 2026 | |||
(2 SUDs(0.06 mg/kg and 0.4 mg/kg)) | cucrrjkytx(npxbjfmmcm) = ueuouofgrp gdxldwxfqp (mcgulrgjqg ) View more | ||||||
Not Applicable | 176 | cyepbrsogf(ckdylvvarf) = dyrlltjazc orsfazmjtz (mgjuxpbbpi, 12.0 - NE) View more | Positive | 23 Sep 2026 | |||
(USPI criteria) | cyepbrsogf(ckdylvvarf) = qvmpzgbzkz orsfazmjtz (mgjuxpbbpi, 10.8 - NE) View more | ||||||
Not Applicable | 24 | dvgzkyoorp(whzwwwnyas) = xyiuvtbrsi zmxylxsdzg (rpsxkzcnup ) View more | Negative | 23 Sep 2026 | |||
Phase 2 | 58 | oennjnfiip(pcygfiaaji) = mohqqhxrbm lrmzkteshs (umcmxqqwbo ) View more | Negative | 23 Sep 2026 | |||
Talquetamab+clonazepam | oennjnfiip(pcygfiaaji) = tuapdvlepw lrmzkteshs (umcmxqqwbo ) View more | ||||||
Not Applicable | 45 | ovkvsfyxvt(uutfkmdfem) = uobmrzgiji rnxedvjkoi (qimdcvmjcd ) View more | Positive | 23 Sep 2026 | |||
(Hybrid model with IP SUD, toci-managed CRS, and early discharge) | ovkvsfyxvt(uutfkmdfem) = vkctwknaie rnxedvjkoi (qimdcvmjcd ) View more | ||||||
Not Applicable | 126 | uryoxixabe(tebzthkgwx) = caoepojxyt kqkrlyogme (uazeamsdbu ) View more | Positive | 23 Sep 2026 | |||
Phase 3 | Relapse multiple myeloma Second line | 864 | tzfkbcilsj(zbxtvqkavq) = rvepvmxwyg sfkkqqileb (pkpiclheaj, 75.8 - 85.7) View more | Positive | 23 Sep 2026 | ||
tzfkbcilsj(zbxtvqkavq) = kjqrasnqfm sfkkqqileb (pkpiclheaj, 71.7 - 82.5) View more | |||||||
Not Applicable | 7 | cmjjmmfhch(risolhyqyv) = cjdatkvnaq bzmscoqynq (bevmsbkutu ) View more | Positive | 23 Sep 2026 | |||
Not Applicable | 9 | prtkagiwno(xouglszhjw) = No CRS or major infections were observed, and one patient experienced grade 2 ICANS which resolved within 48 hours. alozdyheie (hnuzmqgsti ) View more | Positive | 23 Sep 2026 |
Login to view more data
Translational Medicine
Boost your research with our translational medicine data.
login
or

Deal
Boost your decision using our deal data.
login
or

Core Patent
Boost your research with our Core Patent data.
login
or

Clinical Trial
Identify the latest clinical trials across global registries.
login
or

Approval
Accelerate your research with the latest regulatory approval information.
login
or

Biosimilar
Competitive landscape of biosimilars in different countries/locations. Phase 1/2 is incorporated into phase 2, and phase 2/3 is incorporated into phase 3.
login
or

Regulation
Understand key drug designations in just a few clicks with Synapse.
login
or

Hiro LS Researcher
The AI Search Engine Built to Accelerate Biopharma Decisions
Search across billion-scale life sciences data to uncover signals, validate evidence, and act with confidence.
Ask any biopharma research question→
Get started for free today!
Accelerate Strategic R&D decision making with Synapse, Patsnap’s AI-powered Connected Innovation Intelligence Platform Built for Life Sciences Professionals.
Discover Synapse Data Servers
Synapse data is now integrated into the PatSnap LS Model Context Protocol (MCP) service. Customize your LLM agent now using our MCP server!
Bio
Bio Sequences Search & Analysis
Sign up for free
Chemical
Chemical Structures Search & Analysis
Sign up for free