Curing Agent Market Size to Grow by USD 2.09 billion, New Product Launches to be Key Trend - Technavio
20 Sep 2022
NEW YORK, Sept. 20, 2022 /PRNewswire/ --
New product launches are one of the major trends in the curing agent market. Successful new product launches increase the revenue flow of vendors and help expand their consumer base. This provides vendors a competitive edge over their rivals. For instance, in March 2020, Gabriel Performance Products, LLC announced the launch of new epoxy curing agents, namely VERSACURE RAC 9040 and RAC 9010UV. In December 2021, Evonik Industries AG launched Anquamine 469, a water-borne epoxy curing agent. Such launches will help established vendors to expand their market share in untapped consumer segments, which will further foster market growth.
Continue Reading
Preview
Source: PRNewswire
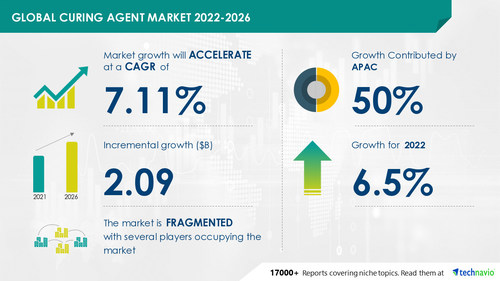
Technavio has announced its latest market research report titled Global Curing Agent Market 2022-2026
The curing agent market size is projected to grow by USD 2.09 billion from 2022 to 2026. In addition, the growth momentum of the market will accelerate at a CAGR of 7.11% during the forecast period, according to Technavio.
Technavio provides a comprehensive report summary describing the market size and forecast along with research methodology. The FREE sample report is available in PDF format
The increased demand for epoxy resin systems as a primer is driving the curing agent market growth. However, factors such as environmental regulations affecting market growth may challenge market growth.
Curing Agent Market: Type Landscape
By type, the market has been segmented into epoxy, polyurethane, silicone rubber, and others. The
epoxy segment will generate maximum revenue in the curing agent market, owing to the wide range of architectural applications of epoxy resins.
Curing Agent Market: Geographic Landscape
In terms of geography, the market has been segmented into APAC, Europe, North America, South America, and the Middle East and Africa.
APAC will present significant opportunities for market vendors due to factors such as steady economic expansion. Moreover, market growth in this region will be faster than the growth of the market in other regions. China, Japan, and India are the key markets for the curing agent market in APAC.
Curing Agent Market: Key Vendor Analysis
The curing agent market is
fragmented, and the vendors are deploying organic and inorganic growth strategies to compete in the market. Aditya Birla Management Corp. Pvt. Ltd., Albemarle Corp., Atul Ltd., BASF SE, Campbell Plastics Ltd., Cardolite Corp., Cargill Inc., Evonik Industries AG, Hexion Inc., Huntsman International LLC, KUKDO Chemical Kunshan Co. Ltd., Kumiai Chemical Industry Co. Ltd., LEUNA Harze GmbH, Mitsubishi Chemical Corp., Nan Ya Plastics Corp., Olin Corp., RPM International Inc., Shandong Deyuan Epoxy Resin Co. Ltd., Vijai Poly Products Pvt. Ltd., Yunteh Industries, among others, are some of the key vendors operating in the market.
Technavio's reports provide key strategic initiatives used by vendors, along with key news and the latest developments. View our FREE PDF Sample Report Now
Curing Agent Market: What our Reports Offer
Market share assessments for the regional and country-level segments
Strategic recommendations for the new entrants
Covers market data for 2021, 2022, until 2026
Market trends (drivers, opportunities, threats, challenges, investment opportunities, and recommendations)
Strategic recommendations in key business segments based on the market estimations
Competitive landscaping mapping the key common trends
Company profiling with detailed strategies, financials, and recent developments
Supply chain trends mapping the latest technological advancements
Get lifetime access to our Technavio Insights! Subscribe to our "Basic Plan" billed annually at USD 5000
Related Reports
Cell Culture Media and Reagents Market by End-user and Geography - Forecast and Analysis 2021-2025: The cell culture media and reagents market share is expected to increase by USD 2.26 billion from 2020 to 2025.
Erythropoietin Stimulating Agents Market by Type and Geography - Forecast and Analysis 2022-2026: The erythropoietin stimulating agents market share is expected to increase by USD 4.74 billion from 2021 to 2026.
Browse Health Care Market Reports
Table of Contents
1 Executive Summary
1.1 Market overview
Exhibit 01: Executive Summary – Chart on Market Overview
Exhibit 02: Executive Summary – Data Table on Market Overview
Exhibit 03: Executive Summary – Chart on Global Market Characteristics
Exhibit 04: Executive Summary – Chart on Market by Geography
Exhibit 05: Executive Summary – Chart on Market Segmentation by Type
Exhibit 06: Executive Summary – Chart on Incremental Growth
Exhibit 07: Executive Summary – Data Table on Incremental Growth
Exhibit 08: Executive Summary – Chart on Vendor Market Positioning
2 Market Landscape
2.1 Market ecosystem
Exhibit 09: Parent market
Exhibit 10: Market Characteristics
3 Market Sizing
3.1 Market definition
Exhibit 11: Offerings of vendors included in the market definition
3.2 Market segment analysis
Exhibit 12: Market segments
3.3 Market size 2021
3.4 Market outlook: Forecast for 2021-2026
Exhibit 13: Chart on Global - Market size and forecast 2021-2026 ($ million)
Exhibit 14: Data Table on Global - Market size and forecast 2021-2026 ($ million)
Exhibit 15: Chart on Global Market: Year-over-year growth 2021-2026 (%)
Exhibit 16: Data Table on Global Market: Year-over-year growth 2021-2026 (%)
4 Five Forces Analysis
4.1 Five forces summary
Exhibit 17: Five forces analysis - Comparison between 2021 and 2026
4.2 Bargaining power of buyers
Exhibit 18: Chart on Bargaining power of buyers – Impact of key factors 2021 and 2026
4.3 Bargaining power of suppliers
Exhibit 19: Bargaining power of suppliers – Impact of key factors in 2021 and 2026
4.4 Threat of new entrants
Exhibit 20: Threat of new entrants – Impact of key factors in 2021 and 2026
4.5 Threat of substitutes
Exhibit 21: Threat of substitutes – Impact of key factors in 2021 and 2026
4.6 Threat of rivalry
Exhibit 22: Threat of rivalry – Impact of key factors in 2021 and 2026
4.7 Market condition
Exhibit 23: Chart on Market condition - Five forces 2021 and 2026
5 Market Segmentation by Type
5.1 Market segments
Exhibit 24: Chart on Type - Market share 2021-2026 (%)
Exhibit 25: Data Table on Type - Market share 2021-2026 (%)
5.2 Comparison by Type
Exhibit 26: Chart on Comparison by Type
Exhibit 27: Data Table on Comparison by Type
5.3 Epoxy - Market size and forecast 2021-2026
Exhibit 28: Chart on Epoxy - Market size and forecast 2021-2026 ($ million)
Exhibit 29: Data Table on Epoxy - Market size and forecast 2021-2026 ($ million)
Exhibit 30: Chart on Epoxy - Year-over-year growth 2021-2026 (%)
Exhibit 31: Data Table on Epoxy - Year-over-year growth 2021-2026 (%)
5.4 Polyurethane - Market size and forecast 2021-2026
Exhibit 32: Chart on Polyurethane - Market size and forecast 2021-2026 ($ million)
Exhibit 33: Data Table on Polyurethane - Market size and forecast 2021-2026 ($ million)
Exhibit 34: Chart on Polyurethane - Year-over-year growth 2021-2026 (%)
Exhibit 35: Data Table on Polyurethane - Year-over-year growth 2021-2026 (%)
5.5 Silicone Rubber - Market size and forecast 2021-2026
Exhibit 36: Chart on Silicone Rubber - Market size and forecast 2021-2026 ($ million)
Exhibit 37: Data Table on Silicone Rubber - Market size and forecast 2021-2026 ($ million)
Exhibit 38: Chart on Silicone Rubber - Year-over-year growth 2021-2026 (%)
Exhibit 39: Data Table on Silicone Rubber - Year-over-year growth 2021-2026 (%)
5.6 Others - Market size and forecast 2021-2026
Exhibit 40: Chart on Others - Market size and forecast 2021-2026 ($ million)
Exhibit 41: Data Table on Others - Market size and forecast 2021-2026 ($ million)
Exhibit 42: Chart on Others - Year-over-year growth 2021-2026 (%)
Exhibit 43: Data Table on Others - Year-over-year growth 2021-2026 (%)
5.7 Market opportunity by Type
Exhibit 44: Market opportunity by Type ($ million)
6 Customer Landscape
6.1 Customer landscape overview
Exhibit 45: Analysis of price sensitivity, lifecycle, customer purchase basket, adoption rates, and purchase criteria
7 Geographic Landscape
7.1 Geographic segmentation
Exhibit 46: Chart on Market share by geography 2021-2026 (%)
Exhibit 47: Data Table on Market share by geography 2021-2026 (%)
7.2 Geographic comparison
Exhibit 48: Chart on Geographic comparison
Exhibit 49: Data Table on Geographic comparison
7.3 APAC - Market size and forecast 2021-2026
Exhibit 50: Chart on APAC - Market size and forecast 2021-2026 ($ million)
Exhibit 51: Data Table on APAC - Market size and forecast 2021-2026 ($ million)
Exhibit 52: Chart on APAC - Year-over-year growth 2021-2026 (%)
Exhibit 53: Data Table on APAC - Year-over-year growth 2021-2026 (%)
7.4 Europe - Market size and forecast 2021-2026
Exhibit 54: Chart on Europe - Market size and forecast 2021-2026 ($ million)
Exhibit 55: Data Table on Europe - Market size and forecast 2021-2026 ($ million)
Exhibit 56: Chart on Europe - Year-over-year growth 2021-2026 (%)
Exhibit 57: Data Table on Europe - Year-over-year growth 2021-2026 (%)
7.5 North America - Market size and forecast 2021-2026
Exhibit 58: Chart on North America - Market size and forecast 2021-2026 ($ million)
Exhibit 59: Data Table on North America - Market size and forecast 2021-2026 ($ million)
Exhibit 60: Chart on North America - Year-over-year growth 2021-2026 (%)
Exhibit 61: Data Table on North America - Year-over-year growth 2021-2026 (%)
7.6 South America - Market size and forecast 2021-2026
Exhibit 62: Chart on South America - Market size and forecast 2021-2026 ($ million)
Exhibit 63: Data Table on South America - Market size and forecast 2021-2026 ($ million)
Exhibit 64: Chart on South America - Year-over-year growth 2021-2026 (%)
Exhibit 65: Data Table on South America - Year-over-year growth 2021-2026 (%)
7.7 Middle East and Africa - Market size and forecast 2021-2026
Exhibit 66: Chart on Middle East and Africa - Market size and forecast 2021-2026 ($ million)
Exhibit 67: Data Table on Middle East and Africa - Market size and forecast 2021-2026 ($ million)
Exhibit 68: Chart on Middle East and Africa - Year-over-year growth 2021-2026 (%)
Exhibit 69: Data Table on Middle East and Africa - Year-over-year growth 2021-2026 (%)
7.8 US - Market size and forecast 2021-2026
Exhibit 70: Chart on US - Market size and forecast 2021-2026 ($ million)
Exhibit 71: Data Table on US - Market size and forecast 2021-2026 ($ million)
Exhibit 72: Chart on US - Year-over-year growth 2021-2026 (%)
Exhibit 73: Data Table on US - Year-over-year growth 2021-2026 (%)
7.9 China - Market size and forecast 2021-2026
Exhibit 74: Chart on China - Market size and forecast 2021-2026 ($ million)
Exhibit 75: Data Table on China - Market size and forecast 2021-2026 ($ million)
Exhibit 76: Chart on China - Year-over-year growth 2021-2026 (%)
Exhibit 77: Data Table on China - Year-over-year growth 2021-2026 (%)
7.10 Japan - Market size and forecast 2021-2026
Exhibit 78: Chart on Japan - Market size and forecast 2021-2026 ($ million)
Exhibit 79: Data Table on Japan - Market size and forecast 2021-2026 ($ million)
Exhibit 80: Chart on Japan - Year-over-year growth 2021-2026 (%)
Exhibit 81: Data Table on Japan - Year-over-year growth 2021-2026 (%)
7.11 India - Market size and forecast 2021-2026
Exhibit 82: Chart on India - Market size and forecast 2021-2026 ($ million)
Exhibit 83: Data Table on India - Market size and forecast 2021-2026 ($ million)
Exhibit 84: Chart on India - Year-over-year growth 2021-2026 (%)
Exhibit 85: Data Table on India - Year-over-year growth 2021-2026 (%)
7.12 Germany - Market size and forecast 2021-2026
Exhibit 86: Chart on Germany - Market size and forecast 2021-2026 ($ million)
Exhibit 87: Data Table on Germany - Market size and forecast 2021-2026 ($ million)
Exhibit 88: Chart on Germany - Year-over-year growth 2021-2026 (%)
Exhibit 89: Data Table on Germany - Year-over-year growth 2021-2026 (%)
7.13 Market opportunity by geography
Exhibit 90: Market opportunity by geography ($ million)
8 Drivers, Challenges, and Trends
8.1 Market drivers
8.2 Market challenges
8.3 Impact of drivers and challenges
Exhibit 91: Impact of drivers and challenges in 2021 and 2026
8.4 Market trends
9 Vendor Landscape
9.1 Overview
9.2 Vendor landscape
Exhibit 92: Overview on Criticality of inputs and Factors of differentiation
9.3 Landscape disruption
Exhibit 93: Overview on factors of disruption
9.4 Industry risks
Exhibit 94: Impact of key risks on business
10 Vendor Analysis
10.1 Vendors covered
Exhibit 95: Vendors covered
10.2 Market positioning of vendors
Exhibit 96: Matrix on vendor position and classification
Exhibit 97: Aditya Birla Management Corp. Pvt. Ltd. - Overview
Exhibit 98: Aditya Birla Management Corp. Pvt. Ltd. - Product / Service
Exhibit 99: Aditya Birla Management Corp. Pvt. Ltd. - Key offerings
10.4 Albemarle Corp.
Exhibit 100: Albemarle Corp. - Overview
Exhibit 101: Albemarle Corp. - Business segments
Exhibit 102: Albemarle Corp. - Key news
Exhibit 103: Albemarle Corp. - Key offerings
Exhibit 104: Albemarle Corp. - Segment focus
10.5 BASF SE
Exhibit 105: BASF SE - Overview
Exhibit 106: BASF SE - Business segments
Exhibit 107: BASF SE - Key news
Exhibit 108: BASF SE - Key offerings
Exhibit 109: BASF SE - Segment focus
10.6 Cardolite Corp.
Exhibit 110: Cardolite Corp. - Overview
Exhibit 111: Cardolite Corp. - Product / Service
Exhibit 112: Cardolite Corp. - Key offerings
10.7 Evonik Industries AG
Exhibit 113: Evonik Industries AG - Overview
Exhibit 114: Evonik Industries AG - Business segments
Exhibit 115: Evonik Industries AG - Key news
Exhibit 116: Evonik Industries AG - Key offerings
Exhibit 117: Evonik Industries AG - Segment focus
10.8 Hexion Inc.
Exhibit 118: Hexion Inc. - Overview
Exhibit 119: Hexion Inc. - Business segments
Exhibit 120: Hexion Inc. - Key news
Exhibit 121: Hexion Inc. - Key offerings
Exhibit 122: Hexion Inc. - Segment focus
Exhibit 123: Huntsman International LLC - Overview
Exhibit 124: Huntsman International LLC - Business segments
Exhibit 125: Huntsman International LLC - Key news
Exhibit 126: Huntsman International LLC - Key offerings
Exhibit 127: Huntsman International LLC - Segment focus
10.10 KUKDO Chemical Kunshan Co. Ltd.
Exhibit 128: KUKDO Chemical Kunshan Co. Ltd. - Overview
Exhibit 129: KUKDO Chemical Kunshan Co. Ltd. - Product / Service
Exhibit 130: KUKDO Chemical Kunshan Co. Ltd. - Key offerings
Exhibit 131: Mitsubishi Chemical Corp. - Overview
Exhibit 132: Mitsubishi Chemical Corp. - Business segments
Exhibit 133: Mitsubishi Chemical Corp. - Key news
Exhibit 134: Mitsubishi Chemical Corp. - Key offerings
Exhibit 135: Mitsubishi Chemical Corp. - Segment focus
10.12 Olin Corp.
Exhibit 136: Olin Corp. - Overview
Exhibit 137: Olin Corp. - Business segments
Exhibit 138: Olin Corp. - Key offerings
Exhibit 139: Olin Corp. - Segment focus
11.1 Scope of the report
11.2 Inclusions and exclusions checklist
Exhibit 140: Inclusions checklist
Exhibit 141: Exclusions checklist
11.3 Currency conversion rates for US$
Exhibit 142: Currency conversion rates for US$
11.4 Research methodology
Exhibit 143: Research methodology
Exhibit 144: Validation techniques employed for market sizing
Exhibit 145: Information sources
11.5 List of abbreviations
Exhibit 146: List of abbreviations
About Us
Technavio is a leading global technology research and advisory company. Their research and analysis focuses on emerging market trends and provides actionable insights to help businesses identify market opportunities and develop effective strategies to optimize their market positions. With over 500 specialized analysts, Technavio's report library consists of more than 17,000 reports and counting, covering 800 technologies, spanning across 50 countries. Their client base consists of enterprises of all sizes, including more than 100 Fortune 500 companies. This growing client base relies on Technavio's comprehensive coverage, extensive research, and actionable market insights to identify opportunities in existing and potential markets and assess their competitive positions within changing market scenarios.
Contact
Technavio Research
Jesse Maida
US: +1 844 364 1100
UK: +44 203 893 3200
Email: [email protected]
Website: www.technavio.com/
SOURCE Technavio
For more details,please visit the original website
The content of the article does not represent any opinions of Synapse and its affiliated companies. If there is any copyright infringement or error, please contact us, and we will deal with it within 24 hours.
Organizations


Indications
-Targets
-Drugs
-Chat with Hiro
Hot reports


Get started for free today!
Accelerate Strategic R&D decision making with Synapse, PatSnap’s AI-powered Connected Innovation Intelligence Platform Built for Life Sciences Professionals.
Start your data trial now!
Synapse data is also accessible to external entities via APIs or data packages. Empower better decisions with the latest in pharmaceutical intelligence.