Picture Archiving and Communication System Market to Record a CAGR of 5.89%, Vendors to Deploy Vendors are Deploying Organic and Inorganic Growth Strategies - Technavio
04 Oct 2022
NEW YORK, Oct. 4, 2022 /PRNewswire/ -- The picture archiving and communication (PACS) market is
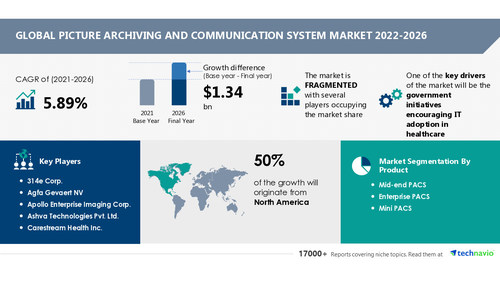
fragmented, and the vendors are deploying organic and inorganic growth strategies to compete in the market. The competition in the market is intense, with the presence of tier-1 and tier-2 companies and small companies. The presence of software providers will intensify the competition. Distribution partnerships can help tier-1 and tier-2 companies to grow in the market. Tier-1 companies account for most of the overall market share. They enter into M&A to manufacture and form distribution partnerships. Tier-2 and tier-3 companies provide software solutions for enhancing PACS in healthcare facilities.
Continue Reading
Preview
Source: PRNewswire
Technavio has announced its latest market research report titled Global Picture Archiving and Communication System Market 2022-2026
The "Picture Archiving and Communication System Market by Product (Mid-end PACS, Enterprise PACS, and Mini PACS), Application (Radiology PACS, Cardiology PACS, and Pathology PACS), and Geography (North America, Europe, Asia, and Rest of World (ROW)) - Forecast and Analysis 2022-2026" report has been added to Technavio's offering. The potential growth difference for the picture archiving and communication system market size between 2021 and 2026 is USD 1.34 billion. To get the exact yearly growth variance and the Y-O-Y growth rate, Request a FREE PDF Sample Report
Government initiatives that encourage the adoption of IT in healthcare are driving the picture archiving and communication system market growth. However, factors such as high equipment costs may challenge the market growth during the forecast period.
Technavio has identified key trends, drivers, and challenges in the market, which will help vendors improve their strategies to stay ahead of their competitors. View our FREE PDF Sample Report
Market Segmentation
By product, the
mid-end PACS segment will be the largest contributor to market growth during the forecast period. PACS helps in connecting small hospitals and medical centers with multi-modality medical imaging systems. The market penetration of mid-end PACS is high owing to the growing need for integrated teleradiology networks. The change in the healthcare IT sector is further driving their adoption. Mid-end PACS are used in radiology and cardiology departments for data management through various medical imaging equipment such as magnetic resonance imaging (MRI), computed tomography (CT), mammography, and ultrasound.
North America will be the leading region with 50% of the market's growth during the forecast period. The US is the key country for the picture archiving and communication system market in North America. The growth of this region is attributed to factors such as the use of cloud computing in the healthcare sector. Moreover, market growth in this region will be faster than the growth of the market in other regions.
View our FREE PDF Sample Report
for additional insights into the contribution of all the segments and regional opportunities in the report.
Some Companies Mentioned
314e Corp.
Agfa Gevaert NV
Apollo Enterprise Imaging Corp.
Ashva Technologies Pvt. Ltd.
Want your report customized? Speak to an analyst and personalize your report according to your needs
Related Reports
Smart Healthcare Market by Solution and Geography - Forecast and Analysis 2022-2026: The smart healthcare market share is expected to increase by USD 96.25 billion from 2021 to 2026.
Healthcare Information Software Market by Deployment, Application, and Geography - Forecast and Analysis 2022-2026: The predicted growth of the healthcare information software market share from 2021 to 2026 is USD 11.76 billion.
Browse Health Care Market Reports
Key Topics Covered
1 Executive Summary
1.1 Market overview
Exhibit 01: Executive Summary – Chart on Market Overview
Exhibit 02: Executive Summary – Data Table on Market Overview
Exhibit 03: Executive Summary – Chart on Global Market Characteristics
Exhibit 04: Executive Summary – Chart on Market by Geography
Exhibit 05: Executive Summary – Chart on Market Segmentation by Product
Exhibit 06: Executive Summary – Chart on Market Segmentation by Application
Exhibit 07: Executive Summary – Chart on Incremental Growth
Exhibit 08: Executive Summary – Data Table on Incremental Growth
Exhibit 09: Executive Summary – Chart on Vendor Market Positioning
2 Market Landscape
2.1 Market ecosystem
Exhibit 10: Parent market
Exhibit 11: Market Characteristics
3 Market Sizing
3.1 Market definition
Exhibit 12: Offerings of vendors included in the market definition
3.2 Market segment analysis
Exhibit 13: Market segments
3.3 Market size 2021
3.4 Market outlook: Forecast for 2021-2026
Exhibit 14: Chart on Global - Market size and forecast 2021-2026 ($ million)
Exhibit 15: Data Table on Global - Market size and forecast 2021-2026 ($ million)
Exhibit 16: Chart on Global Market: Year-over-year growth 2021-2026 (%)
Exhibit 17: Data Table on Global Market: Year-over-year growth 2021-2026 (%)
4 Five Forces Analysis
4.1 Five forces summary
Exhibit 18: Five forces analysis - Comparison between 2021 and 2026
4.2 Bargaining power of buyers
Exhibit 19: Chart on Bargaining power of buyers – Impact of key factors 2021 and 2026
4.3 Bargaining power of suppliers
Exhibit 20: Bargaining power of suppliers – Impact of key factors in 2021 and 2026
4.4 Threat of new entrants
Exhibit 21: Threat of new entrants – Impact of key factors in 2021 and 2026
4.5 Threat of substitutes
Exhibit 22: Threat of substitutes – Impact of key factors in 2021 and 2026
4.6 Threat of rivalry
Exhibit 23: Threat of rivalry – Impact of key factors in 2021 and 2026
4.7 Market condition
Exhibit 24: Chart on Market condition - Five forces 2021 and 2026
5 Market Segmentation by Product
5.1 Market segments
Exhibit 25: Chart on Product - Market share 2021-2026 (%)
Exhibit 26: Data Table on Product - Market share 2021-2026 (%)
5.2 Comparison by Product
Exhibit 27: Chart on Comparison by Product
Exhibit 28: Data Table on Comparison by Product
5.3 Mid-end PACS - Market size and forecast 2021-2026
Exhibit 29: Chart on Mid-end PACS - Market size and forecast 2021-2026 ($ million)
Exhibit 30: Data Table on Mid-end PACS - Market size and forecast 2021-2026 ($ million)
Exhibit 31: Chart on Mid-end PACS - Year-over-year growth 2021-2026 (%)
Exhibit 32: Data Table on Mid-end PACS - Year-over-year growth 2021-2026 (%)
5.4 Enterprise PACS - Market size and forecast 2021-2026
Exhibit 33: Chart on Enterprise PACS - Market size and forecast 2021-2026 ($ million)
Exhibit 34: Data Table on Enterprise PACS - Market size and forecast 2021-2026 ($ million)
Exhibit 35: Chart on Enterprise PACS - Year-over-year growth 2021-2026 (%)
Exhibit 36: Data Table on Enterprise PACS - Year-over-year growth 2021-2026 (%)
5.5 Mini PACS - Market size and forecast 2021-2026
Exhibit 37: Chart on Mini PACS - Market size and forecast 2021-2026 ($ million)
Exhibit 38: Data Table on Mini PACS - Market size and forecast 2021-2026 ($ million)
Exhibit 39: Chart on Mini PACS - Year-over-year growth 2021-2026 (%)
Exhibit 40: Data Table on Mini PACS - Year-over-year growth 2021-2026 (%)
5.6 Market opportunity by Product
Exhibit 41: Market opportunity by Product ($ million)
6 Market Segmentation by Application
6.1 Market segments
Exhibit 42: Chart on Application - Market share 2021-2026 (%)
Exhibit 43: Data Table on Application - Market share 2021-2026 (%)
6.2 Comparison by Application
Exhibit 44: Chart on Comparison by Application
Exhibit 45: Data Table on Comparison by Application
6.3 Radiology PACS - Market size and forecast 2021-2026
Exhibit 46: Chart on Radiology PACS - Market size and forecast 2021-2026 ($ million)
Exhibit 47: Data Table on Radiology PACS - Market size and forecast 2021-2026 ($ million)
Exhibit 48: Chart on Radiology PACS - Year-over-year growth 2021-2026 (%)
Exhibit 49: Data Table on Radiology PACS - Year-over-year growth 2021-2026 (%)
6.4 Cardiology PACS - Market size and forecast 2021-2026
Exhibit 50: Chart on Cardiology PACS - Market size and forecast 2021-2026 ($ million)
Exhibit 51: Data Table on Cardiology PACS - Market size and forecast 2021-2026 ($ million)
Exhibit 52: Chart on Cardiology PACS - Year-over-year growth 2021-2026 (%)
Exhibit 53: Data Table on Cardiology PACS - Year-over-year growth 2021-2026 (%)
6.5 Pathology PACS - Market size and forecast 2021-2026
Exhibit 54: Chart on Pathology PACS - Market size and forecast 2021-2026 ($ million)
Exhibit 55: Data Table on Pathology PACS - Market size and forecast 2021-2026 ($ million)
Exhibit 56: Chart on Pathology PACS - Year-over-year growth 2021-2026 (%)
Exhibit 57: Data Table on Pathology PACS - Year-over-year growth 2021-2026 (%)
6.6 Market opportunity by Application
Exhibit 58: Market opportunity by Application ($ million)
7 Customer Landscape
7.1 Customer landscape overview
Exhibit 59: Analysis of price sensitivity, lifecycle, customer purchase basket, adoption rates, and purchase criteria
8 Geographic Landscape
8.1 Geographic segmentation
Exhibit 60: Chart on Market share by geography 2021-2026 (%)
Exhibit 61: Data Table on Market share by geography 2021-2026 (%)
8.2 Geographic comparison
Exhibit 62: Chart on Geographic comparison
Exhibit 63: Data Table on Geographic comparison
8.3 North America - Market size and forecast 2021-2026
Exhibit 64: Chart on North America - Market size and forecast 2021-2026 ($ million)
Exhibit 65: Data Table on North America - Market size and forecast 2021-2026 ($ million)
Exhibit 66: Chart on North America - Year-over-year growth 2021-2026 (%)
Exhibit 67: Data Table on North America - Year-over-year growth 2021-2026 (%)
8.4 Europe - Market size and forecast 2021-2026
Exhibit 68: Chart on Europe - Market size and forecast 2021-2026 ($ million)
Exhibit 69: Data Table on Europe - Market size and forecast 2021-2026 ($ million)
Exhibit 70: Chart on Europe - Year-over-year growth 2021-2026 (%)
Exhibit 71: Data Table on Europe - Year-over-year growth 2021-2026 (%)
8.5 Asia - Market size and forecast 2021-2026
Exhibit 72: Chart on Asia - Market size and forecast 2021-2026 ($ million)
Exhibit 73: Data Table on Asia - Market size and forecast 2021-2026 ($ million)
Exhibit 74: Chart on Asia - Year-over-year growth 2021-2026 (%)
Exhibit 75: Data Table on Asia - Year-over-year growth 2021-2026 (%)
8.6 Rest of World (ROW) - Market size and forecast 2021-2026
Exhibit 76: Chart on Rest of World (ROW) - Market size and forecast 2021-2026 ($ million)
Exhibit 77: Data Table on Rest of World (ROW) - Market size and forecast 2021-2026 ($ million)
Exhibit 78: Chart on Rest of World (ROW) - Year-over-year growth 2021-2026 (%)
Exhibit 79: Data Table on Rest of World (ROW) - Year-over-year growth 2021-2026 (%)
8.7 US - Market size and forecast 2021-2026
Exhibit 80: Chart on US - Market size and forecast 2021-2026 ($ million)
Exhibit 81: Data Table on US - Market size and forecast 2021-2026 ($ million)
Exhibit 82: Chart on US - Year-over-year growth 2021-2026 (%)
Exhibit 83: Data Table on US - Year-over-year growth 2021-2026 (%)
8.8 Germany - Market size and forecast 2021-2026
Exhibit 84: Chart on Germany - Market size and forecast 2021-2026 ($ million)
Exhibit 85: Data Table on Germany - Market size and forecast 2021-2026 ($ million)
Exhibit 86: Chart on Germany - Year-over-year growth 2021-2026 (%)
Exhibit 87: Data Table on Germany - Year-over-year growth 2021-2026 (%)
8.9 Japan - Market size and forecast 2021-2026
Exhibit 88: Chart on Japan - Market size and forecast 2021-2026 ($ million)
Exhibit 89: Data Table on Japan - Market size and forecast 2021-2026 ($ million)
Exhibit 90: Chart on Japan - Year-over-year growth 2021-2026 (%)
Exhibit 91: Data Table on Japan - Year-over-year growth 2021-2026 (%)
8.10 China - Market size and forecast 2021-2026
Exhibit 92: Chart on China - Market size and forecast 2021-2026 ($ million)
Exhibit 93: Data Table on China - Market size and forecast 2021-2026 ($ million)
Exhibit 94: Chart on China - Year-over-year growth 2021-2026 (%)
Exhibit 95: Data Table on China - Year-over-year growth 2021-2026 (%)
8.11 UK - Market size and forecast 2021-2026
Exhibit 96: Chart on UK - Market size and forecast 2021-2026 ($ million)
Exhibit 97: Data Table on UK - Market size and forecast 2021-2026 ($ million)
Exhibit 98: Chart on UK - Year-over-year growth 2021-2026 (%)
Exhibit 99: Data Table on UK - Year-over-year growth 2021-2026 (%)
8.12 Market opportunity by geography
Exhibit 100: Market opportunity by geography ($ million)
9 Drivers, Challenges, and Trends
9.1 Market drivers
9.2 Market challenges
9.3 Impact of drivers and challenges
Exhibit 101: Impact of drivers and challenges in 2021 and 2026
9.4 Market trends
10 Vendor Landscape
10.1 Overview
10.2 Vendor landscape
Exhibit 102: Overview on Criticality of inputs and Factors of differentiation
10.3 Landscape disruption
Exhibit 103: Overview on factors of disruption
10.4 Industry risks
Exhibit 104: Impact of key risks on business
11 Vendor Analysis
11.1 Vendors covered
Exhibit 105: Vendors covered
11.2 Market positioning of vendors
Exhibit 106: Matrix on vendor position and classification
11.3 Apollo Enterprise Imaging Corp.
Exhibit 107: Apollo Enterprise Imaging Corp. - Overview
Exhibit 108: Apollo Enterprise Imaging Corp. - Product / Service
Exhibit 109: Apollo Enterprise Imaging Corp. - Key offerings
11.4 Dell Inc.
Exhibit 110: Dell Inc. - Overview
Exhibit 111: Dell Inc. - Business segments
Exhibit 112: Dell Inc. - Key news
Exhibit 113: Dell Inc. - Key offerings
Exhibit 114: Dell Inc. - Segment focus
Exhibit 115: FUJIFILM Holdings Corp. - Overview
Exhibit 116: FUJIFILM Holdings Corp. - Business segments
Exhibit 117: FUJIFILM Holdings Corp. - Key news
Exhibit 118: FUJIFILM Holdings Corp. - Key offerings
Exhibit 119: FUJIFILM Holdings Corp. - Segment focus
11.6 General Electric Co
Exhibit 120: General Electric Co - Overview
Exhibit 121: General Electric Co - Business segments
Exhibit 122: General Electric Co - Key news
Exhibit 123: General Electric Co - Key offerings
Exhibit 124: General Electric Co - Segment focus
Exhibit 125: Intelerad Medical Systems Inc. - Overview
Exhibit 126: Intelerad Medical Systems Inc. - Product / Service
Exhibit 127: Intelerad Medical Systems Inc. - Key offerings
Exhibit 128: International Business Machines Corp. - Overview
Exhibit 129: International Business Machines Corp. - Business segments
Exhibit 130: International Business Machines Corp. - Key offerings
Exhibit 131: International Business Machines Corp. - Segment focus
Exhibit 132: Koninklijke Philips NV - Overview
Exhibit 133: Koninklijke Philips NV - Business segments
Exhibit 134: Koninklijke Philips NV - Key news
Exhibit 135: Koninklijke Philips NV - Key offerings
Exhibit 136: Koninklijke Philips NV - Segment focus
11.10 PaxeraHealth
Exhibit 137: PaxeraHealth - Overview
Exhibit 138: PaxeraHealth - Product / Service
Exhibit 139: PaxeraHealth - Key offerings
11.11 Sectra AB
Exhibit 140: Sectra AB - Overview
Exhibit 141: Sectra AB - Business segments
Exhibit 142: Sectra AB - Key offerings
Exhibit 143: Sectra AB - Segment focus
11.12 Siemens AG
Exhibit 144: Siemens AG - Overview
Exhibit 145: Siemens AG - Business segments
Exhibit 146: Siemens AG - Key news
Exhibit 147: Siemens AG - Key offerings
Exhibit 148: Siemens AG - Segment focus
12.1 Scope of the report
12.2 Inclusions and exclusions checklist
Exhibit 149: Inclusions checklist
Exhibit 150: Exclusions checklist
12.3 Currency conversion rates for US$
Exhibit 151: Currency conversion rates for US$
12.4 Research methodology
Exhibit 152: Research methodology
Exhibit 153: Validation techniques employed for market sizing
Exhibit 154: Information sources
12.5 List of abbreviations
Exhibit 155: List of abbreviations
About Us
Technavio is a leading global technology research and advisory company. Their research and analysis focus on emerging market trends and provide actionable insights to help businesses identify market opportunities and develop effective strategies to optimize their market positions.
With over 500 specialized analysts, Technavio's report library consists of more than 17,000 reports and counting, covering 800 technologies, spanning across 50 countries. Their client base consists of enterprises of all sizes, including more than 100 Fortune 500 companies. This growing client base relies on Technavio's comprehensive coverage, extensive research, and actionable market insights to identify opportunities in existing and potential markets and assess their competitive positions within changing market scenarios.
Contact
Technavio Research
Jesse Maida
US: +1 844 364 1100
UK: +44 203 893 3200
Email:[email protected]
Website: www.technavio.com/
SOURCE Technavio
For more details,please visit the original website
The content of the article does not represent any opinions of Synapse and its affiliated companies. If there is any copyright infringement or error, please contact us, and we will deal with it within 24 hours.
Organizations
Indications
-Targets
-Drugs
-Hot reports


Get started for free today!
Accelerate Strategic R&D decision making with Synapse, PatSnap’s AI-powered Connected Innovation Intelligence Platform Built for Life Sciences Professionals.
Start your data trial now!
Synapse data is also accessible to external entities via APIs or data packages. Leverages most recent intelligence information, enabling fullest potential.