Sexually Transmitted Diseases (STD) Treatment Market to Record a CAGR of 4.27%, Increasing Prevalence Of STDs to Boost Market Growth - Technavio
06 Oct 2022
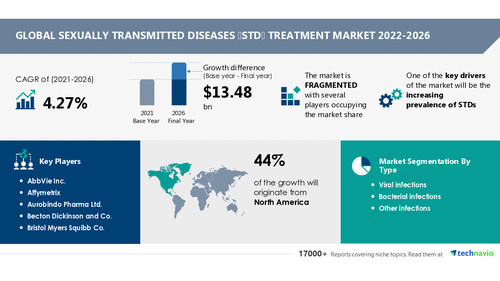
NEW YORK, Oct. 5, 2022 /PRNewswire/ -- The "Sexually Transmitted Diseases (STD) Treatment Market by Type (viral infections, bacterial infections, and other infections) and Geography (North America, Europe, Asia, and Rest of World (ROW)) - Forecast and Analysis 2022-2026" report has been added to Technavio's offering. North America will account for 44% of the market's growth during the forecast period. This growth is attributed to factors such as the growing prevalence of STDs, the availability of drugs to treat STDs, and a strong presence of vendors such as Johnson and Johnson, Pfizer, AbbVie, and Abbott.
Continue Reading
Preview
Source: PRNewswire
Technavio has announced its latest market research report titled Global Sexually Transmitted Diseases (STD) Treatment Market 2022-2026
The potential growth difference for the sexually transmitted diseases (STD) treatment market size between 2021 and 2026 is USD 13.48 billion. To get the exact yearly growth variance and the Y-O-Y growth rate, Request a FREE PDF Sample Report
Market Segmentation
By type, the
viral infections segment will be the largest contributor to market growth during the forecast period. This growth is driven by the rise in the prevalence of STDs caused by viruses. Some of the STDs caused by viruses include genital herpes (herpes simplex virus), genital infection (human papillomavirus), AIDS (HIV), and hepatitis B (hepatitis B virus).
View our FREE PDF sample report for additional insights into the contribution of all the segments and regional opportunities in the report
Market Driver: The
increasing prevalence of STDs is driving the growth of the market. STDs are caused by the transmission of various viruses, bacteria, and parasites. Some of the STDs include gonorrhea, syphilis, hepatitis B, chlamydia, genital herpes, and HIV/AIDS. Syphilis, chlamydia, gonorrhea, and trichomoniasis are curable. However, genital herpes, hepatitis B, HIV/AIDS, and STDs are caused by HPV and cannot be cured. The rising incidence and prevalence of STDs have increased the demand for the early screening and diagnosis of STDs. Vendors across the world are focusing on offering a wide range of STD treatment drugs. Hence, the rising incidence and prevalence of STDs in several countries globally are expected to foster the growth of the global STD treatment market.
Market Trend:
Advances in rapid diagnosis of STDs are a trend in the market. There is a significant shift from traditional laboratory testing to rapid point-of-care (POC) testing. The preference for self-testing for HIV has been growing rapidly across developed countries. Moreover, the market is witnessing rapid advances in molecular diagnostics used in STD testing. Hence, the availability of advanced detection techniques is fueling the growth of the market. Moreover, the increasing research on biomarkers and recent advances are expected to ease the diagnosis process.
Technavio has identified key trends, drivers, and challenges in the market, which will help vendors improve their strategies to stay ahead of their competitors. View our FREE PDF Sample Report
Some Companies Mentioned
C. H. Boehringer Sohn AG and Co. KG
Johnson and Johnson
Merck and Co. Inc.
Mylan N.V
Want your report customized? Speak to an analyst and personalize your report according to your needs
Related Reports
Sexual Enhancement Supplements Market by Product and Geography - Forecast and Analysis 2022-2026: The sexual enhancement supplements market share is expected to increase by USD 801.29 million from 2021 to 2026.
Erectile Dysfunction (ED) Drugs Market by Product and Geography - Forecast and Analysis 2022-2026: The erectile dysfunction (ED) drugs market share is expected to increase by USD 1.20 billion from 2021 to 2026.
Browse Health Care Market Reports
Key Topics Covered
1 Executive Summary
1.1 Market overview
Exhibit 01: Executive Summary – Chart on Market Overview
Exhibit 02: Executive Summary – Data Table on Market Overview
Exhibit 03: Executive Summary – Chart on Global Market Characteristics
Exhibit 04: Executive Summary – Chart on Market by Geography
Exhibit 05: Executive Summary – Chart on Market Segmentation by Type
Exhibit 06: Executive Summary – Chart on Incremental Growth
Exhibit 07: Executive Summary – Data Table on Incremental Growth
Exhibit 08: Executive Summary – Chart on Vendor Market Positioning
2 Market Landscape
2.1 Market ecosystem
Exhibit 09: Parent market
Exhibit 10: Market Characteristics
3 Market Sizing
3.1 Market definition
Exhibit 11: Offerings of vendors included in the market definition
3.2 Market segment analysis
Exhibit 12: Market segments
3.3 Market size 2021
3.4 Market outlook: Forecast for 2021-2026
Exhibit 13: Chart on Global - Market size and forecast 2021-2026 ($ billion)
Exhibit 14: Data Table on Global - Market size and forecast 2021-2026 ($ billion)
Exhibit 15: Chart on Global Market: Year-over-year growth 2021-2026 (%)
Exhibit 16: Data Table on Global Market: Year-over-year growth 2021-2026 (%)
4 Five Forces Analysis
4.1 Five forces summary
Exhibit 17: Five forces analysis - Comparison between 2021 and 2026
4.2 Bargaining power of buyers
Exhibit 18: Chart on Bargaining power of buyers – Impact of key factors 2021 and 2026
4.3 Bargaining power of suppliers
Exhibit 19: Bargaining power of suppliers – Impact of key factors in 2021 and 2026
4.4 Threat of new entrants
Exhibit 20: Threat of new entrants – Impact of key factors in 2021 and 2026
4.5 Threat of substitutes
Exhibit 21: Threat of substitutes – Impact of key factors in 2021 and 2026
4.6 Threat of rivalry
Exhibit 22: Threat of rivalry – Impact of key factors in 2021 and 2026
4.7 Market condition
Exhibit 23: Chart on Market condition - Five forces 2021 and 2026
5 Market Segmentation by Type
5.1 Market segments
Exhibit 24: Chart on Type - Market share 2021-2026 (%)
Exhibit 25: Data Table on Type - Market share 2021-2026 (%)
5.2 Comparison by Type
Exhibit 26: Chart on Comparison by Type
Exhibit 27: Data Table on Comparison by Type
5.3 Viral infections - Market size and forecast 2021-2026
Exhibit 28: Chart on Viral infections - Market size and forecast 2021-2026 ($ billion)
Exhibit 29: Data Table on Viral infections - Market size and forecast 2021-2026 ($ billion)
Exhibit 30: Chart on Viral infections - Year-over-year growth 2021-2026 (%)
Exhibit 31: Data Table on Viral infections - Year-over-year growth 2021-2026 (%)
5.4 Bacterial infections - Market size and forecast 2021-2026
Exhibit 32: Chart on Bacterial infections - Market size and forecast 2021-2026 ($ billion)
Exhibit 33: Data Table on Bacterial infections - Market size and forecast 2021-2026 ($ billion)
Exhibit 34: Chart on Bacterial infections - Year-over-year growth 2021-2026 (%)
Exhibit 35: Data Table on Bacterial infections - Year-over-year growth 2021-2026 (%)
5.5 Other infections - Market size and forecast 2021-2026
Exhibit 36: Chart on Other infections - Market size and forecast 2021-2026 ($ billion)
Exhibit 37: Data Table on Other infections - Market size and forecast 2021-2026 ($ billion)
Exhibit 38: Chart on Other infections - Year-over-year growth 2021-2026 (%)
Exhibit 39: Data Table on Other infections - Year-over-year growth 2021-2026 (%)
5.6 Market opportunity by Type
Exhibit 40: Market opportunity by Type ($ billion)
6 Customer Landscape
6.1 Customer landscape overview
Exhibit 41: Analysis of price sensitivity, lifecycle, customer purchase basket, adoption rates, and purchase criteria
7 Geographic Landscape
7.1 Geographic segmentation
Exhibit 42: Chart on Market share by geography 2021-2026 (%)
Exhibit 43: Data Table on Market share by geography 2021-2026 (%)
7.2 Geographic comparison
Exhibit 44: Chart on Geographic comparison
Exhibit 45: Data Table on Geographic comparison
7.3 North America - Market size and forecast 2021-2026
Exhibit 46: Chart on North America - Market size and forecast 2021-2026 ($ billion)
Exhibit 47: Data Table on North America - Market size and forecast 2021-2026 ($ billion)
Exhibit 48: Chart on North America - Year-over-year growth 2021-2026 (%)
Exhibit 49: Data Table on North America - Year-over-year growth 2021-2026 (%)
7.4 Europe - Market size and forecast 2021-2026
Exhibit 50: Chart on Europe - Market size and forecast 2021-2026 ($ billion)
Exhibit 51: Data Table on Europe - Market size and forecast 2021-2026 ($ billion)
Exhibit 52: Chart on Europe - Year-over-year growth 2021-2026 (%)
Exhibit 53: Data Table on Europe - Year-over-year growth 2021-2026 (%)
7.5 Asia - Market size and forecast 2021-2026
Exhibit 54: Chart on Asia - Market size and forecast 2021-2026 ($ billion)
Exhibit 55: Data Table on Asia - Market size and forecast 2021-2026 ($ billion)
Exhibit 56: Chart on Asia - Year-over-year growth 2021-2026 (%)
Exhibit 57: Data Table on Asia - Year-over-year growth 2021-2026 (%)
7.6 Rest of World (ROW) - Market size and forecast 2021-2026
Exhibit 58: Chart on Rest of World (ROW) - Market size and forecast 2021-2026 ($ billion)
Exhibit 59: Data Table on Rest of World (ROW) - Market size and forecast 2021-2026 ($ billion)
Exhibit 60: Chart on Rest of World (ROW) - Year-over-year growth 2021-2026 (%)
Exhibit 61: Data Table on Rest of World (ROW) - Year-over-year growth 2021-2026 (%)
7.7 US - Market size and forecast 2021-2026
Exhibit 62: Chart on US - Market size and forecast 2021-2026 ($ billion)
Exhibit 63: Data Table on US - Market size and forecast 2021-2026 ($ billion)
Exhibit 64: Chart on US - Year-over-year growth 2021-2026 (%)
Exhibit 65: Data Table on US - Year-over-year growth 2021-2026 (%)
7.8 Japan - Market size and forecast 2021-2026
Exhibit 66: Chart on Japan - Market size and forecast 2021-2026 ($ billion)
Exhibit 67: Data Table on Japan - Market size and forecast 2021-2026 ($ billion)
Exhibit 68: Chart on Japan - Year-over-year growth 2021-2026 (%)
Exhibit 69: Data Table on Japan - Year-over-year growth 2021-2026 (%)
7.9 China - Market size and forecast 2021-2026
Exhibit 70: Chart on China - Market size and forecast 2021-2026 ($ billion)
Exhibit 71: Data Table on China - Market size and forecast 2021-2026 ($ billion)
Exhibit 72: Chart on China - Year-over-year growth 2021-2026 (%)
Exhibit 73: Data Table on China - Year-over-year growth 2021-2026 (%)
7.10 Germany - Market size and forecast 2021-2026
Exhibit 74: Chart on Germany - Market size and forecast 2021-2026 ($ billion)
Exhibit 75: Data Table on Germany - Market size and forecast 2021-2026 ($ billion)
Exhibit 76: Chart on Germany - Year-over-year growth 2021-2026 (%)
Exhibit 77: Data Table on Germany - Year-over-year growth 2021-2026 (%)
7.11 UK - Market size and forecast 2021-2026
Exhibit 78: Chart on UK - Market size and forecast 2021-2026 ($ billion)
Exhibit 79: Data Table on UK - Market size and forecast 2021-2026 ($ billion)
Exhibit 80: Chart on UK - Year-over-year growth 2021-2026 (%)
Exhibit 81: Data Table on UK - Year-over-year growth 2021-2026 (%)
7.12 Market opportunity by geography
Exhibit 82: Market opportunity by geography ($ billion)
8 Drivers, Challenges, and Trends
8.1 Market drivers
8.2 Market challenges
8.3 Impact of drivers and challenges
Exhibit 83: Impact of drivers and challenges in 2021 and 2026
8.4 Market trends
9 Vendor Landscape
9.1 Overview
9.2 Vendor landscape
Exhibit 84: Overview on Criticality of inputs and Factors of differentiation
9.3 Landscape disruption
Exhibit 85: Overview on factors of disruption
9.4 Industry risks
Exhibit 86: Impact of key risks on business
10 Vendor Analysis
10.1 Vendors covered
Exhibit 87: Vendors covered
10.2 Market positioning of vendors
Exhibit 88: Matrix on vendor position and classification
10.3 AbbVie Inc.
Exhibit 89: AbbVie Inc. - Overview
Exhibit 90: AbbVie Inc. - Product / Service
Exhibit 91: AbbVie Inc. - Key offerings
Exhibit 92: Aurobindo Pharma Ltd. - Overview
Exhibit 93: Aurobindo Pharma Ltd. - Product / Service
Exhibit 94: Aurobindo Pharma Ltd. - Key offerings
Exhibit 95: Bristol Myers Squibb Co. - Overview
Exhibit 96: Bristol Myers Squibb Co. - Product / Service
Exhibit 97: Bristol Myers Squibb Co. - Key offerings
10.6 C. H. Boehringer Sohn AG and Co. KG
Exhibit 98: C. H. Boehringer Sohn AG and Co. KG - Overview
Exhibit 99: C. H. Boehringer Sohn AG and Co. KG - Business segments
Exhibit 100: C. H. Boehringer Sohn AG and Co. KG - Key news
Exhibit 101: C. H. Boehringer Sohn AG and Co. KG - Key offerings
Exhibit 102: C. H. Boehringer Sohn AG and Co. KG - Segment focus
Exhibit 103: Dynavax Technologies Corp. - Overview
Exhibit 104: Dynavax Technologies Corp. - Product / Service
Exhibit 105: Dynavax Technologies Corp. - Key news
Exhibit 106: Dynavax Technologies Corp. - Key offerings
10.8 F. Hoffmann La Roche Ltd.
Exhibit 107: F. Hoffmann La Roche Ltd. - Overview
Exhibit 108: F. Hoffmann La Roche Ltd. - Business segments
Exhibit 109: F. Hoffmann La Roche Ltd. - Key news
Exhibit 110: F. Hoffmann La Roche Ltd. - Key offerings
Exhibit 111: F. Hoffmann La Roche Ltd. - Segment focus
10.9 Gilead Sciences Inc.
Exhibit 112: Gilead Sciences Inc. - Overview
Exhibit 113: Gilead Sciences Inc. - Product / Service
Exhibit 114: Gilead Sciences Inc. - Key news
Exhibit 115: Gilead Sciences Inc. - Key offerings
10.10 GlaxoSmithKline Plc
Exhibit 116: GlaxoSmithKline Plc - Overview
Exhibit 117: GlaxoSmithKline Plc - Business segments
Exhibit 118: GlaxoSmithKline Plc - Key news
Exhibit 119: GlaxoSmithKline Plc - Key offerings
Exhibit 120: GlaxoSmithKline Plc - Segment focus
10.11 Johnson and Johnson
Exhibit 121: Johnson and Johnson - Overview
Exhibit 122: Johnson and Johnson - Business segments
Exhibit 123: Johnson and Johnson - Key news
Exhibit 124: Johnson and Johnson - Key offerings
Exhibit 125: Johnson and Johnson - Segment focus
10.12 Merck and Co. Inc.
Exhibit 126: Merck and Co. Inc. - Overview
Exhibit 127: Merck and Co. Inc. - Business segments
Exhibit 128: Merck and Co. Inc. - Key news
Exhibit 129: Merck and Co. Inc. - Key offerings
Exhibit 130: Merck and Co. Inc. - Segment focus
11.1 Scope of the report
11.2 Inclusions and exclusions checklist
Exhibit 131: Inclusions checklist
Exhibit 132: Exclusions checklist
11.3 Currency conversion rates for US$
Exhibit 133: Currency conversion rates for US$
11.4 Research methodology
Exhibit 134: Research methodology
Exhibit 135: Validation techniques employed for market sizing
Exhibit 136: Information sources
11.5 List of abbreviations
Exhibit 137: List of abbreviations
About Us
Technavio is a leading global technology research and advisory company. Their research and analysis focus on emerging market trends and provide actionable insights to help businesses identify market opportunities and develop effective strategies to optimize their market positions.
With over 500 specialized analysts, Technavio's report library consists of more than 17,000 reports and counting, covering 800 technologies, spanning across 50 countries. Their client base consists of enterprises of all sizes, including more than 100 Fortune 500 companies. This growing client base relies on Technavio's comprehensive coverage, extensive research, and actionable market insights to identify opportunities in existing and potential markets and assess their competitive positions within changing market scenarios.
Contact
Technavio Research
Jesse Maida
US: +1 844 364 1100
UK: +44 203 893 3200
Email:[email protected]
Website: www.technavio.com/
SOURCE Technavio
For more details,please visit the original website
The content of the article does not represent any opinions of Synapse and its affiliated companies. If there is any copyright infringement or error, please contact us, and we will deal with it within 24 hours.
Organizations
Indications
Targets
-Drugs
-Hot reports


Get started for free today!
Accelerate Strategic R&D decision making with Synapse, PatSnap’s AI-powered Connected Innovation Intelligence Platform Built for Life Sciences Professionals.
Start your data trial now!
Synapse data is also accessible to external entities via APIs or data packages. Leverages most recent intelligence information, enabling fullest potential.