3D Vascular Ultrasound Imaging Market to record USD 344.17 Mn incremental growth; North America to have a significant share -- Technavio
10 Oct 2022
NEW YORK, Oct. 10, 2022 /PRNewswire/ -- The "
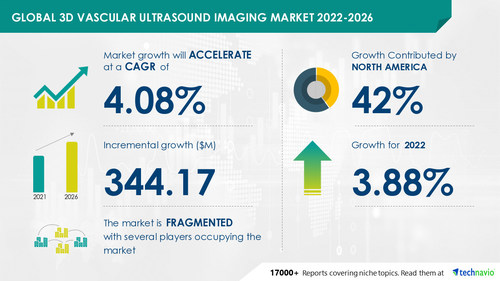
3D Vascular Ultrasound Imaging Market Growth By Application and Geography - Forecast and Analysis - 2022-2026" report has been added to Technavio's offering. According to the report, the market size will grow by USD 344.17 million, accelerating at a CAGR of 4.08% during the forecast period. The report expects the market to observe strong growth in North America over the forecast period. The US and Canada are the key markets for 3D vascular ultrasound imaging in the region. The report provides a comprehensive analysis of the market growth across regions, new product launches, successful strategies adopted by vendors, major revenue-generating segments, and much more.
Download Sample PDF Report
Continue Reading
Preview
Source: PRNewswire
Technavio has announced its latest market research report titled Global 3D Vascular Ultrasound Imaging Market 2022-2026
Technavio categorizes the global 3D vascular ultrasound imaging devices market as a part of the global healthcare equipment market. The parent, global healthcare equipment market covers products and companies engaged in research and development (R&D) of a variety of product categories, including capital equipment, instruments, implants, accessories, and consumables that are used for the diagnosis, monitoring, and treatment of various diseases.
The global 3D vascular ultrasound monitoring market is fragmented with the presence of several established regional and international players. The vendors operating in the market are adopting various organic and inorganic growth strategies such as launching innovative products and engaging in M&A activities to remain competitive and gain an edge over their rivals. The report identifies BPL Medical Technologies Pvt. Ltd., Canon Inc., Carestream Health Inc., Chison Medical Technologies Co. Ltd., ContextVision AB, Digirad Corp., Esaote Spa, FUJIFILM Holdings Corp., General Electric Co, Hitachi Ltd., Hologic Inc., Koninklijke Philips NV, Piur imaging GmbH, Promed Technology Co. Ltd., Samsung Electronics Co. Ltd., Shantou Institute of Ultrasonic Instruments Co. Ltd., Shenzhen Mindray BioMedical Electronics Co. Ltd, Shimadzu Corp., Siemens Healthineers AG, and Toposens GmbH s some of the major market participants.
Request Sample Report Here
The increasing use of virtual reality (VR) devices in the healthcare industry has been instrumental in driving the growth of the market. However, the presence of stringent regulatory processes might hamper the market growth. Competitors have to focus on differentiating their product offerings with unique value propositions to strengthen their foothold in the market. Market vendors also have to leverage the existing growth prospects in the fast-growing segments, while maintaining their positions in the slow-growing segments.
3D Vascular Ultrasound Imaging Market 2022-2026: Segmentation
The global 3D vascular ultrasound imaging market is segmented as below:
Application
Gynecology
Opthalmology
Others
The market growth in the vascular imaging segment will be significant over the forecast period. The increasing use of vascular imaging in assessing changes in vasculature, which take place in people with AlzheimerAlzheimer's disease and aneurysms, is driving the growth of the segment.
Geography
North America
Europe
Asia
Rest Of World (ROW)
42% of the market growth will come from North America during the forecast period. The increasing demand for 3D systems in the healthcare industry is driving the growth of the regional market. The US and Canada are the key markets for 3D vascular ultrasound imaging in North America. Technavio presents a detailed picture of the market by the way of study, synthesis, and summation of data from multiple sources. The 3D vascular ultrasound imaging market report covers the following areas:
3D Vascular Ultrasound Imaging Market Size
3D Vascular Ultrasound Imaging Market Trends
3D Vascular Ultrasound Imaging Market Industry Analysis
3D Vascular Ultrasound Imaging Market 2022-2026: Key Highlights
CAGR of the market during the forecast period 2022-2026
Detailed information on factors that will assist 3d vascular ultrasound imaging market growth during the next five years
Estimation of the 3d vascular ultrasound imaging market size and its contribution to the parent market
Predictions on upcoming trends and changes in consumer behavior
The growth of the 3d vascular ultrasound imaging market
Analysis of the market's competitive landscape and detailed information on vendors
Comprehensive details of factors that will challenge the growth of 3d vascular ultrasound imaging market vendors
Related Reports:
Cardiovascular Ultrasound Imaging Systems Market by Product and Geography - Forecast and Analysis 2022-2026
Automated Breast Ultrasound Systems (ABUS) Market by End-user and Geography - Forecast and Analysis 2022-2026
Table of Contents:
1 Executive Summary
1.1 Market overview
Exhibit 01: Executive Summary – Chart on Market Overview
Exhibit 02: Executive Summary – Data Table on Market Overview
Exhibit 03: Executive Summary – Chart on Global Market Characteristics
Exhibit 04: Executive Summary – Chart on Market by Geography
Exhibit 05: Executive Summary – Chart on Market Segmentation by Application
Exhibit 06: Executive Summary – Chart on Incremental Growth
Exhibit 07: Executive Summary – Data Table on Incremental Growth
Exhibit 08: Executive Summary – Chart on Vendor Market Positioning
2 Market Landscape
2.1 Market ecosystem
Exhibit 09: Parent market
Exhibit 10: Market Characteristics
3 Market Sizing
3.1 Market definition
Exhibit 11: Offerings of vendors included in the market definition
3.2 Market segment analysis
Exhibit 12: Market segments
3.3 Market size 2021
3.4 Market outlook: Forecast for 2021-2026
Exhibit 13: Chart on Global - Market size and forecast 2021-2026 ($ million)
Exhibit 14: Data Table on Global - Market size and forecast 2021-2026 ($ million)
Exhibit 15: Chart on Global Market: Year-over-year growth 2021-2026 (%)
Exhibit 16: Data Table on Global Market: Year-over-year growth 2021-2026 (%)
4 Five Forces Analysis
4.1 Five forces summary
Exhibit 17: Five forces analysis - Comparison between 2021 and 2026
4.2 Bargaining power of buyers
Exhibit 18: Chart on Bargaining power of buyers – Impact of key factors 2021 and 2026
4.3 Bargaining power of suppliers
Exhibit 19: Bargaining power of suppliers – Impact of key factors in 2021 and 2026
4.4 Threat of new entrants
Exhibit 20: Threat of new entrants – Impact of key factors in 2021 and 2026
4.5 Threat of substitutes
Exhibit 21: Threat of substitutes – Impact of key factors in 2021 and 2026
4.6 Threat of rivalry
Exhibit 22: Threat of rivalry – Impact of key factors in 2021 and 2026
4.7 Market condition
Exhibit 23: Chart on Market condition - Five forces 2021 and 2026
5 Market Segmentation by Application
5.1 Market segments
Exhibit 24: Chart on Application - Market share 2021-2026 (%)
Exhibit 25: Data Table on Application - Market share 2021-2026 (%)
5.2 Comparison by Application
Exhibit 26: Chart on Comparison by Application
Exhibit 27: Data Table on Comparison by Application
5.3 Vascular imaging - Market size and forecast 2021-2026
Exhibit 28: Chart on Vascular imaging - Market size and forecast 2021-2026 ($ million)
Exhibit 29: Data Table on Vascular imaging - Market size and forecast 2021-2026 ($ million)
Exhibit 30: Chart on Vascular imaging - Year-over-year growth 2021-2026 (%)
Exhibit 31: Data Table on Vascular imaging - Year-over-year growth 2021-2026 (%)
5.4 Fetal cardiac - Market size and forecast 2021-2026
Exhibit 32: Chart on Fetal cardiac - Market size and forecast 2021-2026 ($ million)
Exhibit 33: Data Table on Fetal cardiac - Market size and forecast 2021-2026 ($ million)
Exhibit 34: Chart on Fetal cardiac - Year-over-year growth 2021-2026 (%)
Exhibit 35: Data Table on Fetal cardiac - Year-over-year growth 2021-2026 (%)
5.5 Gynecology - Market size and forecast 2021-2026
Exhibit 36: Chart on Gynecology - Market size and forecast 2021-2026 ($ million)
Exhibit 37: Data Table on Gynecology - Market size and forecast 2021-2026 ($ million)
Exhibit 38: Chart on Gynecology - Year-over-year growth 2021-2026 (%)
Exhibit 39: Data Table on Gynecology - Year-over-year growth 2021-2026 (%)
5.6 Opthalmology - Market size and forecast 2021-2026
Exhibit 40: Chart on Opthalmology - Market size and forecast 2021-2026 ($ million)
Exhibit 41: Data Table on Opthalmology - Market size and forecast 2021-2026 ($ million)
Exhibit 42: Chart on Opthalmology - Year-over-year growth 2021-2026 (%)
Exhibit 43: Data Table on Opthalmology - Year-over-year growth 2021-2026 (%)
5.7 Others - Market size and forecast 2021-2026
Exhibit 44: Chart on Others - Market size and forecast 2021-2026 ($ million)
Exhibit 45: Data Table on Others - Market size and forecast 2021-2026 ($ million)
Exhibit 46: Chart on Others - Year-over-year growth 2021-2026 (%)
Exhibit 47: Data Table on Others - Year-over-year growth 2021-2026 (%)
5.8 Market opportunity by Application
Exhibit 48: Market opportunity by Application ($ million)
6 Customer Landscape
6.1 Customer landscape overview
Exhibit 49: Analysis of price sensitivity, lifecycle, customer purchase basket, adoption rates, and purchase criteria
7 Geographic Landscape
7.1 Geographic segmentation
Exhibit 50: Chart on Market share by geography 2021-2026 (%)
Exhibit 51: Data Table on Market share by geography 2021-2026 (%)
7.2 Geographic comparison
Exhibit 52: Chart on Geographic comparison
Exhibit 53: Data Table on Geographic comparison
7.3 North America - Market size and forecast 2021-2026
Exhibit 54: Chart on North America - Market size and forecast 2021-2026 ($ million)
Exhibit 55: Data Table on North America - Market size and forecast 2021-2026 ($ million)
Exhibit 56: Chart on North America - Year-over-year growth 2021-2026 (%)
Exhibit 57: Data Table on North America - Year-over-year growth 2021-2026 (%)
7.4 Europe - Market size and forecast 2021-2026
Exhibit 58: Chart on Europe - Market size and forecast 2021-2026 ($ million)
Exhibit 59: Data Table on Europe - Market size and forecast 2021-2026 ($ million)
Exhibit 60: Chart on Europe - Year-over-year growth 2021-2026 (%)
Exhibit 61: Data Table on Europe - Year-over-year growth 2021-2026 (%)
7.5 Asia - Market size and forecast 2021-2026
Exhibit 62: Chart on Asia - Market size and forecast 2021-2026 ($ million)
Exhibit 63: Data Table on Asia - Market size and forecast 2021-2026 ($ million)
Exhibit 64: Chart on Asia - Year-over-year growth 2021-2026 (%)
Exhibit 65: Data Table on Asia - Year-over-year growth 2021-2026 (%)
7.6 Rest of World (ROW) - Market size and forecast 2021-2026
Exhibit 66: Chart on Rest of World (ROW) - Market size and forecast 2021-2026 ($ million)
Exhibit 67: Data Table on Rest of World (ROW) - Market size and forecast 2021-2026 ($ million)
Exhibit 68: Chart on Rest of World (ROW) - Year-over-year growth 2021-2026 (%)
Exhibit 69: Data Table on Rest of World (ROW) - Year-over-year growth 2021-2026 (%)
7.7 US - Market size and forecast 2021-2026
Exhibit 70: Chart on US - Market size and forecast 2021-2026 ($ million)
Exhibit 71: Data Table on US - Market size and forecast 2021-2026 ($ million)
Exhibit 72: Chart on US - Year-over-year growth 2021-2026 (%)
Exhibit 73: Data Table on US - Year-over-year growth 2021-2026 (%)
7.8 China - Market size and forecast 2021-2026
Exhibit 74: Chart on China - Market size and forecast 2021-2026 ($ million)
Exhibit 75: Data Table on China - Market size and forecast 2021-2026 ($ million)
Exhibit 76: Chart on China - Year-over-year growth 2021-2026 (%)
Exhibit 77: Data Table on China - Year-over-year growth 2021-2026 (%)
7.9 Germany - Market size and forecast 2021-2026
Exhibit 78: Chart on Germany - Market size and forecast 2021-2026 ($ million)
Exhibit 79: Data Table on Germany - Market size and forecast 2021-2026 ($ million)
Exhibit 80: Chart on Germany - Year-over-year growth 2021-2026 (%)
Exhibit 81: Data Table on Germany - Year-over-year growth 2021-2026 (%)
7.10 Canada - Market size and forecast 2021-2026
Exhibit 82: Chart on Canada - Market size and forecast 2021-2026 ($ million)
Exhibit 83: Data Table on Canada - Market size and forecast 2021-2026 ($ million)
Exhibit 84: Chart on Canada - Year-over-year growth 2021-2026 (%)
Exhibit 85: Data Table on Canada - Year-over-year growth 2021-2026 (%)
7.11 UK - Market size and forecast 2021-2026
Exhibit 86: Chart on UK - Market size and forecast 2021-2026 ($ million)
Exhibit 87: Data Table on UK - Market size and forecast 2021-2026 ($ million)
Exhibit 88: Chart on UK - Year-over-year growth 2021-2026 (%)
Exhibit 89: Data Table on UK - Year-over-year growth 2021-2026 (%)
7.12 Market opportunity by geography
Exhibit 90: Market opportunity by geography ($ million)
8 Drivers, Challenges, and Trends
8.1 Market drivers
8.2 Market challenges
8.3 Impact of drivers and challenges
Exhibit 91: Impact of drivers and challenges in 2021 and 2026
8.4 Market trends
9 Vendor Landscape
9.1 Overview
9.2 Vendor landscape
Exhibit 92: Overview on Criticality of inputs and Factors of differentiation
9.3 Landscape disruption
Exhibit 93: Overview on factors of disruption
9.4 Industry risks
Exhibit 94: Impact of key risks on business
10 Vendor Analysis
10.1 Vendors covered
Exhibit 95: Vendors covered
10.2 Market positioning of vendors
Exhibit 96: Matrix on vendor position and classification
10.3 Canon Inc.
Exhibit 97: Canon Inc. - Overview
Exhibit 98: Canon Inc. - Business segments
Exhibit 99: Canon Inc. - Key news
Exhibit 100: Canon Inc. - Key offerings
Exhibit 101: Canon Inc. - Segment focus
Exhibit 102: Carestream Health Inc. - Overview
Exhibit 103: Carestream Health Inc. - Product / Service
Exhibit 104: Carestream Health Inc. - Key offerings
10.5 ContextVision AB
Exhibit 105: ContextVision AB - Overview
Exhibit 106: ContextVision AB - Business segments
Exhibit 107: ContextVision AB - Key offerings
Exhibit 108: ContextVision AB - Segment focus
10.6 Digirad Corp.
Exhibit 109: Digirad Corp. - Overview
Exhibit 110: Digirad Corp. - Business segments
Exhibit 111: Digirad Corp. - Key offerings
Exhibit 112: Digirad Corp. - Segment focus
10.7 Esaote Spa
Exhibit 113: Esaote Spa - Overview
Exhibit 114: Esaote Spa - Product / Service
Exhibit 115: Esaote Spa - Key offerings
Exhibit 116: FUJIFILM Holdings Corp. - Overview
Exhibit 117: FUJIFILM Holdings Corp. - Business segments
Exhibit 118: FUJIFILM Holdings Corp. - Key news
Exhibit 119: FUJIFILM Holdings Corp. - Key offerings
Exhibit 120: FUJIFILM Holdings Corp. - Segment focus
10.9 General Electric Co
Exhibit 121: General Electric Co - Overview
Exhibit 122: General Electric Co - Business segments
Exhibit 123: General Electric Co - Key news
Exhibit 124: General Electric Co - Key offerings
Exhibit 125: General Electric Co - Segment focus
10.10 Hitachi Ltd.
Exhibit 126: Hitachi Ltd. - Overview
Exhibit 127: Hitachi Ltd. - Business segments
Exhibit 128: Hitachi Ltd. - Key news
Exhibit 129: Hitachi Ltd. - Key offerings
Exhibit 130: Hitachi Ltd. - Segment focus
10.11 Koninklijke Philips NV
Exhibit 131: Koninklijke Philips NV - Overview
Exhibit 132: Koninklijke Philips NV - Business segments
Exhibit 133: Koninklijke Philips NV - Key news
Exhibit 134: Koninklijke Philips NV - Key offerings
Exhibit 135: Koninklijke Philips NV - Segment focus
10.12 Samsung Electronics Co. Ltd.
Exhibit 136: Samsung Electronics Co. Ltd. - Overview
Exhibit 137: Samsung Electronics Co. Ltd. - Business segments
Exhibit 138: Samsung Electronics Co. Ltd. - Key news
Exhibit 139: Samsung Electronics Co. Ltd. - Key offerings
Exhibit 140: Samsung Electronics Co. Ltd. - Segment focus
11.1 Scope of the report
11.2 Inclusions and exclusions checklist
Exhibit 141: Inclusions checklist
Exhibit 142: Exclusions checklist
11.3 Currency conversion rates for US$
Exhibit 143: Currency conversion rates for US$
11.4 Research methodology
Exhibit 144: Research methodology
Exhibit 145: Validation techniques employed for market sizing
Exhibit 146: Information sources
11.5 List of abbreviations
Exhibit 147: List of abbreviations
About Us
Technavio is a leading global technology research and advisory company. Their research and analysis focus on emerging market trends and provides actionable insights to help businesses identify market opportunities and develop effective strategies to optimize their market positions. With over 500 specialized analysts, Technavio's report library consists of more than 17,000 reports and counting, covering 800 technologies, spanning across 50 countries. Their client base consists of enterprises of all sizes, including more than 100 Fortune 500 companies. This growing client base relies on Technavio's comprehensive coverage, extensive research, and actionable market insights to identify opportunities in existing and potential markets and assess their competitive positions within changing market scenarios.
Contact
Technavio Research
Jesse Maida
US: +1 844 364 1100
UK: +44 203 893 3200
Email: [email protected]
Website: www.technavio.com/
SOURCE Technavio
For more details,please visit the original website
The content of the article does not represent any opinions of Synapse and its affiliated companies. If there is any copyright infringement or error, please contact us, and we will deal with it within 24 hours.
Organizations
Indications
Targets
-Drugs
-Hot reports


Get started for free today!
Accelerate Strategic R&D decision making with Synapse, PatSnap’s AI-powered Connected Innovation Intelligence Platform Built for Life Sciences Professionals.
Start your data trial now!
Synapse data is also accessible to external entities via APIs or data packages. Leverages most recent intelligence information, enabling fullest potential.