Phosphodiesterase (PDE) Inhibitors Market to Grow by USD 2.86 Bn, 40% of Market Growth to Originate from North America - Technavio
01 Nov 2022
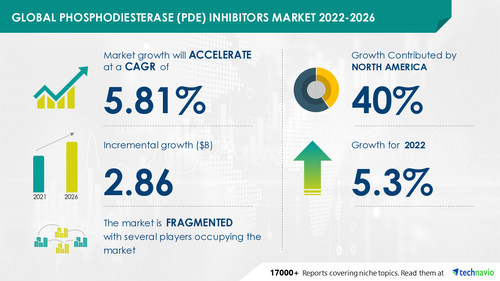
NEW YORK, Nov. 1, 2022 /PRNewswire/ -- The phosphodiesterase (PDE) inhibitors market size is expected to grow by USD 2.86 billion from 2021 to 2026. In addition, the growth momentum of the market will accelerate at a CAGR of 5.81% during the forecast period. The market has been segmented by application (oral, topical, and other ROA) and geography (North America, Europe, Asia, and Rest of World (ROW)).
Find a comprehensive report summary that describes the market size and forecast along with the research methodology.
The FREE sample report
is available in PDF format
Continue Reading
Preview
Source: PRNewswire
Technavio has announced its latest market research report titled Global Phosphodiesterase (PDE) Inhibitors Market 2022-2026
Phosphodiesterase (PDE) Inhibitors Market: Segmentation Analysis
By geography,
North America will lead the thermostatic radiator valve market during the forecast period. The region will account for 40% of the market's growth. The increased consumption of alcohol, tobacco, and adoption of urban lifestyle are the major factors that are contributing to the increased patient pool with lifestyle-related diseases, and thus driving the PDE inhibitorsPDE inhibitors market growth in the region during the forecast period.
Get lifetime access to our Technavio Insights! Subscribe to our
"Basic Plan" billed annually at USD 5000
By application, the oral segment will be the largest contributor to market growth during the forecast period. The oral segment is dominated by PDE inhibitorsPDE inhibitors formulated in tablet dosage forms. Tablets are the most commonly used solid dosage forms, owing to their advantages and increasing popularity. The rising prevalence of various chronic diseases will ensure the continuous adoption of oral PDEPDE inhibitorsPDE inhibitors for their treatment, which would drive segment growth in the coming years.
Learn about the contribution of each segment summarized in concise infographics and thorough descriptions.
Buy Now
to gain access to detailed information about each segment
Phosphodiesterase (PDE) Inhibitors
Market: Driver and Trend
One of the key factors driving the global phosphodiesterase inhibitors industry growth is the growing adoption of poor lifestyle habits, leading to chronic diseases. As per the CDC, excessive alcohol consumption accounts for approximately 88,000 deaths every year in the US. Working adults aged between 20 and 64 years account for 1 in 10 deaths due to excessive alcohol intake. CDC also estimates that nearly 2,000 people smoke their first cigarette before the age of 18 years. Of these, more than 300 people become daily cigarette smokers. Cigarette smoking is responsible for more than 480,000 deaths every year, including 41,000 deaths due to second-hand smoke. Other factors such as rapid urbanization and modernization have further led to the adoption of poor lifestyle habits, which will further increase the risk, thereby, driving the market growth.
The application of novel technologies for PDE inhibitorsPDE inhibitors development is one of the key phosphodiesterase inhibitors market trends that is expected to impact the industry positively in the forecast period. PDE5 enzymes have an amino acid sequence and molecular structure similar to PDE6 and PDE11 and, hence, first-generation PDE5 inhibitors, such as sildenafil and vardenafil, are also competitive inhibitors of PDE6 and PDE11. The application of novel technologies for the development of PDE5 inhibitors is required to decrease their cross-reactivity with PDE6 and PDE11 enzymes. A similarity-based virtual screening technique, such as ZINC database, is used for this. In addition, PDE5 inhibitors, such as tadalafil, are known to block the potassium (K)-dependent HERG1 channel, the cardiac toxicity of the drug was tested through this database. The results thus obtained are of immense importance for researchers to design and develop novel, selective, and safe PDE5 inhibitors, which will further support the market growth.
Identify key trends, drivers, and challenges in the market, which will help vendors improve their strategies to stay ahead of their competitors.
View our FREE PDF Sample Report
Related Reports:
Alpha Glucosidase InhibitorsAlpha Glucosidase Inhibitors Market by Disease Type and Geography – Forecast and Analysis 2022-2026: The alpha-glucosidase inhibitorsalpha-glucosidase inhibitors market share is expected to increase by USD 567.96 million from 2021 to 2026.
Hedgehog Pathway Inhibitors Market by Indication and Geography – Forecast and Analysis 2022-2026: The hedgehog pathway inhibitors market share is expected to increase by USD 385.52 million from 2021 to 2026.
Table of Contents:
1 Executive Summary
1.1 Market Overview
Exhibit 01: Executive Summary – Chart on Market Overview
Exhibit 02: Executive Summary – Data Table on Market Overview
Exhibit 03: Executive Summary – Chart on Global Market Characteristics
Exhibit 04: Executive Summary – Chart on Market by Geography
Exhibit 05: Executive Summary – Chart on Market Segmentation by Application
Exhibit 06: Executive Summary – Chart on Incremental Growth
Exhibit 07: Executive Summary – Data Table on Incremental Growth
Exhibit 08: Executive Summary – Chart on Vendor Market Positioning
2 Market Landscape
2.1 Market ecosystem
Exhibit 09: Parent market
Exhibit 10: Market Characteristics
3 Market Sizing
3.1 Market Definition
Exhibit 11: Offerings of vendors included in the market definition
3.2 Market segment analysis
Exhibit 12: Market segments
3.3 Market size 2021
3.4 Market outlook: Forecast for 2021-2026
Exhibit 13: Chart on Global - Market size and forecast 2021-2026 ($ million)
Exhibit 14: Data Table on Global - Market size and forecast 2021-2026 ($ million)
Exhibit 15: Chart on Global Market: Year-over-year growth 2021-2026 (%)
Exhibit 16: Data Table on Global Market: Year-over-year growth 2021-2026 (%)
4 Five Forces Analysis
4.1 Five forces summary
Exhibit 17: Five forces analysis - Comparison between 2021 and 2026
4.2 Bargaining power of buyers
Exhibit 18: Chart on Bargaining power of buyers – Impact of key factors 2021 and 2026
4.3 Bargaining power of suppliers
Exhibit 19: Bargaining power of suppliers – Impact of key factors in 2021 and 2026
4.4 Threat of new entrants
Exhibit 20: Threat of new entrants – Impact of key factors in 2021 and 2026
4.5 Threat of substitutes
Exhibit 21: Threat of substitutes – Impact of key factors in 2021 and 2026
4.6 Threat of rivalry
Exhibit 22: Threat of rivalry – Impact of key factors in 2021 and 2026
4.7 Market condition
Exhibit 23: Chart on Market condition - Five forces 2021 and 2026
5 Market Segmentation by Application
5.1 Market segments
Exhibit 24: Chart on Application - Market share 2021-2026 (%)
Exhibit 25: Data Table on Application - Market share 2021-2026 (%)
5.2 Comparison by Application
Exhibit 26: Chart on Comparison by Application
Exhibit 27: Data Table on Comparison by Application
5.3 Oral - Market size and forecast 2021-2026
Exhibit 28: Chart on Oral - Market size and forecast 2021-2026 ($ million)
Exhibit 29: Data Table on Oral - Market size and forecast 2021-2026 ($ million)
Exhibit 30: Chart on Oral - Year-over-year growth 2021-2026 (%)
Exhibit 31: Data Table on Oral - Year-over-year growth 2021-2026 (%)
5.4 Topical - Market size and forecast 2021-2026
Exhibit 32: Chart on Topical - Market size and forecast 2021-2026 ($ million)
Exhibit 33: Data Table on Topical - Market size and forecast 2021-2026 ($ million)
Exhibit 34: Chart on Topical - Year-over-year growth 2021-2026 (%)
Exhibit 35: Data Table on Topical - Year-over-year growth 2021-2026 (%)
5.5 Other ROA - Market size and forecast 2021-2026
Exhibit 36: Chart on Other ROA - Market size and forecast 2021-2026 ($ million)
Exhibit 37: Data Table on Other ROA - Market size and forecast 2021-2026 ($ million)
Exhibit 38: Chart on Other ROA - Year-over-year growth 2021-2026 (%)
Exhibit 39: Data Table on Other ROA - Year-over-year growth 2021-2026 (%)
5.6 Market opportunity by Application
Exhibit 40: Market opportunity by Application ($ million)
6 Customer Landscape
6.1 Customer landscape overview
Exhibit 41: Analysis of price sensitivity, lifecycle, customer purchase basket, adoption rates, and purchase criteria
7 Geographic Landscape
7.1 Geographic segmentation
Exhibit 42: Chart on Market share by geography 2021-2026 (%)
Exhibit 43: Data Table on Market share by geography 2021-2026 (%)
7.2 Geographic comparison
Exhibit 44: Chart on Geographic comparison
Exhibit 45: Data Table on Geographic comparison
7.3 North America - Market size and forecast 2021-2026
Exhibit 46: Chart on North America - Market size and forecast 2021-2026 ($ million)
Exhibit 47: Data Table on North America - Market size and forecast 2021-2026 ($ million)
Exhibit 48: Chart on North America - Year-over-year growth 2021-2026 (%)
Exhibit 49: Data Table on North America - Year-over-year growth 2021-2026 (%)
7.4 Europe - Market size and forecast 2021-2026
Exhibit 50: Chart on Europe - Market size and forecast 2021-2026 ($ million)
Exhibit 51: Data Table on Europe - Market size and forecast 2021-2026 ($ million)
Exhibit 52: Chart on Europe - Year-over-year growth 2021-2026 (%)
Exhibit 53: Data Table on Europe - Year-over-year growth 2021-2026 (%)
7.5 Asia - Market size and forecast 2021-2026
Exhibit 54: Chart on Asia - Market size and forecast 2021-2026 ($ million)
Exhibit 55: Data Table on Asia - Market size and forecast 2021-2026 ($ million)
Exhibit 56: Chart on Asia - Year-over-year growth 2021-2026 (%)
Exhibit 57: Data Table on Asia - Year-over-year growth 2021-2026 (%)
7.6 Rest of World (ROW) - Market size and forecast 2021-2026
Exhibit 58: Chart on Rest of World (ROW) - Market size and forecast 2021-2026 ($ million)
Exhibit 59: Data Table on Rest of World (ROW) - Market size and forecast 2021-2026 ($ million)
Exhibit 60: Chart on Rest of World (ROW) - Year-over-year growth 2021-2026 (%)
Exhibit 61: Data Table on Rest of World (ROW) - Year-over-year growth 2021-2026 (%)
7.7 US - Market size and forecast 2021-2026
Exhibit 62: Chart on US - Market size and forecast 2021-2026 ($ million)
Exhibit 63: Data Table on US - Market size and forecast 2021-2026 ($ million)
Exhibit 64: Chart on US - Year-over-year growth 2021-2026 (%)
Exhibit 65: Data Table on US - Year-over-year growth 2021-2026 (%)
7.8 Germany - Market size and forecast 2021-2026
Exhibit 66: Chart on Germany - Market size and forecast 2021-2026 ($ million)
Exhibit 67: Data Table on Germany - Market size and forecast 2021-2026 ($ million)
Exhibit 68: Chart on Germany - Year-over-year growth 2021-2026 (%)
Exhibit 69: Data Table on Germany - Year-over-year growth 2021-2026 (%)
7.9 UK - Market size and forecast 2021-2026
Exhibit 70: Chart on UK - Market size and forecast 2021-2026 ($ million)
Exhibit 71: Data Table on UK - Market size and forecast 2021-2026 ($ million)
Exhibit 72: Chart on UK - Year-over-year growth 2021-2026 (%)
Exhibit 73: Data Table on UK - Year-over-year growth 2021-2026 (%)
7.10 China - Market size and forecast 2021-2026
Exhibit 74: Chart on China - Market size and forecast 2021-2026 ($ million)
Exhibit 75: Data Table on China - Market size and forecast 2021-2026 ($ million)
Exhibit 76: Chart on China - Year-over-year growth 2021-2026 (%)
Exhibit 77: Data Table on China - Year-over-year growth 2021-2026 (%)
7.11 Canada - Market size and forecast 2021-2026
Exhibit 78: Chart on Canada - Market size and forecast 2021-2026 ($ million)
Exhibit 79: Data Table on Canada - Market size and forecast 2021-2026 ($ million)
Exhibit 80: Chart on Canada - Year-over-year growth 2021-2026 (%)
Exhibit 81: Data Table on Canada - Year-over-year growth 2021-2026 (%)
7.12 Market opportunity by geography
Exhibit 82: Market opportunity by geography ($ million)
8 Drivers, Challenges, and Trends
8.1 Market drivers
8.2 Market challenges
8.3 Impact of drivers and challenges
Exhibit 83: Impact of drivers and challenges in 2021 and 2026
8.4 Market trends
9 Vendor Landscape
9.1 Overview
9.2 Vendor landscape
Exhibit 84: Overview on Criticality of inputs and Factors of differentiation
9.3 Landscape disruption
Exhibit 85: Overview on factors of disruption
9.4 Industry risks
Exhibit 86: Impact of key risks on business
10 Vendor Analysis
10.1 Vendors covered
Exhibit 87: Vendors covered
10.2 Market positioning of vendors
Exhibit 88: Matrix on vendor position and classification
10.3 Bayer AG
Exhibit 89: Bayer AG - Overview
Exhibit 90: Bayer AG - Business segments
Exhibit 91: Bayer AG - Key offerings
Exhibit 92: Bayer AG - Segment focus
10.4 Cristalia laboratory
Exhibit 93: Cristalia laboratory - Overview
Exhibit 94: Cristalia laboratory - Product / Service
Exhibit 95: Cristalia laboratory - Key offerings
Exhibit 96: Dong A Socio Holdings Co. Ltd. - Overview
Exhibit 97: Dong A Socio Holdings Co. Ltd. - Product / Service
Exhibit 98: Dong A Socio Holdings Co. Ltd. - Key offerings
10.6 Dr. Reddys Laboratories Ltd.
Exhibit 99: Dr. Reddys Laboratories Ltd. - Overview
Exhibit 100: Dr. Reddys Laboratories Ltd. - Business segments
Exhibit 101: Dr. Reddys Laboratories Ltd. - Key offerings
Exhibit 102: Dr. Reddys Laboratories Ltd. - Segment focus
10.7 Eli Lilly and Co.
Exhibit 103: Eli Lilly and Co. - Overview
Exhibit 104: Eli Lilly and Co. - Product / Service
Exhibit 105: Eli Lilly and Co. - Key offerings
10.8 GlaxoSmithKline Plc
Exhibit 106: GlaxoSmithKline Plc - Overview
Exhibit 107: GlaxoSmithKline Plc - Business segments
Exhibit 108: GlaxoSmithKline Plc - Key news
Exhibit 109: GlaxoSmithKline Plc - Key offerings
Exhibit 110: GlaxoSmithKline Plc - Segment focus
10.9 Pfizer Inc.
Exhibit 111: Pfizer Inc. - Overview
Exhibit 112: Pfizer Inc. - Product / Service
Exhibit 113: Pfizer Inc. - Key news
Exhibit 114: Pfizer Inc. - Key offerings
Exhibit 115: Sun Pharmaceutical Industries Ltd. - Overview
Exhibit 116: Sun Pharmaceutical Industries Ltd. - Product / Service
Exhibit 117: Sun Pharmaceutical Industries Ltd. - Key offerings
Exhibit 118: Teva Pharmaceutical Industries Ltd. - Overview
Exhibit 119: Teva Pharmaceutical Industries Ltd. - Business segments
Exhibit 120: Teva Pharmaceutical Industries Ltd. - Key news
Exhibit 121: Teva Pharmaceutical Industries Ltd. - Key offerings
Exhibit 122: Teva Pharmaceutical Industries Ltd. - Segment focus
10.12 VIVUS LLC
Exhibit 123: VIVUS LLC - Overview
Exhibit 124: VIVUS LLC - Product / Service
Exhibit 125: VIVUS LLC - Key offerings
11.1 Scope of the report
11.2 Inclusions and exclusions checklist
Exhibit 126: Inclusions checklist
Exhibit 127: Exclusions checklist
11.3 Currency conversion rates for US$
Exhibit 128: Currency conversion rates for US$
11.4 Research methodology
Exhibit 129: Research methodology
Exhibit 130: Validation techniques employed for market sizing
Exhibit 131: Information sources
11.5 List of abbreviations
Exhibit 132: List of abbreviations
About Technavio
Technavio is a leading global technology research and advisory company. Their research and analysis focus on emerging market trends and provide actionable insights to help businesses identify market opportunities and develop effective strategies to optimize their market positions.
With over 500 specialized analysts, Technavio's report library consists of more than 17,000 reports and counting, covering 800 technologies, spanning 50 countries. Their client base consists of enterprises of all sizes, including more than 100 Fortune 500 companies. This growing client base relies on Technavio's comprehensive coverage, extensive research, and actionable market insights to identify opportunities in existing and potential markets and assess their competitive positions within changing market scenarios.
Contacts
Technavio Research
Jesse Maida
US: +1 844 364 1100
UK: +44 203 893 3200
Email:
[email protected]
Website:
www.technavio.com/
SOURCE Technavio
For more details,please visit the original website
The content of the article does not represent any opinions of Synapse and its affiliated companies. If there is any copyright infringement or error, please contact us, and we will deal with it within 24 hours.
Organizations
Indications
Drugs
Chat with Hiro
Hot reports


Get started for free today!
Accelerate Strategic R&D decision making with Synapse, PatSnap’s AI-powered Connected Innovation Intelligence Platform Built for Life Sciences Professionals.
Start your data trial now!
Synapse data is also accessible to external entities via APIs or data packages. Empower better decisions with the latest in pharmaceutical intelligence.