POC Diagnostics Market Size to Grow by USD 13.09 Bn, hematology diagnostics to be Largest Revenue-generating Product Segment - Technavio
12 Oct 2022
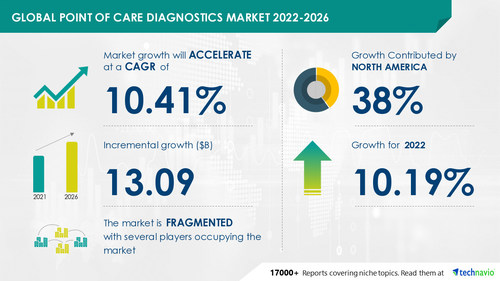
NEW YORK, Oct. 12, 2022 /PRNewswire/ -- The point-of-care (POC) diagnostics market size is set to grow by USD 13.09 billion from 2021 to 2026, according to Technavio. In addition, the growth momentum of the market will accelerate at a CAGR of 10.41% during the forecast period. The growing geriatric population is notably driving the POC diagnostics market growth. However, factors such as product recalls may challenge market growth.
Get a comprehensive report summary that describes the market size and forecast along with research methodology. The FREE sample report is available in PDF format
Continue Reading
Preview
Source: PRNewswire
Technavio has announced its latest market research report titled Global Point of Care Diagnostics Market 2022-2026
POC Diagnostics Market 2022-2026: Segmentation
Product
Hematology Diagnostics
Infectious Disease DiagnosticsInfectious Disease Diagnostics
Rapid Coagulation Diagnostics
Others
End-user
Hospitals And Clinics
Clinical Diagnostic Laboratories
Geography
North America
Europe
Asia
Rest Of World (ROW)
Learn about the contribution of each segment summarized in concise infographics and thorough descriptions. View a FREE PDF Sample Report
POC Diagnostics Market 2022-2026: Revenue-generating Product Segment
The
hematology diagnostics segment will be the largest contributor to market growth during the forecast period. The high incidence rates of thalassemia and anemia are driving the demand for hematology diagnostic products. Blood-related diseases such as hemophilia, thalassemia, and leukemia are highly prevalent in North America. Such diseases can be treated by prescribing blood transfusion and chelation therapy.
POC Diagnostics Market 2022-2026: Vendor Analysis and Scope
To help businesses improve their market position, the POC diagnostics market provides a detailed analysis of around 25 vendors operating in the market. Some of these vendors include Abaxis Inc, Abbott Laboratories, altona Diagnostics GmbH, Becton Dickinson and Co., bioMerieux SA, Chembio Diagnostics Inc., Danaher Corp., DiaSorin SpA, EKF Diagnostics Holdings Plc, F. Hoffmann La Roche Ltd., Johnson and Johnson, Meridian Bioscience Inc., Nova Biomedical Corp., PerkinElmer Inc., PTS Diagnostics, QIAGEN NV, Sekisui Chemical Co. Ltd., Siemens AG, Trinity Biotech Plc, and Trivida Health Inc. The key offerings of some of these vendors are listed below:
Abbott Laboratories - The company offers POC diagnostic solutions with simple step-by-step instructions using a nasal swab and can be used for all ages.
Becton Dickinson and Co. - The company offers POC diagnostic solutions for the direct and qualitative detection of SARS-CoV-2 antigens in nasal swabs from patients with signs and symptoms who are suspected of COVID-19.
Danaher Corp. - The company offers POC diagnostic solutions for glucose, urine albumin, and HbA1c as well as total and differential white blood cell count.
F. Hoffmann La Roche Ltd. - The company offers POC diagnostic solutions to help both healthcare professionals and patients achieve improved clinical and health-economic outcomes by delivering robust, connected immediate results.
PerkinElmer Inc. - The company offers POC diagnostic solutions for the qualitative detection of SARS-CoV-2 nucleocapsid protein antigen in nasal (NS) or nasopharyngeal (NP) swab specimens.
The report also covers the following areas
:
POC Diagnostics Market size
POC Diagnostics Market trends
POC Diagnostics Market industry analysis
Get lifetime access to our Technavio Insights. Subscribe now to our most popular
"Basic Plan" billed annually at USD 5000
. View 100 reports and download 5 reports monthly!
POC Diagnostics Market 2022-2026: Key Highlights
CAGR of the market during the forecast period 2022-2026
Detailed information on factors that will help the POC diagnostics market grow during the next five years
Estimation of the POC diagnostics market size and its contribution to the parent market
Forecasts on upcoming trends and changes in consumer behavior
The growth of the POC diagnostics market
Analysis of the market's competitive landscape and detailed information on vendors
Comprehensive details of factors that will challenge the growth of POC diagnostics market vendors
Related Reports
Pharmacogenomics Market by End-user and Geography - Forecast and Analysis 2022-2026: The pharmacogenomics market share is expected to increase by USD 2.50 billion from 2021 to 2026.
Heart Attack Diagnostics Market by End-User and Geography - Forecast and Analysis 2022-2026: The heart attack diagnostics market share is expected to increase by USD 5.34 billion from 2021 to 2026.
Browse Health Care Market Reports
Table of Contents
1 Executive Summary
1.1 Market overview
Exhibit 01: Executive Summary – Chart on Market Overview
Exhibit 02: Executive Summary – Data Table on Market Overview
Exhibit 03: Executive Summary – Chart on Global Market Characteristics
Exhibit 04: Executive Summary – Chart on Market by Geography
Exhibit 05: Executive Summary – Chart on Market Segmentation by Product
Exhibit 06: Executive Summary – Chart on Market Segmentation by End-user
Exhibit 07: Executive Summary – Chart on Incremental Growth
Exhibit 08: Executive Summary – Data Table on Incremental Growth
Exhibit 09: Executive Summary – Chart on Vendor Market Positioning
2 Market Landscape
2.1 Market ecosystem
Exhibit 10: Parent market
Exhibit 11: Market Characteristics
3 Market Sizing
3.1 Market definition
Exhibit 12: Offerings of vendors included in the market definition
3.2 Market segment analysis
Exhibit 13: Market segments
3.3 Market size 2021
3.4 Market outlook: Forecast for 2021-2026
Exhibit 14: Chart on Global - Market size and forecast 2021-2026 ($ million)
Exhibit 15: Data Table on Global - Market size and forecast 2021-2026 ($ million)
Exhibit 16: Chart on Global Market: Year-over-year growth 2021-2026 (%)
Exhibit 17: Data Table on Global Market: Year-over-year growth 2021-2026 (%)
4 Five Forces Analysis
4.1 Five forces summary
Exhibit 18: Five forces analysis - Comparison between 2021 and 2026
4.2 Bargaining power of buyers
Exhibit 19: Chart on Bargaining power of buyers – Impact of key factors 2021 and 2026
4.3 Bargaining power of suppliers
Exhibit 20: Bargaining power of suppliers – Impact of key factors in 2021 and 2026
4.4 Threat of new entrants
Exhibit 21: Threat of new entrants – Impact of key factors in 2021 and 2026
4.5 Threat of substitutes
Exhibit 22: Threat of substitutes – Impact of key factors in 2021 and 2026
4.6 Threat of rivalry
Exhibit 23: Threat of rivalry – Impact of key factors in 2021 and 2026
4.7 Market condition
Exhibit 24: Chart on Market condition - Five forces 2021 and 2026
5 Market Segmentation by Product
5.1 Market segments
Exhibit 25: Chart on Product - Market share 2021-2026 (%)
Exhibit 26: Data Table on Product - Market share 2021-2026 (%)
5.2 Comparison by Product
Exhibit 27: Chart on Comparison by Product
Exhibit 28: Data Table on Comparison by Product
5.3 Hematology diagnostics - Market size and forecast 2021-2026
Exhibit 29: Chart on Hematology diagnostics - Market size and forecast 2021-2026 ($ million)
Exhibit 30: Data Table on Hematology diagnostics - Market size and forecast 2021-2026 ($ million)
Exhibit 31: Chart on Hematology diagnostics - Year-over-year growth 2021-2026 (%)
Exhibit 32: Data Table on Hematology diagnostics - Year-over-year growth 2021-2026 (%)
5.4 InfectiousInfectious disease diagnostics - Market size and forecast 2021-2026
Exhibit 33: Chart on Infectious disease diagnostics - Market size and forecast 2021-2026 ($ million)
Exhibit 34: Data Table on Infectious disease diagnostics - Market size and forecast 2021-2026 ($ million)
Exhibit 35: Chart on Infectious disease diagnostics - Year-over-year growth 2021-2026 (%)
Exhibit 36: Data Table on Infectious disease diagnostics - Year-over-year growth 2021-2026 (%)
5.5 Rapid cardiovascular diagnostics - Market size and forecast 2021-2026
Exhibit 37: Chart on Rapid cardiovascular diagnostics - Market size and forecast 2021-2026 ($ million)
Exhibit 38: Data Table on Rapid cardiovascular diagnostics - Market size and forecast 2021-2026 ($ million)
Exhibit 39: Chart on Rapid cardiovascular diagnostics - Year-over-year growth 2021-2026 (%)
Exhibit 40: Data Table on Rapid cardiovascular diagnostics - Year-over-year growth 2021-2026 (%)
5.6 Rapid coagulation diagnostics - Market size and forecast 2021-2026
Exhibit 41: Chart on Rapid coagulation diagnostics - Market size and forecast 2021-2026 ($ million)
Exhibit 42: Data Table on Rapid coagulation diagnostics - Market size and forecast 2021-2026 ($ million)
Exhibit 43: Chart on Rapid coagulation diagnostics - Year-over-year growth 2021-2026 (%)
Exhibit 44: Data Table on Rapid coagulation diagnostics - Year-over-year growth 2021-2026 (%)
5.7 Others - Market size and forecast 2021-2026
Exhibit 45: Chart on Others - Market size and forecast 2021-2026 ($ million)
Exhibit 46: Data Table on Others - Market size and forecast 2021-2026 ($ million)
Exhibit 47: Chart on Others - Year-over-year growth 2021-2026 (%)
Exhibit 48: Data Table on Others - Year-over-year growth 2021-2026 (%)
5.8 Market opportunity by Product
Exhibit 49: Market opportunity by Product ($ million)
6 Market Segmentation by End-user
6.1 Market segments
Exhibit 50: Chart on End-user - Market share 2021-2026 (%)
Exhibit 51: Data Table on End-user - Market share 2021-2026 (%)
6.2 Comparison by End-user
Exhibit 52: Chart on Comparison by End-user
Exhibit 53: Data Table on Comparison by End-user
6.3 Hospitals and clinics - Market size and forecast 2021-2026
Exhibit 54: Chart on Hospitals and clinics - Market size and forecast 2021-2026 ($ million)
Exhibit 55: Data Table on Hospitals and clinics - Market size and forecast 2021-2026 ($ million)
Exhibit 56: Chart on Hospitals and clinics - Year-over-year growth 2021-2026 (%)
Exhibit 57: Data Table on Hospitals and clinics - Year-over-year growth 2021-2026 (%)
6.4 Homecare settings - Market size and forecast 2021-2026
Exhibit 58: Chart on Homecare settings - Market size and forecast 2021-2026 ($ million)
Exhibit 59: Data Table on Homecare settings - Market size and forecast 2021-2026 ($ million)
Exhibit 60: Chart on Homecare settings - Year-over-year growth 2021-2026 (%)
Exhibit 61: Data Table on Homecare settings - Year-over-year growth 2021-2026 (%)
6.5 Clinical diagnostic laboratories - Market size and forecast 2021-2026
Exhibit 62: Chart on Clinical diagnostic laboratories - Market size and forecast 2021-2026 ($ million)
Exhibit 63: Data Table on Clinical diagnostic laboratories - Market size and forecast 2021-2026 ($ million)
Exhibit 64: Chart on Clinical diagnostic laboratories - Year-over-year growth 2021-2026 (%)
Exhibit 65: Data Table on Clinical diagnostic laboratories - Year-over-year growth 2021-2026 (%)
6.6 Market opportunity by End-user
Exhibit 66: Market opportunity by End-user ($ million)
7 Customer Landscape
7.1 Customer landscape overview
Exhibit 67: Analysis of price sensitivity, lifecycle, customer purchase basket, adoption rates, and purchase criteria
8 Geographic Landscape
8.1 Geographic segmentation
Exhibit 68: Chart on Market share by geography 2021-2026 (%)
Exhibit 69: Data Table on Market share by geography 2021-2026 (%)
8.2 Geographic comparison
Exhibit 70: Chart on Geographic comparison
Exhibit 71: Data Table on Geographic comparison
8.3 North America - Market size and forecast 2021-2026
Exhibit 72: Chart on North America - Market size and forecast 2021-2026 ($ million)
Exhibit 73: Data Table on North America - Market size and forecast 2021-2026 ($ million)
Exhibit 74: Chart on North America - Year-over-year growth 2021-2026 (%)
Exhibit 75: Data Table on North America - Year-over-year growth 2021-2026 (%)
8.4 Europe - Market size and forecast 2021-2026
Exhibit 76: Chart on Europe - Market size and forecast 2021-2026 ($ million)
Exhibit 77: Data Table on Europe - Market size and forecast 2021-2026 ($ million)
Exhibit 78: Chart on Europe - Year-over-year growth 2021-2026 (%)
Exhibit 79: Data Table on Europe - Year-over-year growth 2021-2026 (%)
8.5 Asia - Market size and forecast 2021-2026
Exhibit 80: Chart on Asia - Market size and forecast 2021-2026 ($ million)
Exhibit 81: Data Table on Asia - Market size and forecast 2021-2026 ($ million)
Exhibit 82: Chart on Asia - Year-over-year growth 2021-2026 (%)
Exhibit 83: Data Table on Asia - Year-over-year growth 2021-2026 (%)
8.6 Rest of World (ROW) - Market size and forecast 2021-2026
Exhibit 84: Chart on Rest of World (ROW) - Market size and forecast 2021-2026 ($ million)
Exhibit 85: Data Table on Rest of World (ROW) - Market size and forecast 2021-2026 ($ million)
Exhibit 86: Chart on Rest of World (ROW) - Year-over-year growth 2021-2026 (%)
Exhibit 87: Data Table on Rest of World (ROW) - Year-over-year growth 2021-2026 (%)
8.7 US - Market size and forecast 2021-2026
Exhibit 88: Chart on US - Market size and forecast 2021-2026 ($ million)
Exhibit 89: Data Table on US - Market size and forecast 2021-2026 ($ million)
Exhibit 90: Chart on US - Year-over-year growth 2021-2026 (%)
Exhibit 91: Data Table on US - Year-over-year growth 2021-2026 (%)
8.8 Canada - Market size and forecast 2021-2026
Exhibit 92: Chart on Canada - Market size and forecast 2021-2026 ($ million)
Exhibit 93: Data Table on Canada - Market size and forecast 2021-2026 ($ million)
Exhibit 94: Chart on Canada - Year-over-year growth 2021-2026 (%)
Exhibit 95: Data Table on Canada - Year-over-year growth 2021-2026 (%)
8.9 Germany - Market size and forecast 2021-2026
Exhibit 96: Chart on Germany - Market size and forecast 2021-2026 ($ million)
Exhibit 97: Data Table on Germany - Market size and forecast 2021-2026 ($ million)
Exhibit 98: Chart on Germany - Year-over-year growth 2021-2026 (%)
Exhibit 99: Data Table on Germany - Year-over-year growth 2021-2026 (%)
8.10 UK - Market size and forecast 2021-2026
Exhibit 100: Chart on UK - Market size and forecast 2021-2026 ($ million)
Exhibit 101: Data Table on UK - Market size and forecast 2021-2026 ($ million)
Exhibit 102: Chart on UK - Year-over-year growth 2021-2026 (%)
Exhibit 103: Data Table on UK - Year-over-year growth 2021-2026 (%)
8.11 Japan - Market size and forecast 2021-2026
Exhibit 104: Chart on Japan - Market size and forecast 2021-2026 ($ million)
Exhibit 105: Data Table on Japan - Market size and forecast 2021-2026 ($ million)
Exhibit 106: Chart on Japan - Year-over-year growth 2021-2026 (%)
Exhibit 107: Data Table on Japan - Year-over-year growth 2021-2026 (%)
8.12 China - Market size and forecast 2021-2026
Exhibit 108: Chart on China - Market size and forecast 2021-2026 ($ million)
Exhibit 109: Data Table on China - Market size and forecast 2021-2026 ($ million)
Exhibit 110: Chart on China - Year-over-year growth 2021-2026 (%)
Exhibit 111: Data Table on China - Year-over-year growth 2021-2026 (%)
8.13 Market opportunity by geography
Exhibit 112: Market opportunity by geography ($ million)
9 Drivers, Challenges, and Trends
9.1 Market drivers
9.2 Market challenges
9.3 Impact of drivers and challenges
Exhibit 113: Impact of drivers and challenges in 2021 and 2026
9.4 Market trends
10 Vendor Landscape
10.1 Overview
10.2 Vendor landscape
Exhibit 114: Overview on Criticality of inputs and Factors of differentiation
10.3 Landscape disruption
Exhibit 115: Overview on factors of disruption
10.4 Industry risks
Exhibit 116: Impact of key risks on business
11 Vendor Analysis
11.1 Vendors covered
Exhibit 117: Vendors covered
11.2 Market positioning of vendors
Exhibit 118: Matrix on vendor position and classification
11.3 Abbott Laboratories
Exhibit 119: Abbott Laboratories - Overview
Exhibit 120: Abbott Laboratories - Business segments
Exhibit 121: Abbott Laboratories - Key news
Exhibit 122: Abbott Laboratories - Key offerings
Exhibit 123: Abbott Laboratories - Segment focus
Exhibit 124: Becton Dickinson and Co. - Overview
Exhibit 125: Becton Dickinson and Co. - Business segments
Exhibit 126: Becton Dickinson and Co. - Key news
Exhibit 127: Becton Dickinson and Co. - Key offerings
Exhibit 128: Becton Dickinson and Co. - Segment focus
11.5 Danaher Corp.
Exhibit 129: Danaher Corp. - Overview
Exhibit 130: Danaher Corp. - Business segments
Exhibit 131: Danaher Corp. - Key news
Exhibit 132: Danaher Corp. - Key offerings
Exhibit 133: Danaher Corp. - Segment focus
11.6 F. Hoffmann La Roche Ltd.
Exhibit 134: F. Hoffmann La Roche Ltd. - Overview
Exhibit 135: F. Hoffmann La Roche Ltd. - Business segments
Exhibit 136: F. Hoffmann La Roche Ltd. - Key news
Exhibit 137: F. Hoffmann La Roche Ltd. - Key offerings
Exhibit 138: F. Hoffmann La Roche Ltd. - Segment focus
11.7 PerkinElmer Inc.
Exhibit 139: PerkinElmer Inc. - Overview
Exhibit 140: PerkinElmer Inc. - Business segments
Exhibit 141: PerkinElmer Inc. - Key news
Exhibit 142: PerkinElmer Inc. - Key offerings
Exhibit 143: PerkinElmer Inc. - Segment focus
11.8 PTS Diagnostics
Exhibit 144: PTS Diagnostics - Overview
Exhibit 145: PTS Diagnostics - Product / Service
Exhibit 146: PTS Diagnostics - Key offerings
11.9 QIAGEN NV
Exhibit 147: QIAGEN NV - Overview
Exhibit 148: QIAGEN NV - Product / Service
Exhibit 149: QIAGEN NV - Key news
Exhibit 150: QIAGEN NV - Key offerings
11.10 Sekisui Chemical Co. Ltd.
Exhibit 151: Sekisui Chemical Co. Ltd. - Overview
Exhibit 152: Sekisui Chemical Co. Ltd. - Business segments
Exhibit 153: Sekisui Chemical Co. Ltd. - Key offerings
Exhibit 154: Sekisui Chemical Co. Ltd. - Segment focus
11.11 Siemens AG
Exhibit 155: Siemens AG - Overview
Exhibit 156: Siemens AG - Business segments
Exhibit 157: Siemens AG - Key news
Exhibit 158: Siemens AG - Key offerings
Exhibit 159: Siemens AG - Segment focus
11.12 Trinity Biotech Plc
Exhibit 160: Trinity Biotech Plc - Overview
Exhibit 161: Trinity Biotech Plc - Product / Service
Exhibit 162: Trinity Biotech Plc - Key offerings
12.1 Scope of the report
12.2 Inclusions and exclusions checklist
Exhibit 163: Inclusions checklist
Exhibit 164: Exclusions checklist
12.3 Currency conversion rates for US$
Exhibit 165: Currency conversion rates for US$
12.4 Research methodology
Exhibit 166: Research methodology
Exhibit 167: Validation techniques employed for market sizing
Exhibit 168: Information sources
12.5 List of abbreviations
Exhibit 169: List of abbreviations
About Us
Technavio is a leading global technology research and advisory company. Their research and analysis focus on emerging market trends and provide actionable insights to help businesses identify market opportunities and develop effective strategies to optimize their market positions. With over 500 specialized analysts, Technavio's report library consists of more than 17,000 reports and counting, covering 800 technologies, spanning across 50 countries. Their client base consists of enterprises of all sizes, including more than 100 Fortune 500 companies. This growing client base relies on Technavio's comprehensive coverage, extensive research, and actionable market insights to identify opportunities in existing and potential markets and assess their competitive positions within changing market scenarios.
Contact
Technavio Research
Jesse Maida
US: +1 844 364 1100
UK: +44 203 893 3200
Email: [email protected]
Website: www.technavio.com/
SOURCE Technavio
For more details,please visit the original website
The content of the article does not represent any opinions of Synapse and its affiliated companies. If there is any copyright infringement or error, please contact us, and we will deal with it within 24 hours.

Indications
Targets
-Drugs
-Chat with Hiro
Hot reports


Get started for free today!
Accelerate Strategic R&D decision making with Synapse, PatSnap’s AI-powered Connected Innovation Intelligence Platform Built for Life Sciences Professionals.
Start your data trial now!
Synapse data is also accessible to external entities via APIs or data packages. Empower better decisions with the latest in pharmaceutical intelligence.