Proteasome InhibitorsProteasome Inhibitors Market Size to Grow by USD 2.20 billion | 43% of Market Growth to Originate from North America | Technavio
13 Jun 2022
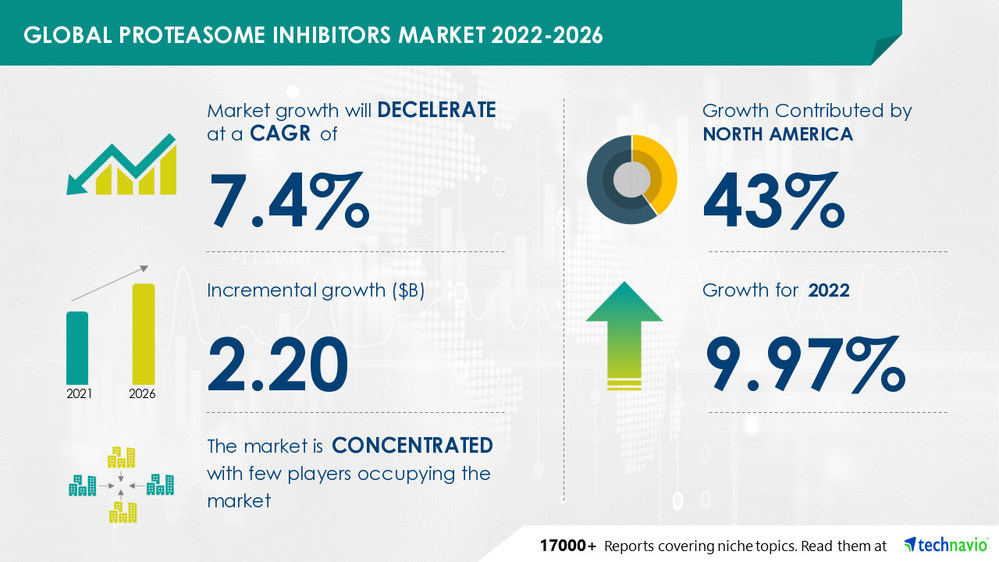
NEW YORK, June 13, 2022 /PRNewswire/ -- The proteasome inhibitorsproteasome inhibitors market is concentrated, and the vendors are deploying growth strategies such as strategic alliances to compete in the market. The market size is expected to grow by USD 2.20 bn from 2021 to 2026. However, the growth momentum of the market will decelerate at a CAGR of 7.4% during the forecast period.
For more information about market dynamics,
View our Sample Report Now
Preview
Source: PRNewswire
Technavio has announced its latest market research report titled Proteasome InhibitorsProteasome Inhibitors Market by Product and Geography - Forecast and Analysis 2022-2026
Top Key players in Proteasome InhibitorsProteasome Inhibitors Market
Fresenius SE and Co. KGaA
Johnson and Johnson
Find more information about key vendors and their offerings.
Download an Exclusive Sample Report
Market Driver and Challenge
The
huge unmet need is one of the key drivers of the market. For instance, the market has very few approved therapies for the treatment of pancreatic cancer. Various vendors are developing proteasome inhibitorsproteasome inhibitors in the late stages of clinical trials for multiple myeloma and two drugs for pancreatic cancer. Thus, the unmet need is expected to attract various large and mid-sized pharmaceutical vendors to conduct studies and launch products.
The
threat from biologics is challenging the growth of the market. Various vendors are developing drugs for the treatment of solid tumors such as pancreatic cancer and malignant melanoma. For instance, AbbVie is developing KYPROLIS, which is in the phase II stage of clinical trials for the treatment of prostate cancer and renal cell carcinoma. Similarly, Takeda is developing VELCADE, which is in the Phase II stage of clinical trials for the treatment of glioma. Vendors face a threat from substitutes, with the increasing number of highly effective biologics such as PD-1 and PD-L1 inhibitorsPD-L1 inhibitors.
Market Segmentation
Proteasome InhibitorsProteasome Inhibitors Market Split by Product
VELCADE: This segment will have the highest market share growth during the forecast period. VELCADE inhibits the proteasome enzyme complex within the cell, which is a part of the cellular machinery. It also plays a major role in the regulation of cell division and cell survival. Such factors of VELCADE will drive the growth of the proteasome inhibitorsproteasome inhibitors market during the forecast period.
NINLARO
Others
Proteasome InhibitorsProteasome Inhibitors Market Split by Geography
North America: This region will have the highest market share growth during the forecast period. This growth is attributed to factors such as advanced healthcare infrastructure. However, market growth in this region will be slower than the growth of the market in other regions. The US and Canada are the key countries for the proteasome inhibitorsproteasome inhibitors market in North America.
Europe
Asia
Rest of World (ROW)
Imperative Insights on the following aspects:
What was the size of the global proteasome inhibitorsproteasome inhibitors industry by value in 2020?
What will be the size of the global proteasome inhibitorsproteasome inhibitors industry in 2026?
What factors are affecting the strength of competition in the global proteasome inhibitorsproteasome inhibitors industry?
How has the industry performed over the last five years?
What are the main segments that make up the global proteasome inhibitorsproteasome inhibitors market?
Subscribe to our
"Basic Plan" billed annually at USD 5000.
Get lifetime access to our Technavio Insights
Why buy?
Identify factors affecting growth prospects across markets.
Track competitor gains and losses in market share.
Get a Holistic View of the Market
Related Reports:
BRAF Kinase InhibitorsBRAF Kinase Inhibitors Market by Product and Geography - Forecast and Analysis 2022-2026
Anaplastic Thyroid Cancer Drugs Market by Product and Geography - Forecast and Analysis 2022-2026
Table of Content:
1 Executive Summary
1.1 Market overview
Exhibit 01: Executive Summary – Chart on Market Overview
Exhibit 02: Executive Summary – Data Table on Market Overview
Exhibit 03: Executive Summary – Chart on Global Market Characteristics
Exhibit 04: Executive Summary – Chart on Market by Geography
Exhibit 05: Executive Summary – Chart on Market Segmentation by Product
Exhibit 06: Executive Summary – Chart on Incremental Growth
Exhibit 07: Executive Summary – Data Table on Incremental Growth
Exhibit 08: Executive Summary – Chart on Vendor Market Positioning
2 Market Landscape
2.1 Market ecosystem
Exhibit 09: Parent market
Exhibit 10: Market Characteristics
3 Market Sizing
3.1 Market definition
Exhibit 11: Offerings of vendors included in the market definition
3.2 Market segment analysis
Exhibit 12: Market segments
3.3 Market size 2021
3.4 Market outlook: Forecast for 2021-2026
Exhibit 13: Chart on Global - Market size and forecast 2021-2026 ($ million)
Exhibit 14: Data Table on Global - Market size and forecast 2021-2026 ($ million)
Exhibit 15: Chart on Global Market: Year-over-year growth 2021-2026 (%)
Exhibit 16: Data Table on Global Market: Year-over-year growth 2021-2026 (%)
4 Five Forces Analysis
4.1 Five forces summary
Exhibit 17: Five forces analysis - Comparison between 2021 and 2026
4.2 Bargaining power of buyers
Exhibit 18: Chart on Bargaining power of buyers – Impact of key factors 2021 and 2026
4.3 Bargaining power of suppliers
Exhibit 19: Bargaining power of suppliers – Impact of key factors in 2021 and 2026
4.4 Threat of new entrants
Exhibit 20: Threat of new entrants – Impact of key factors in 2021 and 2026
4.5 Threat of substitutes
Exhibit 21: Threat of substitutes – Impact of key factors in 2021 and 2026
4.6 Threat of rivalry
Exhibit 22: Threat of rivalry – Impact of key factors in 2021 and 2026
4.7 Market condition
Exhibit 23: Chart on Market condition - Five forces 2021 and 2026
5 Market Segmentation by Product
5.1 Market segments
Exhibit 24: Chart on Product - Market share 2021-2026 (%)
Exhibit 25: Data Table on Product - Market share 2021-2026 (%)
5.2 Comparison by Product
Exhibit 26: Chart on Comparison by Product
Exhibit 27: Data Table on Comparison by Product
5.3 VELCADE - Market size and forecast 2021-2026
Exhibit 28: Chart on VELCADE - Market size and forecast 2021-2026 ($ million)
Exhibit 29: Data Table on VELCADE - Market size and forecast 2021-2026 ($ million)
Exhibit 30: Chart on VELCADE - Year-over-year growth 2021-2026 (%)
Exhibit 31: Data Table on VELCADE - Year-over-year growth 2021-2026 (%)
5.4 KYPROLIS - Market size and forecast 2021-2026
Exhibit 32: Chart on KYPROLIS - Market size and forecast 2021-2026 ($ million)
Exhibit 33: Data Table on KYPROLIS - Market size and forecast 2021-2026 ($ million)
Exhibit 34: Chart on KYPROLIS - Year-over-year growth 2021-2026 (%)
Exhibit 35: Data Table on KYPROLIS - Year-over-year growth 2021-2026 (%)
5.5 NINLARO - Market size and forecast 2021-2026
Exhibit 36: Chart on NINLARO - Market size and forecast 2021-2026 ($ million)
Exhibit 37: Data Table on NINLARO - Market size and forecast 2021-2026 ($ million)
Exhibit 38: Chart on NINLARO - Year-over-year growth 2021-2026 (%)
Exhibit 39: Data Table on NINLARO - Year-over-year growth 2021-2026 (%)
5.6 Others - Market size and forecast 2021-2026
Exhibit 40: Chart on Others - Market size and forecast 2021-2026 ($ million)
Exhibit 41: Data Table on Others - Market size and forecast 2021-2026 ($ million)
Exhibit 42: Chart on Others - Year-over-year growth 2021-2026 (%)
Exhibit 43: Data Table on Others - Year-over-year growth 2021-2026 (%)
5.7 Market opportunity by Product
Exhibit 44: Market opportunity by Product ($ million)
6 Customer Landscape
6.1 Customer landscape overview
Exhibit 45: Analysis of price sensitivity, lifecycle, customer purchase basket, adoption rates, and purchase criteria
7 Geographic Landscape
7.1 Geographic segmentation
Exhibit 46: Chart on Market share by geography 2021-2026 (%)
Exhibit 47: Data Table on Market share by geography 2021-2026 (%)
7.2 Geographic comparison
Exhibit 48: Chart on Geographic comparison
Exhibit 49: Data Table on Geographic comparison
7.3 North America - Market size and forecast 2021-2026
Exhibit 50: Chart on North America - Market size and forecast 2021-2026 ($ million)
Exhibit 51: Data Table on North America - Market size and forecast 2021-2026 ($ million)
Exhibit 52: Chart on North America - Year-over-year growth 2021-2026 (%)
Exhibit 53: Data Table on North America - Year-over-year growth 2021-2026 (%)
7.4 Europe - Market size and forecast 2021-2026
Exhibit 54: Chart on Europe - Market size and forecast 2021-2026 ($ million)
Exhibit 55: Data Table on Europe - Market size and forecast 2021-2026 ($ million)
Exhibit 56: Chart on Europe - Year-over-year growth 2021-2026 (%)
Exhibit 57: Data Table on Europe - Year-over-year growth 2021-2026 (%)
7.5 Asia - Market size and forecast 2021-2026
Exhibit 58: Chart on Asia - Market size and forecast 2021-2026 ($ million)
Exhibit 59: Data Table on Asia - Market size and forecast 2021-2026 ($ million)
Exhibit 60: Chart on Asia - Year-over-year growth 2021-2026 (%)
Exhibit 61: Data Table on Asia - Year-over-year growth 2021-2026 (%)
7.6 Rest of World (ROW) - Market size and forecast 2021-2026
Exhibit 62: Chart on Rest of World (ROW) - Market size and forecast 2021-2026 ($ million)
Exhibit 63: Data Table on Rest of World (ROW) - Market size and forecast 2021-2026 ($ million)
Exhibit 64: Chart on Rest of World (ROW) - Year-over-year growth 2021-2026 (%)
Exhibit 65: Data Table on Rest of World (ROW) - Year-over-year growth 2021-2026 (%)
7.7 US - Market size and forecast 2021-2026
Exhibit 66: Chart on US - Market size and forecast 2021-2026 ($ million)
Exhibit 67: Data Table on US - Market size and forecast 2021-2026 ($ million)
Exhibit 68: Chart on US - Year-over-year growth 2021-2026 (%)
Exhibit 69: Data Table on US - Year-over-year growth 2021-2026 (%)
7.8 UK - Market size and forecast 2021-2026
Exhibit 70: Chart on UK - Market size and forecast 2021-2026 ($ million)
Exhibit 71: Data Table on UK - Market size and forecast 2021-2026 ($ million)
Exhibit 72: Chart on UK - Year-over-year growth 2021-2026 (%)
Exhibit 73: Data Table on UK - Year-over-year growth 2021-2026 (%)
7.9 Germany - Market size and forecast 2021-2026
Exhibit 74: Chart on Germany - Market size and forecast 2021-2026 ($ million)
Exhibit 75: Data Table on Germany - Market size and forecast 2021-2026 ($ million)
Exhibit 76: Chart on Germany - Year-over-year growth 2021-2026 (%)
Exhibit 77: Data Table on Germany - Year-over-year growth 2021-2026 (%)
7.10 Canada - Market size and forecast 2021-2026
Exhibit 78: Chart on Canada - Market size and forecast 2021-2026 ($ million)
Exhibit 79: Data Table on Canada - Market size and forecast 2021-2026 ($ million)
Exhibit 80: Chart on Canada - Year-over-year growth 2021-2026 (%)
Exhibit 81: Data Table on Canada - Year-over-year growth 2021-2026 (%)
7.11 France - Market size and forecast 2021-2026
Exhibit 82: Chart on France - Market size and forecast 2021-2026 ($ million)
Exhibit 83: Data Table on France - Market size and forecast 2021-2026 ($ million)
Exhibit 84: Chart on France - Year-over-year growth 2021-2026 (%)
Exhibit 85: Data Table on France - Year-over-year growth 2021-2026 (%)
7.12 Market opportunity by geography
Exhibit 86: Market opportunity by geography ($ million)
8 Drivers, Challenges, and Trends
8.1 Market drivers
8.2 Market challenges
8.3 Impact of drivers and challenges
Exhibit 87: Impact of drivers and challenges in 2021 and 2026
8.4 Market trends
9 Vendor Landscape
9.1 Overview
9.2 Vendor landscape
Exhibit 88: Overview on Criticality of inputs and Factors of differentiation
9.3 Landscape disruption
Exhibit 89: Overview on factors of disruption
9.4 Industry risks
Exhibit 90: Impact of key risks on business
10 Vendor Analysis
10.1 Vendors covered
Exhibit 91: Vendors covered
10.2 Market positioning of vendors
Exhibit 92: Matrix on vendor position and classification
10.3 AbbVie Inc.
Exhibit 93: AbbVie Inc. - Overview
Exhibit 94: AbbVie Inc. - Product / Service
Exhibit 95: AbbVie Inc. - Key offerings
10.4 Accuitis Inc.
Exhibit 96: Accuitis Inc. - Overview
Exhibit 97: Accuitis Inc. - Product / Service
Exhibit 98: Accuitis Inc. - Key offerings
10.5 Amgen Inc.
Exhibit 99: Amgen Inc. - Overview
Exhibit 100: Amgen Inc. - Product / Service
Exhibit 101: Amgen Inc. - Key offerings
Exhibit 102: Bristol Myers Squibb Co. - Overview
Exhibit 103: Bristol Myers Squibb Co. - Product / Service
Exhibit 104: Bristol Myers Squibb Co. - Key offerings
Exhibit 105: Cantex Pharmaceuticals Inc. - Overview
Exhibit 106: Cantex Pharmaceuticals Inc. - Product / Service
Exhibit 107: Cantex Pharmaceuticals Inc. - Key news
Exhibit 108: Cantex Pharmaceuticals Inc. - Key offerings
10.8 Fresenius SE and Co. KGaA
Exhibit 109: Fresenius SE and Co. KGaA - Overview
Exhibit 110: Fresenius SE and Co. KGaA - Business segments
Exhibit 111: Fresenius SE and Co. KGaA - Key news
Exhibit 112: Fresenius SE and Co. KGaA - Key offerings
Exhibit 113: Fresenius SE and Co. KGaA - Segment focus
10.9 Johnson and Johnson
Exhibit 114: Johnson and Johnson - Overview
Exhibit 115: Johnson and Johnson - Business segments
Exhibit 116: Johnson and Johnson - Key news
Exhibit 117: Johnson and Johnson - Key offerings
Exhibit 118: Johnson and Johnson - Segment focus
Exhibit 119: Takeda Pharmaceutical Co. Ltd. - Overview
Exhibit 120: Takeda Pharmaceutical Co. Ltd. - Product / Service
Exhibit 121: Takeda Pharmaceutical Co. Ltd. - Key news
Exhibit 122: Takeda Pharmaceutical Co. Ltd. - Key offerings
10.11 TG Therapeutics Inc.
Exhibit 123: TG Therapeutics Inc. - Overview
Exhibit 124: TG Therapeutics Inc. - Product / Service
Exhibit 125: TG Therapeutics Inc. - Key offerings
11.1 Scope of the report
11.2 Inclusions and exclusions checklist
Exhibit 126: Inclusions checklist
Exhibit 127: Exclusions checklist
11.3 Currency conversion rates for US$
Exhibit 128: Currency conversion rates for US$
11.4 Research methodology
Exhibit 129: Research methodology
Exhibit 130: Validation techniques employed for market sizing
Exhibit 131: Information sources
11.5 List of abbreviations
Exhibit 132: List of abbreviations
About Us
Technavio is a leading global technology research and advisory company. Their research and analysis focus on emerging market trends and provide actionable insights to help businesses identify market opportunities and develop effective strategies to optimize their market positions. With over 500 specialized analysts, Technavio's report library consists of more than 17,000 reports and counting, covering 800 technologies, spanning across 50 countries. Their client base consists of enterprises of all sizes, including more than 100 Fortune 500 companies. This growing client base relies on Technavio's comprehensive coverage, extensive research, and actionable market insights to identify opportunities in existing and potential markets and assess their competitive positions within changing market scenarios.
Contact Us:
Technavio Research
Jesse Maida
US: +1 844 364 1100
UK: +44 203 893 3200
Email: [email protected]
Website: www.technavio.com/
SOURCE Technavio
For more details,please visit the original website
The content of the article does not represent any opinions of Synapse and its affiliated companies. If there is any copyright infringement or error, please contact us, and we will deal with it within 24 hours.
Organizations
Indications
Targets
Drugs
Chat with Hiro
Hot reports


Get started for free today!
Accelerate Strategic R&D decision making with Synapse, PatSnap’s AI-powered Connected Innovation Intelligence Platform Built for Life Sciences Professionals.
Start your data trial now!
Synapse data is also accessible to external entities via APIs or data packages. Empower better decisions with the latest in pharmaceutical intelligence.