Human Chorionic Gonadotropin (hCG) Market to grow by USD 303.49 Mn; Driven by an increase in the prevalence of infertility - Technavio
09 Nov 2022
NEW YORK, Nov. 9, 2022 /PRNewswire/ -- The "
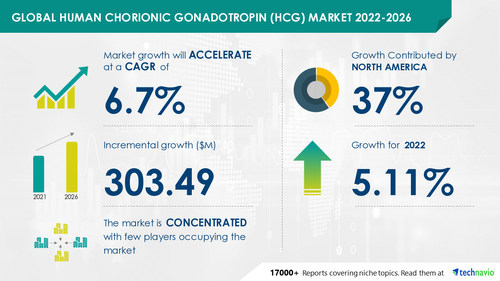
Human Chorionic Gonadotropin (HCG) Market by Technology and Geography - Forecast and Analysis 2022-2026" report has been added to Technavio's offering. The report expects the market size to grow by USD 303.49 million, accelerating at a CAGR of 6.7% during the forecast period. The report provides a detailed analysis of the factors influencing growth, vendor landscape, the latest trends, major revenue-generating segments, and regional growth opportunities. Understand the scope of the full report by
Downloading Free PDF Sample Report.
Market Dynamics:
Continue Reading
Preview
Source: PRNewswire
Technavio has announced its latest market research report titled Global Human Chorionic Gonadotropin (hCG) Market 2022-2026
The increasing infertility rate is one of the major reasons that drive the hCG market growth. According to a recent study, about 7% of married women aged 15-44 years in the US cannot get pregnant after a year of trying to conceive. Also, about 12% of women aged 15-44 years in the US have difficulty carrying a pregnancy to term, which is termed impaired fecundity. Most couples struggle with infertility and seek medical help for conception or pregnancy problems. In women, hCG improves ovulatory and final follicle maturation and offers luteal phase assistance during infertility treatment. This is expected to increase the demand for infertility treatment, which in turn, will drive the market growth during the forecast period.
Get highlights into the impact of drivers, trends, and challenges on the growth of the global roti maker market.
Download Free Sample Report
Segmentation Analysis:
Human Chorionic Gonadotropin (hCG) Market Technology Outlook (Revenue, USD Million, 2021-2026)
Natural source extraction - size and forecast 2021-2026
Recombinant technology - size and forecast 2021-2026
The market growth will be significant in the natural source extraction segment over the forecast period. The rising prevalence of hypogonadism-related illnesses in men, particularly in older adults, is a primary growth factor in the segment. The segment will also be driven by the increased accessibility of infertility treatment and services, along with increasing infertility issues.
Human Chorionic Gonadotropin (hCG) Market Geography Outlook (Revenue, USD Million, 2021-2026)
North America - size and forecast 2021-2026
Europe - size and forecast 2021-2026
Asia - size and forecast 2021-2026
Rest of World (ROW) - size and forecast 2021-2026
North America will account for 37% of the global market share over the forecast period. The increase in the incidences of infertility and the growing awareness of infertility treatments are likely to fuel the growth of the market in North America. Also, changes in reimbursement policies on infertility treatments, medical tourism, and the rising number of vendors in the region will contribute to the growth of the regional market.
Identify potential segments to invest in over the forecast period. Buy Report Now!
Start for a free trial today and gain instant access to 17,000+ market research reports.
Technavio's SUBSCRIPTION platform
Major Vendors in Human Chorionic Gonadotropin (hCG) Market:
Merck and Co. Inc.
Technavio's sample reports are free of charge and contain multiple sections of the report, such as the market size and forecast, drivers, challenges, trends, and more.
Request a free sample report
Related Reports:
The
peptide therapeutics market share is expected to increase to USD 23.36 billion from 2021 to 2026, and the market's growth momentum will accelerate at a CAGR of 12.52%. The increasing prevalence of infectious diseases is notably driving the peptide therapeutics market growth, although factors such as complexities in manufacturing, storage conditions, distribution policies, and high cost may impede market growth.
The
multiple myeloma drugs market size is expected to increase by USD 6419.94 million from 2021 to 2026, and the market's growth momentum will accelerate at a CAGR of 5.9%. The growing incidence of multiple myeloma is notably driving the multiple myeloma drugs market growth, although factors such as the growing popularity of complementary and alternative medicine may impede the market growth.
Table of contents:
1 Executive Summary
1.1 Market overview
Exhibit 01: Executive Summary – Chart on Market Overview
Exhibit 02: Executive Summary – Data Table on Market Overview
Exhibit 03: Executive Summary – Chart on Global Market Characteristics
Exhibit 04: Executive Summary – Chart on Market by Geography
Exhibit 05: Executive Summary – Chart on Market Segmentation by Technology
Exhibit 06: Executive Summary – Chart on Incremental Growth
Exhibit 07: Executive Summary – Data Table on Incremental Growth
Exhibit 08: Executive Summary – Chart on Vendor Market Positioning
2 Market Landscape
2.1 Market ecosystem
Exhibit 09: Parent market
Exhibit 10: Market Characteristics
3 Market Sizing
3.1 Market definition
Exhibit 11: Offerings of vendors included in the market definition
3.2 Market segment analysis
Exhibit 12: Market segments
3.3 Market size 2021
3.4 Market outlook: Forecast for 2021-2026
Exhibit 13: Chart on Global - Market size and forecast 2021-2026 ($ million)
Exhibit 14: Data Table on Global - Market size and forecast 2021-2026 ($ million)
Exhibit 15: Chart on Global Market: Year-over-year growth 2021-2026 (%)
Exhibit 16: Data Table on Global Market: Year-over-year growth 2021-2026 (%)
4 Five Forces Analysis
4.1 Five forces summary
Exhibit 17: Five forces analysis - Comparison between 2021 and 2026
4.2 Bargaining power of buyers
Exhibit 18: Chart on Bargaining power of buyers – Impact of key factors 2021 and 2026
4.3 Bargaining power of suppliers
Exhibit 19: Bargaining power of suppliers – Impact of key factors in 2021 and 2026
4.4 Threat of new entrants
Exhibit 20: Threat of new entrants – Impact of key factors in 2021 and 2026
4.5 Threat of substitutes
Exhibit 21: Threat of substitutes – Impact of key factors in 2021 and 2026
4.6 Threat of rivalry
Exhibit 22: Threat of rivalry – Impact of key factors in 2021 and 2026
4.7 Market condition
Exhibit 23: Chart on Market condition - Five forces 2021 and 2026
5 Market Segmentation by Technology
5.1 Market segments
Exhibit 24: Chart on Technology - Market share 2021-2026 (%)
Exhibit 25: Data Table on Technology - Market share 2021-2026 (%)
5.2 Comparison by Technology
Exhibit 26: Chart on Comparison by Technology
Exhibit 27: Data Table on Comparison by Technology
5.3 Natural source extraction - Market size and forecast 2021-2026
Exhibit 28: Chart on Natural source extraction - Market size and forecast 2021-2026 ($ million)
Exhibit 29: Data Table on Natural source extraction - Market size and forecast 2021-2026 ($ million)
Exhibit 30: Chart on Natural source extraction - Year-over-year growth 2021-2026 (%)
Exhibit 31: Data Table on Natural source extraction - Year-over-year growth 2021-2026 (%)
5.4 Recombinant technology - Market size and forecast 2021-2026
Exhibit 32: Chart on Recombinant technology - Market size and forecast 2021-2026 ($ million)
Exhibit 33: Data Table on Recombinant technology - Market size and forecast 2021-2026 ($ million)
Exhibit 34: Chart on Recombinant technology - Year-over-year growth 2021-2026 (%)
Exhibit 35: Data Table on Recombinant technology - Year-over-year growth 2021-2026 (%)
5.5 Market opportunity by Technology
Exhibit 36: Market opportunity by Technology ($ million)
6 Customer Landscape
6.1 Customer landscape overview
Exhibit 37: Analysis of price sensitivity, lifecycle, customer purchase basket, adoption rates, and purchase criteria
7 Geographic Landscape
7.1 Geographic segmentation
Exhibit 38: Chart on Market share by geography 2021-2026 (%)
Exhibit 39: Data Table on Market share by geography 2021-2026 (%)
7.2 Geographic comparison
Exhibit 40: Chart on Geographic comparison
Exhibit 41: Data Table on Geographic comparison
7.3 North America - Market size and forecast 2021-2026
Exhibit 42: Chart on North America - Market size and forecast 2021-2026 ($ million)
Exhibit 43: Data Table on North America - Market size and forecast 2021-2026 ($ million)
Exhibit 44: Chart on North America - Year-over-year growth 2021-2026 (%)
Exhibit 45: Data Table on North America - Year-over-year growth 2021-2026 (%)
7.4 Europe - Market size and forecast 2021-2026
Exhibit 46: Chart on Europe - Market size and forecast 2021-2026 ($ million)
Exhibit 47: Data Table on Europe - Market size and forecast 2021-2026 ($ million)
Exhibit 48: Chart on Europe - Year-over-year growth 2021-2026 (%)
Exhibit 49: Data Table on Europe - Year-over-year growth 2021-2026 (%)
7.5 Asia - Market size and forecast 2021-2026
Exhibit 50: Chart on Asia - Market size and forecast 2021-2026 ($ million)
Exhibit 51: Data Table on Asia - Market size and forecast 2021-2026 ($ million)
Exhibit 52: Chart on Asia - Year-over-year growth 2021-2026 (%)
Exhibit 53: Data Table on Asia - Year-over-year growth 2021-2026 (%)
7.6 Rest of World (ROW) - Market size and forecast 2021-2026
Exhibit 54: Chart on Rest of World (ROW) - Market size and forecast 2021-2026 ($ million)
Exhibit 55: Data Table on Rest of World (ROW) - Market size and forecast 2021-2026 ($ million)
Exhibit 56: Chart on Rest of World (ROW) - Year-over-year growth 2021-2026 (%)
Exhibit 57: Data Table on Rest of World (ROW) - Year-over-year growth 2021-2026 (%)
7.7 US - Market size and forecast 2021-2026
Exhibit 58: Chart on US - Market size and forecast 2021-2026 ($ million)
Exhibit 59: Data Table on US - Market size and forecast 2021-2026 ($ million)
Exhibit 60: Chart on US - Year-over-year growth 2021-2026 (%)
Exhibit 61: Data Table on US - Year-over-year growth 2021-2026 (%)
7.8 Germany - Market size and forecast 2021-2026
Exhibit 62: Chart on Germany - Market size and forecast 2021-2026 ($ million)
Exhibit 63: Data Table on Germany - Market size and forecast 2021-2026 ($ million)
Exhibit 64: Chart on Germany - Year-over-year growth 2021-2026 (%)
Exhibit 65: Data Table on Germany - Year-over-year growth 2021-2026 (%)
7.9 China - Market size and forecast 2021-2026
Exhibit 66: Chart on China - Market size and forecast 2021-2026 ($ million)
Exhibit 67: Data Table on China - Market size and forecast 2021-2026 ($ million)
Exhibit 68: Chart on China - Year-over-year growth 2021-2026 (%)
Exhibit 69: Data Table on China - Year-over-year growth 2021-2026 (%)
7.10 UK - Market size and forecast 2021-2026
Exhibit 70: Chart on UK - Market size and forecast 2021-2026 ($ million)
Exhibit 71: Data Table on UK - Market size and forecast 2021-2026 ($ million)
Exhibit 72: Chart on UK - Year-over-year growth 2021-2026 (%)
Exhibit 73: Data Table on UK - Year-over-year growth 2021-2026 (%)
7.11 Canada - Market size and forecast 2021-2026
Exhibit 74: Chart on Canada - Market size and forecast 2021-2026 ($ million)
Exhibit 75: Data Table on Canada - Market size and forecast 2021-2026 ($ million)
Exhibit 76: Chart on Canada - Year-over-year growth 2021-2026 (%)
Exhibit 77: Data Table on Canada - Year-over-year growth 2021-2026 (%)
7.12 Market opportunity by geography
Exhibit 78: Market opportunity by geography ($ million)
8 Drivers, Challenges, and Trends
8.1 Market drivers
8.2 Market challenges
8.3 Impact of drivers and challenges
Exhibit 79: Impact of drivers and challenges in 2021 and 2026
8.4 Market trends
9 Vendor Landscape
9.1 Overview
9.2 Vendor landscape
Exhibit 80: Overview on Criticality of inputs and Factors of differentiation
9.3 Landscape disruption
Exhibit 81: Overview on factors of disruption
9.4 Industry risks
Exhibit 82: Impact of key risks on business
10 Vendor Analysis
10.1 Vendors covered
Exhibit 83: Vendors covered
10.2 Market positioning of vendors
Exhibit 84: Matrix on vendor position and classification
10.3 Cigna Corp.
Exhibit 85: Cigna Corp. - Overview
Exhibit 86: Cigna Corp. - Product / Service
Exhibit 87: Cigna Corp. - Key offerings
10.4 Ferring B.V.
Exhibit 88: Ferring B.V. - Overview
Exhibit 89: Ferring B.V. - Product / Service
Exhibit 90: Ferring B.V. - Key offerings
10.5 Fresenius Kabi AG
Exhibit 91: Fresenius Kabi AG - Overview
Exhibit 92: Fresenius Kabi AG - Business segments
Exhibit 93: Fresenius Kabi AG - Key news
Exhibit 94: Fresenius Kabi AG - Key offerings
Exhibit 95: Fresenius Kabi AG - Segment focus
Exhibit 96: Intas Pharmaceuticals Ltd. - Overview
Exhibit 97: Intas Pharmaceuticals Ltd. - Product / Service
Exhibit 98: Intas Pharmaceuticals Ltd. - Key offerings
10.7 Lee BioSolutions Inc
Exhibit 99: Lee BioSolutions Inc - Overview
Exhibit 100: Lee BioSolutions Inc - Product / Service
Exhibit 101: Lee BioSolutions Inc - Key offerings
10.8 Lupin Ltd.
Exhibit 102: Lupin Ltd. - Overview
Exhibit 103: Lupin Ltd. - Product / Service
Exhibit 104: Lupin Ltd. - Key news
Exhibit 105: Lupin Ltd. - Key offerings
10.9 Merck and Co. Inc.
Exhibit 106: Merck and Co. Inc. - Overview
Exhibit 107: Merck and Co. Inc. - Business segments
Exhibit 108: Merck and Co. Inc. - Key news
Exhibit 109: Merck and Co. Inc. - Key offerings
Exhibit 110: Merck and Co. Inc. - Segment focus
10.10 Sanzyme P Ltd.
Exhibit 111: Sanzyme P Ltd. - Overview
Exhibit 112: Sanzyme P Ltd. - Product / Service
Exhibit 113: Sanzyme P Ltd. - Key offerings
Exhibit 114: Scripps Laboratories Inc. - Overview
Exhibit 115: Scripps Laboratories Inc. - Product / Service
Exhibit 116: Scripps Laboratories Inc. - Key offerings
Exhibit 117: Sun Pharmaceutical Industries Ltd. - Overview
Exhibit 118: Sun Pharmaceutical Industries Ltd. - Product / Service
Exhibit 119: Sun Pharmaceutical Industries Ltd. - Key offerings
11.1 Scope of the report
11.2 Inclusions and exclusions checklist
Exhibit 120: Inclusions checklist
Exhibit 121: Exclusions checklist
11.3 Currency conversion rates for US$
Exhibit 122: Currency conversion rates for US$
11.4 Research methodology
Exhibit 123: Research methodology
Exhibit 124: Validation techniques employed for market sizing
Exhibit 125: Information sources
11.5 List of abbreviations
Exhibit 126: List of abbreviations
About Technavio
Technavio is a leading global technology research and advisory company. Their research and analysis focus on emerging market trends and provides actionable insights to help businesses identify market opportunities and develop effective strategies to optimize their market positions.
With over 500 specialized analysts, Technavio's report library consists of more than 17,000 reports and counting, covering 800 technologies, spanning across 50 countries. Their client base consists of enterprises of all sizes, including more than 100 Fortune 500 companies. This growing client base relies on Technavio's comprehensive coverage, extensive research, and actionable market insights to identify opportunities in existing and potential markets and assess their competitive positions within changing market scenarios.
Contacts
Technavio Research
Jesse Maida
US: +1 844 364 1100
UK: +44 203 893 3200
Email:
[email protected]
Website:
www.technavio.com/
SOURCE Technavio
For more details,please visit the original website
The content of the article does not represent any opinions of Synapse and its affiliated companies. If there is any copyright infringement or error, please contact us, and we will deal with it within 24 hours.
Organizations
Indications
Targets
-Drugs
Hot reports


Get started for free today!
Accelerate Strategic R&D decision making with Synapse, PatSnap’s AI-powered Connected Innovation Intelligence Platform Built for Life Sciences Professionals.
Start your data trial now!
Synapse data is also accessible to external entities via APIs or data packages. Leverages most recent intelligence information, enabling fullest potential.