Bispecific Antibodies for Cancer Market Size to Grow by USD 396.56 million, Emerging Bispecific Antibody Generation Platforms to be Key Trend - Technavio
28 Sep 2022
CollaborateAntibody
NEW YORK, Sept. 28, 2022 /PRNewswire/ -- In the bispecific antibodies for cancer market,
emerging bispecific antibody generation platforms will be a key trend during the forecast period. For instance, Xencor is developing XmAb20717, XmAb22841, XmAb23104, XmAb24306, and XmAb14045, which are currently in the early phase of development, using the XmAb antibody engineering platform. In addition, Aptevo Therapeutics has developed APVO436 using its ADAPTIR platform for treating patients with acute myeloid leukemia. Therefore, such platforms will drive market growth during the forecast period.
Continue Reading
Preview
Source: PRNewswire
Technavio has announced its latest market research report titled Global Bispecific Antibodies for Cancer Market 2022-2026
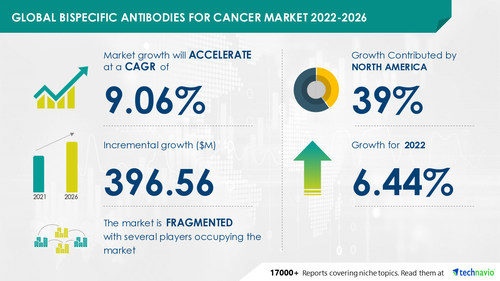
The bispecific antibodies for cancer market size is expected to grow by USD 396.56 million from 2021 to 2026. In addition, the growth momentum of the market will accelerate at a CAGR of 9.06% during the forecast period, according to Technavio.
Our comprehensive report summary includes the market size and forecast along with
research methodology. The FREE sample report is available in PDF format
Bispecific Antibodies For Cancer Market: Type Landscape
CD19 or CD3 segment will be the largest contributor to market growth during the forecast period. Bispecific antibodies have several advantages when compared to monoclonal antibodies. They can redirect specific immune cells to the site of the tumor cells to boost tumor killing. In addition, they can potentially increase the binding specificity by interacting with two different cell-surface antigens instead of one. They are also able to block two different pathways that exert unique pathogenesis simultaneously. Such advantages will drive the growth of the segment during the forecast period.
Bispecific Antibodies For Cancer Market: Geographic Landscape
Based on geography, the market has been segmented into North America, Europe, Asia, and Rest of World (ROW).
North America is expected to have significant growth during the forecast period. About 39% of the market's overall growth is expected to originate from this region. The US is the key country for the bispecific antibodies for the cancer market in North America. The growth of this region is attributed to factors such as the availability of reimbursement schemes. Moreover, this region is expected to grow at a faster rate than other regions.
Find out about the contribution of each region of the market. Buy Now to gain access to
country-specific information
Companies Covered
Eli Lilly and Co.
Merus N.V.
For learning about strategic initiatives used by vendors, as well as key news and the
latest developments, View our FREE PDF Sample Report Now
What our reports offer
Market share assessments for regional-level and country-level segments
Strategic recommendations for the new entrants
Covers market data for 2021, 2022, until 2026
Market trends (opportunities, drivers, threats, challenges, investment opportunities, and recommendations)
Strategic recommendations in key business segments as per the market approximations
Competitive landscaping highlighting the common trends
Company profiling with detailed strategies, recent developments, and financials
Supply chain trends that map the latest technological advances
Related Reports
Non-melanoma Skin Cancer Market by Type and Geography - Forecast and Analysis 2022-2026: The non-melanoma skin cancer market share is expected to increase by USD 180.97 million from 2021 to 2026.
Colorectal Cancer Therapeutics Market by Type and Geography - Forecast and Analysis 2022-2026: The colorectal cancer therapeutics market share is expected to increase by USD 2.45 bn from 2021 to 2026.
Browse Health Care Market Reports
Table of Contents
1 Executive Summary
1.1 Market overview
Exhibit 01: Executive Summary – Chart on Market Overview
Exhibit 02: Executive Summary – Data Table on Market Overview
Exhibit 03: Executive Summary – Chart on Global Market Characteristics
Exhibit 04: Executive Summary – Chart on Market by Geography
Exhibit 05: Executive Summary – Chart on Market Segmentation by Type
Exhibit 06: Executive Summary – Chart on Incremental Growth
Exhibit 07: Executive Summary – Data Table on Incremental Growth
Exhibit 08: Executive Summary – Chart on Vendor Market Positioning
2 Market Landscape
2.1 Market ecosystem
Exhibit 09: Parent market
Exhibit 10: Market Characteristics
3 Market Sizing
3.1 Market definition
Exhibit 11: Offerings of vendors included in the market definition
3.2 Market segment analysis
Exhibit 12: Market segments
3.3 Market size 2021
3.4 Market outlook: Forecast for 2021-2026
Exhibit 13: Chart on Global - Market size and forecast 2021-2026 ($ million)
Exhibit 14: Data Table on Global - Market size and forecast 2021-2026 ($ million)
Exhibit 15: Chart on Global Market: Year-over-year growth 2021-2026 (%)
Exhibit 16: Data Table on Global Market: Year-over-year growth 2021-2026 (%)
4 Five Forces Analysis
4.1 Five forces summary
Exhibit 17: Five forces analysis - Comparison between 2021 and 2026
4.2 Bargaining power of buyers
Exhibit 18: Bargaining power of buyers – Impact of key factors in 2021 and 2026
4.3 Bargaining power of suppliers
Exhibit 19: Bargaining power of suppliers – Impact of key factors in 2021 and 2026
4.4 Threat of new entrants
Exhibit 20: Threat of new entrants – Impact of key factors in 2021 and 2026
4.5 Threat of substitutes
Exhibit 21: Threat of substitutes – Impact of key factors in 2021 and 2026
4.6 Threat of rivalry
Exhibit 22: Threat of rivalry – Impact of key factors in 2021 and 2026
4.7 Market condition
Exhibit 23: Chart on Market condition - Five forces 2021 and 2026
5 Market Segmentation by Type
5.1 Market segments
Exhibit 24: Chart on Type - Market share 2021-2026 (%)
Exhibit 25: Data Table on Type - Market share 2021-2026 (%)
5.2 Comparison by Type
Exhibit 26: Chart on Comparison by Type
Exhibit 27: Data Table on Comparison by Type
5.5 Market opportunity by Type
Exhibit 36: Market opportunity by Type ($ million)
6 Customer Landscape
6.1 Customer landscape overview
Exhibit 37: Analysis of price sensitivity, lifecycle, customer purchase basket, adoption rates, and purchase criteria
7 Geographic Landscape
7.1 Geographic segmentation
Exhibit 38: Chart on Market share by geography 2021-2026 (%)
Exhibit 39: Data Table on Market share by geography 2021-2026 (%)
7.2 Geographic comparison
Exhibit 40: Chart on Geographic comparison
Exhibit 41: Data Table on Geographic comparison
7.3 North America - Market size and forecast 2021-2026
Exhibit 42: Chart on North America - Market size and forecast 2021-2026 ($ million)
Exhibit 43: Data Table on North America - Market size and forecast 2021-2026 ($ million)
Exhibit 44: Chart on North America - Year-over-year growth 2021-2026 (%)
Exhibit 45: Data Table on North America - Year-over-year growth 2021-2026 (%)
7.4 Europe - Market size and forecast 2021-2026
Exhibit 46: Chart on Europe - Market size and forecast 2021-2026 ($ million)
Exhibit 47: Data Table on Europe - Market size and forecast 2021-2026 ($ million)
Exhibit 48: Chart on Europe - Year-over-year growth 2021-2026 (%)
Exhibit 49: Data Table on Europe - Year-over-year growth 2021-2026 (%)
7.5 Asia - Market size and forecast 2021-2026
Exhibit 50: Chart on Asia - Market size and forecast 2021-2026 ($ million)
Exhibit 51: Data Table on Asia - Market size and forecast 2021-2026 ($ million)
Exhibit 52: Chart on Asia - Year-over-year growth 2021-2026 (%)
Exhibit 53: Data Table on Asia - Year-over-year growth 2021-2026 (%)
7.6 Rest of World (ROW) - Market size and forecast 2021-2026
Exhibit 54: Chart on Rest of World (ROW) - Market size and forecast 2021-2026 ($ million)
Exhibit 55: Data Table on Rest of World (ROW) - Market size and forecast 2021-2026 ($ million)
Exhibit 56: Chart on Rest of World (ROW) - Year-over-year growth 2021-2026 (%)
Exhibit 57: Data Table on Rest of World (ROW) - Year-over-year growth 2021-2026 (%)
7.7 US - Market size and forecast 2021-2026
Exhibit 58: Chart on US - Market size and forecast 2021-2026 ($ million)
Exhibit 59: Data Table on US - Market size and forecast 2021-2026 ($ million)
Exhibit 60: Chart on US - Year-over-year growth 2021-2026 (%)
Exhibit 61: Data Table on US - Year-over-year growth 2021-2026 (%)
7.8 Ireland - Market size and forecast 2021-2026
Exhibit 62: Chart on Ireland - Market size and forecast 2021-2026 ($ million)
Exhibit 63: Data Table on Ireland - Market size and forecast 2021-2026 ($ million)
Exhibit 64: Chart on Ireland - Year-over-year growth 2021-2026 (%)
Exhibit 65: Data Table on Ireland - Year-over-year growth 2021-2026 (%)
7.9 China - Market size and forecast 2021-2026
Exhibit 66: Chart on China - Market size and forecast 2021-2026 ($ million)
Exhibit 67: Data Table on China - Market size and forecast 2021-2026 ($ million)
Exhibit 68: Chart on China - Year-over-year growth 2021-2026 (%)
Exhibit 69: Data Table on China - Year-over-year growth 2021-2026 (%)
7.10 Hungary - Market size and forecast 2021-2026
Exhibit 70: Chart on Hungary - Market size and forecast 2021-2026 ($ million)
Exhibit 71: Data Table on Hungary - Market size and forecast 2021-2026 ($ million)
Exhibit 72: Chart on Hungary - Year-over-year growth 2021-2026 (%)
Exhibit 73: Data Table on Hungary - Year-over-year growth 2021-2026 (%)
7.11 India - Market size and forecast 2021-2026
Exhibit 74: Chart on India - Market size and forecast 2021-2026 ($ million)
Exhibit 75: Data Table on India - Market size and forecast 2021-2026 ($ million)
Exhibit 76: Chart on India - Year-over-year growth 2021-2026 (%)
Exhibit 77: Data Table on India - Year-over-year growth 2021-2026 (%)
7.12 Market opportunity by geography
Exhibit 78: Market opportunity by geography ($ million)
8 Drivers, Challenges, and Trends
8.1 Market drivers
8.2 Market challenges
8.3 Impact of drivers and challenges
Exhibit 79: Impact of drivers and challenges in 2021 and 2026
8.4 Market trends
9 Vendor Landscape
9.1 Overview
9.2 Vendor landscape
Exhibit 80: Overview on Criticality of inputs and Factors of differentiation
9.3 Landscape disruption
Exhibit 81: Overview on factors of disruption
9.4 Industry risks
Exhibit 82: Impact of key risks on business
10 Vendor Analysis
10.1 Vendors covered
Exhibit 83: Vendors covered
10.2 Market positioning of vendors
Exhibit 84: Matrix on vendor position and classification
10.3 ABL Bio Inc.
Exhibit 85: ABL Bio Inc. - Overview
Exhibit 86: ABL Bio Inc. - Product / Service
Exhibit 87: ABL Bio Inc. - Key offerings
10.4 Amgen Inc.
Exhibit 88: Amgen Inc. - Overview
Exhibit 89: Amgen Inc. - Product / Service
Exhibit 90: Amgen Inc. - Key offerings
10.5 Astellas Pharma Inc.
Exhibit 91: Astellas Pharma Inc. - Overview
Exhibit 92: Astellas Pharma Inc. - Product / Service
Exhibit 93: Astellas Pharma Inc. - Key news
Exhibit 94: Astellas Pharma Inc. - Key offerings
10.6 Eli Lilly and Co.
Exhibit 95: Eli Lilly and Co. - Overview
Exhibit 96: Eli Lilly and Co. - Business segments
Exhibit 97: Eli Lilly and Co. - Key offerings
Exhibit 98: Eli Lilly and Co. - Segment focus
Exhibit 99: F. Hoffmann La Roche Ltd. - Overview
Exhibit 100: F. Hoffmann La Roche Ltd. - Business segments
Exhibit 101: F. Hoffmann La Roche Ltd. - Key news
Exhibit 102: F. Hoffmann La Roche Ltd. - Key offerings
Exhibit 103: F. Hoffmann La Roche Ltd. - Segment focus
Exhibit 104: Johnson and Johnson Inc. - Overview
Exhibit 105: Johnson and Johnson Inc. - Business segments
Exhibit 106: Johnson and Johnson Inc. - Key news
Exhibit 107: Johnson and Johnson Inc. - Key offerings
Exhibit 108: Johnson and Johnson Inc. - Segment focus
10.9 Merus N.V.
Exhibit 109: Merus N.V. - Overview
Exhibit 110: Merus N.V. - Key offerings
10.10 Pfizer Inc.
Exhibit 111: Pfizer Inc. - Overview
Exhibit 112: Pfizer Inc. - Product / Service
Exhibit 113: Pfizer Inc. - Key news
Exhibit 114: Pfizer Inc. - Key offerings
Exhibit 115: Regeneron Pharmaceuticals Inc. - Overview
Exhibit 116: Regeneron Pharmaceuticals Inc. - Product / Service
Exhibit 117: Regeneron Pharmaceuticals Inc. - Key offerings
10.12 TG Therapeutics Inc.
Exhibit 118: TG Therapeutics Inc. - Overview
Exhibit 119: TG Therapeutics Inc. - Product / Service
Exhibit 120: TG Therapeutics Inc. - Key offerings
11.1 Scope of the report
11.2 Inclusions and exclusions checklist
Exhibit 121: Inclusions checklist
Exhibit 122: Exclusions checklist
11.3 Currency conversion rates for US$
Exhibit 123: Currency conversion rates for US$
11.4 Research methodology
Exhibit 124: Research methodology
Exhibit 125: Validation techniques employed for market sizing
Exhibit 126: Information sources
11.5 List of abbreviations
Exhibit 127: List of abbreviations
About Us
Technavio is a leading global technology research and advisory company. Their research and analysis focus on emerging market trends and provide actionable insights to help businesses identify market opportunities and develop effective strategies to optimize their market positions. With over 500 specialized analysts, Technavio's report library consists of more than 17,000 reports and counting, covering 800 technologies, spanning across 50 countries. Their client base consists of enterprises of all sizes, including more than 100 Fortune 500 companies. This growing client base relies on Technavio's comprehensive coverage, extensive research, and actionable market insights to identify opportunities in existing and potential markets and assess their competitive positions within changing market scenarios.
Contact
Technavio Research
Jesse Maida
US: +1 844 364 1100
UK: +44 203 893 3200
Email: [email protected]
Website: www.technavio.com/
SOURCE Technavio
For more details,please visit the original website
The content of the article does not represent any opinions of Synapse and its affiliated companies. If there is any copyright infringement or error, please contact us, and we will deal with it within 24 hours.
Organizations
Drugs
Hot reports


Get started for free today!
Accelerate Strategic R&D decision making with Synapse, PatSnap’s AI-powered Connected Innovation Intelligence Platform Built for Life Sciences Professionals.
Start your data trial now!
Synapse data is also accessible to external entities via APIs or data packages. Leverages most recent intelligence information, enabling fullest potential.