Progress on #FutureFresenius: Operating Companies showing consistent performance; Group simplification delivered
02 Aug 2023
Executive ChangeFinancial StatementAcquisition
Contact

Preview
Source: Fresenius
Dennis Hofmann
Head of Corporate Communications
T +49 (0) 6172 608-96008
dennis.hofmann@fresenius.com
Documents
Text as PDF document (PDF, 661 KB)
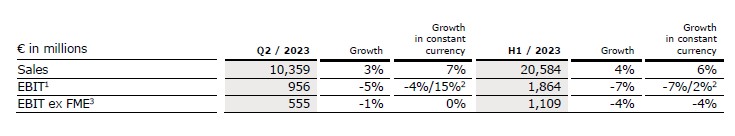
Excellent Group revenue growth of 7% in constant currency to €10.4 billion; Operating Companies with very strong 8% organic growth
Group EBIT increased 15%1 in constant currency reflecting strong performance of Operating Companies and operational turnaround at Fresenius Medical Care
Fresenius Kabi’s EBIT margin within structural band at 14.2% driven by operating leverage and well progressing cost savings
Fresenius Helios with very strong organic revenue growth of 7% driven primarily by excellent activity levels in Spain
Structural productivity savings ramping up, ~€280 million already achieved in H1/23
Deconsolidation of Fresenius Medical Care on track with overwhelmingly positive votes at Extraordinary General Meeting
Fresenius Vamed’s transformation initiated
Group revenue outlook excluding Fresenius Medical Care improved, Group EBIT outlook excluding Fresenius Medical Care confirmed
1 According to FY/23 guidance, excluding Provider Relief Fund (PRF) at Fresenius Medical Care. In 2022, Fresenius Medical Care’s EBIT was supported by €277 million (H1/22: €177 million and Q2/22: €161 million) of Provider Relief Funding from the U.S. government (at current currency). Accordingly, the 2022 basis was adjusted. There is no additional U.S. governmental support assumed for 2023.
If no timeframe is specified, information refers to Q2/2023.
Preview
Source: Fresenius
1 Before special items, Q1/22 and H1/22 restated following remeasurement Humacyte investment
2 According to FY/23 guidance, excluding Provider Relief Fund (PRF) at Fresenius Medical Care
3 Before special items
For a detailed overview of special items please see the reconciliation tables starting page 27 of the PDF.
Michael Sen, CEO of Fresenius: “We are keeping a quick and consistent pace in implementing our #FutureFresenius program. And the effects are becoming tangible. Our Operating Companies, Fresenius Helios and Fresenius Kabi, have top market positions, and are bringing innovations to patients every day. Both delivered solid second quarter results, including stronger than expected revenue growth. Both are within their respective margin bands, which we established earlier this year as part of our new financial framework. At Fresenius Medical Care, we also saw a positive business development in the second quarter. On July 14, at the Extraordinary General Meeting, shareholders overwhelmingly approved the deconsolidation of Fresenius Medical Care, paving the way for a new chapter. The challenges at our Investment Company, Vamed, are being dealt with rapidly, and we have initiated a comprehensive transformation to realign the company.”
Group simplification progresses well
The deconsolidation of Fresenius Medical Care is moving ahead as planned. At the Extraordinary General Meeting (EGM) on July 14, 2023, more than 99% of Fresenius Medical Care’s shareholders voted in favor for the conversion of Fresenius Medical Care from the legal form of a partnership limited by shares (Kommanditgesellschaft auf Aktien, KGaA) into a German stock corporation (Aktiengesellschaft, AG). In its constituting meeting following the EGM, the new Supervisory Board elected Fresenius Group CEO Michael Sen as its Chair, as well as Fresenius Group CFO Sara Hennicken as its Deputy Chair. This is a testament to Fresenius’ close relationship with Fresenius Medical Care and its continued commitment to the Company. The simplified structure will lead, among others, to a more efficient and faster decision-making as it allows for a clearer focus on the interests of the Fresenius Medical Care group and frees up management resources. Fresenius Medical Care will also have greater flexibility concerning its financial strategy. Subject to the registration with the commercial register, the conversion is expected to become effective by the end of the 2023.
Transformation Fresenius Vamed
Following the continued negative business performance, Fresenius announced as part of the presentation of the Q1/23 results, plans for an in-depth analysis of Fresenius Vamed’s business model, its governance and relevant processes. At the same time, a comprehensive and far-reaching restructuring program has been initiated with the clear goal to increase the company’s profitability. Also, a comprehensive reassessment of the company organization was initiated which led to the reorganization of the VAMED management already at the end of June. The new Fresenius Management Board member Dr. Michael Moser will be responsible for Fresenius Vamed. The control function of the VAMED Supervisory Board was strengthened through new appointments and the establishment of an Audit Committee consisting of Sara Hennicken as Chair and Dr. Michael Moser as Deputy Chair, among others.
The restructuring program aims to adjust Fresenius Vamed’s project business, especially in Germany. Moreover, the withdrawal of non-core service businesses in main markets outside Europe is intended. This includes the redimensioning of activities, and associated with this, achieving a significantly lower risk profile. In the future, Fresenius Vamed will focus on attractive businesses comprising:
Health Facility Operations (HFO) centered on inpatient and outpatient rehabilitation and nursing
High-End Services (HES) for hospitals focused on the management of medical equipment, hospital operating technology and sterile supplies
Health Tech Engineers (HTE) covering the project business for the healthcare sector
In Q2/23, negative one-time items for closing down activities resulting in write-downs and provisions of €332 million were booked which are predominantly non-cash items. For further potential asset re-valuations, charges for discontinued business activities as well as restructuring costs additional around €200 million to €250 million are anticipated as of today. Thereof, approximately €60 million to 80 million cash-effective restructuring costs are anticipated.
The operational turnaround is expected for the second half of 2023, with sequential improvement in Q3/23 and a positive EBIT in Q4/23. This recovery is mainly driven by the service business HES and the HFO business. By 2025, Fresenius Vamed is expected to reach the structural EBIT margin band of 4% to 6% set out in the #FutureFresenius Financial Framework.
Structural productivity improvements well advancing
The groupwide cost savings program is well progressing with Fresenius Medical Care and Fresenius Kabi being the largest contributors. Under the program, ~€280 million of structural cost savings at EBIT level were already achieved in H1/23, that is around 55% of the planned savings for 2023. In the same period, one-time costs of ~€110 million incurred to achieve these savings. These are treated as special items. Fresenius Medical Care realized ~€75 million of cost savings in Q2/23 and invested €25 million in the same period.
FY/23 Group guidance excluding Fresenius Medical Care
With the positive vote of Fresenius Medical Cares’ shareholders in favor of the change of legal form, the structural simplification of the Fresenius Group has passed a major milestone. In order to reflect the deconsolidation of Fresenius Medical Care already now, Fresenius will provide the Group guidance for the fiscal year 2023 from now on solely excluding Fresenius Medical Care. This is a further step towards the implementation of #FutureFresenius, where Fresenius Medical Care will no longer be part of Fresenius' fully consolidated subsidiaries.
For 2023, Fresenius expects Group organic revenue1 excluding Fresenius Medical care to grow in a mid-single-digit percentage range. Constant currency Group EBIT2 excluding Fresenius Medical Care is expected to remain broadly flat or decline up to a mid-single-digit percentage rate.
Fresenius expects the net debt/EBITDA3 ratio excluding Fresenius Medical Care to be below 4.0x by the end of 2023, therefore improving from 4.19x4 as of June 30, 2023 (December 31, 2022: 3.80x4). This assumption does not include potential divestment activities. The self-imposed target corridor for the leverage ratio remains unchanged at 3.0x to 3.5x.
1 FY/22 base: €21,532 million
2 FY/22 base: €2,187 million, before special items; FY/23: before special items
3 At LTM average exchange rates for both net debt and EBITDA; pro forma closed acquisitions/divestitures; excluding further potential acquisitions/divestitures; before special items; including lease liabilities
4 At LTM average exchange rates for both net debt and EBITDA; pro forma closed acquisitions/divestitures; before special items; including lease liabilities
For a detailed overview of special items please see the reconciliation tables starting page 27 of the PDF.
Assumptions for guidance FY/23
For 2023, Fresenius assumes no further escalations of geopolitical tensions and challenges from COVID-19, and supply chain constraints continuing to ease. Fresenius expects that the general cost inflation will have a more negative effect on its business than in 2022 due to the annualization effect of cost increases occurred in H2/2022.
Fresenius will continue to closely monitor the potential further consequences of the ongoing challenging macroeconomic environment, including balance sheet valuations.
All of these assumptions are subject to considerable uncertainty.
7% revenue increase in constant currency
Group revenue increased by 3% (7% in constant currency) to €10,359 million (Q2/22: €10,018 million). Organic growth was 6%. Acquisitions/divestitures contributed net 1% to growth. In total, currency translation had a negative effect of 4% on revenue growth. The Operating Companies increased revenue by 6% (9% in constant currency). Excluding Fresenius Medical Care, Group revenue increased by 5% (7% in constant currency) to €5,557 million (Q2/22: €5,284 million).
In H1/23, Group revenue increased by 4% (6% in constant currency) to €20,584 million (H1/22: €19,738 million). Organic growth was 5%. Acquisitions/divestitures contributed net 1% to growth. Currency translation decreased revenue growth by 2%. The Operating Companies increased revenue by 6% (7% in constant currency) in H1/23. Excluding Fresenius Medical Care, Group revenue increased by 6% (7% in constant currency) to €11,103 million (H1/22: €10,476 million).
15 %1 EBIT2 increase in constant currency
Group EBITDA before special items decreased by 2% (0% in constant currency) to €1,649 million (Q2/222: €1,682 million). Reported Group EBITDA was €1,247 million (Q2/22: €1,528 million). In H1/23, Group EBITDA before special items decreased by 3% (-3% in constant currency) to €3,234 million (H1/222: €3,344 million). Reported Group EBITDA was €2,738 million (H1/22: €3,123 million).
Group EBIT before special items and excluding Provider Relief Fund (PRF) increased by 15%1 in constant currency. The EBIT increase was driven by Fresenius Medical Care, and the Operating Companies compensating successfully inflationary headwinds. The Operating Companies showed an EBIT increase of 5% and an EBIT margin of 11.3%. Group EBIT before special items decreased by 5% (-4% in constant currency) to €956 million (Q2/222: €1,003 million) mainly driven by the negative earnings performance at Fresenius Vamed. The EBIT margin before special items was 9.2% (Q2/222: 10.0%). Reported Group EBIT was €543 million (Q2/22: €845 million). Excluding Fresenius Medical Care, Group EBIT before special items decreased by 1% (0% in constant currency) to €555 million (Q2/222: €558 million). The EBIT margin excluding Fresenius Medical Care before special items was 10.0% (Q2/222: 10.6%).
In H1/23, Group EBIT before special items excluding Provider Relief Fund (PRF) increased by 2%1 in constant currency. The Operating Companies increased EBIT by 2% with a margin of 11.4%. Group EBIT before special items decreased by 7% (-7% in constant currency) to €1,864 million (H1/222: €2,003 million). The EBIT margin before special items was 9.1% (H1/222: 10.1%). Reported Group EBIT was €1,330 million (H1/22: €1,747 million). Excluding Fresenius Medical Care, Group EBIT before special items decreased by 4% (-4% in constant currency) to €1,109 million (H1/222: €1,151 million). The EBIT margin excluding Fresenius Medical Care before special items was 10.0% (H1/222: 11.0%).
Group net interest before special items increased to -€184 million (Q2/222: -€116 million) mainly due to financing activities in a higher interest rate environment. Reported Group net interest was -€184 million (Q2/22: -€116 million). In H1/23, Group net interest before special items increased to -€354 million (H1/222: -€235 million). Reported Group net interest was -€354 million (H1/22: -€234 million).
Group tax rate before special items increased to 27.3% (Q2/222: 23.0%) mainly due to the increase in the proportionate share of non-tax-deductible expenses compared to taxable income at Fresenius Medical Care as well as to the non-recognition of increased tax loss carry forwards at Fresenius Vamed. Reported Group tax rate was 53.8% (Q2/22: 22.6%). In H1/23, Group tax rate before special items was 26.2% (H1/222: 22.9%) while the reported Group tax rate was 35.6% (H1/22: 23.1%).
1 According to FY/23 guidance, excluding Provider Relief Fund (PRF) at Fresenius Medical Care
2 Before special items
For a detailed overview of special items please see the reconciliation tables starting page 27 of the PDF.
Noncontrolling interests before special items were -€186 million (Q2/222: -€233 million) of which 93% were attributable to the noncontrolling interests in Fresenius Medical Care. Reported noncontrolling interests were -€86 million (Q2/22: -€181 million). In H1/23, Noncontrolling interests before special items were -€351 million (H1/222: -€451 million) of which 93% were attributable to the noncontrolling interests in Fresenius Medical Care. Reported noncontrolling interests were -€203 million (H1/22: -€367 million).
Group net income1 before special items decreased by 17% (-17% in constant currency) to €375 million (Q2/222: €450 million). The decrease was driven by cost inflation and the negative earnings development at Fresenius Vamed. Moreover, rising interest costs and a higher tax rate weighed on the net income development. Reported Group net income1 decreased to €80 million (Q2/22: €383 million). Excluding Fresenius Medical Care, Group net income1 before special items decreased by 17% (-17% in constant currency) to €375 million (Q2/222: €450 million).
In H1/23, Group net income1 before special items decreased by 16% (-17% in constant currency) to €764 million (H1/222: €913 million). Reported Group net income1 decreased to €426 million (H1/22: €796 million). Excluding Fresenius Medical Care, Group net income1 before special items decreased by 16% (-17% in constant currency) to €764 million (H1/222: €913 million).
Earnings per share1 before special items decreased by 17% (-17% in constant currency) to €0.67 (Q2/222: €0.80). Reported earnings per share1 were €0.15 (Q2/22: €0.68).
In H1/23, earnings per share1 before special items decreased by 17% (-17% in constant currency) to €1.36 (H1/222: €1.63). Reported earnings per share1 were €0.76 (H1/22: €1.42).
1 Net income attributable to shareholders of Fresenius SE & Co. KGaA
2 Before special items
For a detailed overview of special items please see the reconciliation tables starting page 27 of the PDF.
Investments
Spending on property, plant and equipment was €396 million corresponding to 4% of revenue (Q2/22: €419 million; 4% of revenue). These investments served primarily for the modernization and expansion of dialysis clinics, production facilities as well as hospitals and day clinics. Excluding Fresenius Medical Care, spending on property, plant and equipment was €240 million corresponding to 4% of revenue (Q2/22: €247 million; 5% of revenue).
In H1/23, spending on property, plant and equipment was €749 million corresponding to 4% of revenue (H1/22: €757 million; 4% of revenue). Excluding Fresenius Medical Care, spending on property, plant and equipment was €451 million corresponding to 4% of revenue (H1/22: €423 million; 4% of revenue).
Total acquisition spending was €27 million (Q2/22: €291 million) mainly for investments in debt instruments at Fresenius Medical Care. Excluding Fresenius Medical Care, total acquisition spending was €0 million (Q2/22: €224 million).
In H1/23, total acquisition spending was €95 million (H1/22: €453 million). Excluding Fresenius Medical Care, total acquisition spending was €18 million (H1/22: €303 million).
Cash flow development
Group operating cash flow increased to €1,186 million (Q2/22: €1,017 million) driven by the good cash flow development at Fresenius Medical Care and Fresenius Kabi. This was partly offset by the negative earnings development at Fresenius Vamed. Group operating cash flow margin was 11.4% (Q2/22: 10.2%). Free cash flow before acquisitions and dividends increased to €791 million (Q2/22: €581 million). Free cash flow after acquisitions and dividends increased to -€30 million (Q2/22: -€391 million). Excluding Fresenius Medical Care, Group operating cash flow decreased to €285 million (Q2/22: €393 million).
In H1/23, Group operating cash flow increased to €1,361 million (H1/22: €1,118 million) with a margin of 6.6% (H1/22: 5.7%). Free cash flow before acquisitions and dividends increased €614 million (H1/22: €326 million). Free cash flow after acquisitions and dividends increased to -€311 million (H1/22: -€794 million).
Excluding Fresenius Medical Care, Group operating cash flow decreased to €317 million (H1/22: €335 million).
The cash conversion rate (CCR), which is defined as the ratio of adjusted free cash flow1 to EBIT before special items, was 0.8 (LTM: 1.2) in H1/23. Excluding Fresenius Medical Care, the cash conversion rate in H1/23 was 0.3 (LTM: 1.0).
1 Cash flow before acquisitions and dividends; before interest, tax, and special items
Solid balance sheet structure
Group total assets remained nearly unchanged compared to FY/22 (1% in constant currency) at €76,413 million (Dec. 31, 2022: €76,415 million). Current assets increased by 6% (7% in constant currency) to €19,305 million (Dec. 31, 2022: €18,279 million), mainly driven by the business expansion related increase of trade account receivables and inventories. Non-current assets decreased by 2% (0% in constant currency) to €57,108 million (Dec. 31, 2022: €58,136 million).
Total shareholders’ equity decreased by 2% (0% in constant currency) to €31,430 million (Dec. 31, 2022: €32,218 million). The equity ratio was 41.1% (Dec. 31, 2022: 42.2%).
Group debt increased by 2% (2% in constant currency) to €28,183 million (Dec. 31, 2022: € 27,763 million). Group net debt increased by 3% (3% in constant currency) to € 25,712 million (Dec. 31, 2022: € 25,014 million).
Group debt excluding Fresenius Medical Care increased by 4% (4% in constant currency) to €15,271 million (Dec. 31, 2022: € 14,708 million). Group net debt excluding Fresenius Medical Care increased by 6% (6% in constant currency) to € 14,162 million (Dec. 31, 2022: €13.307 million).
As of June 30, 2023, the net debt/EBITDA ratio was 3.88x1,2,3 (Dec. 31, 2022: 3.65x1,2) mainly driven by lower EBITDA contribution at Fresenius Medical Care and Fresenius Vamed, and higher net debt. Excluding Fresenius Medical Care, the net debt/EBITDA ratio was 4.19x1,2 (Dec. 31, 2022: 3.80x1,2).
In Q2/23, ROIC was 4.6% due to the lower EBIT (Q4/22: 5.1%). Excluding Fresenius Medical Care, the ROIC was 5.0% (Q4/22: 5.6%).
1 At LTM average exchange rates for both net debt and EBITDA; pro forma closed acquisitions/divestitures
2 Before special items
3 Fresenius Medical Care: Includes debt & lease liabilities included within the balance sheet line item “Liabilities directly associated with assets held for sale” as well as cash & cash equivalents included within “Assets held for sale”.
For a detailed overview of special items please see the reconciliation tables starting page 27 of the PDF.
Business Segments – Operating Companies
Fresenius Kabi
Fresenius Kabi specializes in products for the therapy and care of critically and chronically ill patients. The portfolio includes biopharmaceuticals, clinical nutrition, MedTech products, intravenously administered generic drugs (generic IV drugs), and IV fluids. ,
Preview
Source: Fresenius
Growth vectors with very strong double-digit organic revenue growth
Pharma showing accelerated sequential growth
EBIT margin1 in structural margin band
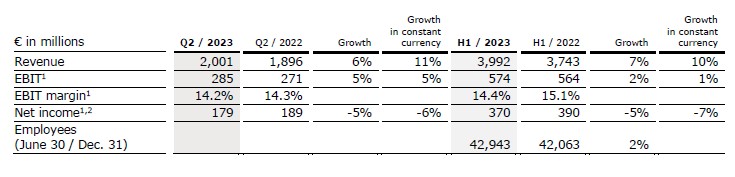
Revenue increased by 6% (11% in constant currency) to €2,001 million (Q2/22: €1,896 million) mainly driven by the strong business development of all growth vectors. Organic growth was 8%.
In H1/23, revenue increased by 7% (10% in constant currency) to €3,992 million (H1/22: €3,743 million). Organic growth was 8%.
Revenue of the Growth Vectors (MedTech, Nutrition and Biopharma) increased by 10% (organic growth: 12%) to €1,062 million (Q2/22: €961 million).
In H1/23, revenue of the Growth Vectors increased by 11% (organic growth: 11%) to €2,113 million (H1/22: €1,903 million).
Revenue in MedTech increased by 6% (organic growth: 9%) to €365million (Q2/22: €345 million) driven by, amongst others, the good business development in Transfusion Medicine and Cell Therapies (TCT) as well as by successful product rollouts. In H1/23, revenue in MedTech increased by 8% (organic growth: 9%) to €744 million (H1/22: €687 million).
1 Before special items
2 Net income attributable to shareholders of Fresenius SE & Co. KGaA
For a detailed overview of special items please see the reconciliation tables starting page 27 of the PDF.
Revenue in Nutrition increased by 5% (organic growth: 13%) to €614 million (Q2/22: €587 million) mainly driven by the good business development in Latin America and the further improving situation in China.
In H1/23, revenue in Nutrition increased by 4% (organic growth: 11%) to €1,216 million (H1/22: €1,164 million).
Revenue in Biopharma increased by 188% (organic growth: 34%) to €83 million (Q2/22: €29 million) mainly driven by successful product launches in Europe, the U.S., and Latin America.
In H1/23, revenue in Biopharma increased by 196% (organic growth: 44%) to €153 million (H1/22: €52 million).
Revenue in the Pharma (IV Drugs & Fluids) business increased by 2% (organic growth: 6%) to €952 million (Q2/22: €935 million). The revenue increase is driven by the positive business development in both product segments.
In H1/23, revenue in the Pharma business increased by 3% (organic growth: 5%) to €1,892 million (H1/22: €1,840 million).
EBIT1 of Fresenius Kabi increased by 5% (5% in constant currency) to €285 million (Q2/22: €271 million) due to the good operating performance and the well-progressing cost saving initiatives. EBIT margin1 was 14.2% (Q2/22: 14.3%) and thus within the structural EBIT margin band.
In H1/23, EBIT1 increased by 2% (1% in constant currency) to €574 million (H1/22: €564 million) EBIT margin1 was 14.4% (H1/22: 15.1%).
EBIT1 of the Growth Vectors increased by 9% (12% in constant currency) to €88 million (Q2/22: €81 million) due to the excellent revenue development and the well-progressing cost saving initiatives. EBIT1 margin was 8.3% (Q2/22: 8.4%).
In H1/23, EBIT1 of the Growth Vectors decreased by 5% (-5% in constant currency) to €184 million (H1/22: €193 million) with a margin1 of 8.7% (H1/22: 10.1%).
1 Before special items
For a detailed overview of special items please see the reconciliation tables starting page 27 of the PDF.
EBIT1 in the Pharma business increased by 4% (7% in constant currency) to €206 million (Q2/22: €198 million) due to the solid revenue development and the well-progressing cost saving initiatives. EBIT1 margin was 21.6% (Q2/22: 21.1%).
In H1/23, EBIT1 in the Pharma business increased by 5% (5% in constant currency) to €403 million (H1/22: €383 million) with a margin1 of 21.3% (H1/22: 20.8%).
Net income1,2 decreased by 5% (-6% in constant currency) to €179 million (Q2/22: €189 million).
In H1/23, net income1,2 decreased by 5% (-7% in constant currency) to €370 million (H1/22: €390 million).
Operating cash flow increased to €180 million (Q2/22: €109 million) with a margin of 9.0% (Q2/22: 5.7%) mainly driven by an improved working capital management.
In H1/23, operating cash flow decreased to €201 million (H1/22: €242 million) with a margin of 5.0% (H1/22: 6.5%).
For FY/23, Fresenius Kabi expects organic revenue3 growth in a mid-single-digit percentage range. The EBIT margin4 is expected to be around 14% (structural margin band: 14% to 17%).
1 Before special items
2 Net income attributable to shareholders of Fresenius SE & Co. KGaA.
3 FY/22 base: €7,850 million
4 FY/22 base: EBIT margin: 13.8%, before special items; FY/23 before special items
For a detailed overview of special items please see the reconciliation tables starting page 27 of the PDF.
Fresenius Helios
Fresenius Helios is Europe's leading private health care provider. The company comprises Helios Germany, Helios Spain and Helios Fertility. Helios Germany operates 87 hospitals, around 240 outpatient centers, 27 occupational health centers and 6 prevention centers. Helios Spain operates 50 hospitals, around 100 outpatient centers and around 300 occupational risk prevention centers. In addition, the company is active in Latin America with 8 hospitals and as a provider of medical diagnostics. Helios Fertility offers a wide spectrum of state-of-the-art services in the field of fertility treatments.
Preview
Source: Fresenius
Fresenius Helios with excellent organic revenue growth driven by high activity levels at Helios Spain including Latin America
Helios Germany with solid top-line development supported by more complex treatments
EBIT margin1 well in structural margin band due to ongoing successful measures to counter inflationary headwinds
Helios Fertility with solid operating performance
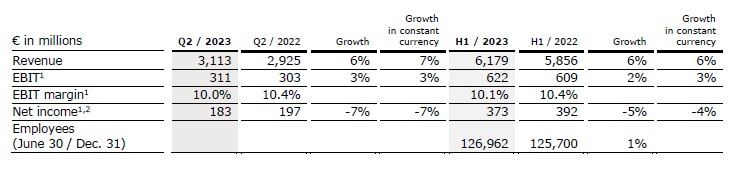
Revenue increased by 6% (7% in constant currency) to €3,113 million (Q2/22: €2,925 million). Organic growth was 7%. Acquisitions contributed 0% to revenue growth.
In H1/23, revenue increased by 6% (6% in constant currency) to €6,179 million (H1/22: €5,856 million). Organic growth was 6%. Acquisitions contributed 0% to revenue growth.
Revenue of Helios Germany increased by 4% (organic growth: 4%) to €1,823 million (Q2/22: €1,758 million), mainly driven by increasing admissions and positive mix effects supported by an increase of complex treatments.
In H1/23, revenue of Helios Germany increased by 3% (organic growth: 3%) to €3,651 million (H1/22: €3,541 million).
1 Before special items
2 Net income attributable to shareholders of Fresenius SE & Co. KGaA
For a detailed overview of special items please see the reconciliation tables starting page 27 of the PDF.
Revenue of Helios Spain increased by 11% (12% in constant currency) to €1,223 million (Q2/22: €1,101 million). Organic growth of 12% was driven by ongoing high activity levels. The clinics in Latin America also showed a good performance.
In H1/23, revenue of Helios Spain increased by 9% (11% in constant currency) to €2,393 million (H1/21: €2,190 million).
Revenue of Helios Fertility increased by 5% (11% in constant currency) to €68 million (Q2/22: €65 million) driven by mix effects.
In H1/23, revenue of the Helios Fertility were €134 million (H1/22: €122 million).
EBIT1 of Fresenius Helios increased by 3% (3% in constant currency) to €311 million (Q2/22: €303 million) with an EBIT margin1 of 10.0% (Q2/22: 10.4%).
In H1/23, EBIT1 increased by 2% (3% in constant currency) to €622 million (H1/22: €609 million) with an EBIT margin1 of 10.1% (H1/22: 10.4%).
EBIT1 of Helios Germany remained stable at €154 million (Q2/22: €154 million) with an EBIT margin1 of 8.4% (Q2/22: 8.8%).
In H1/23, EBIT1 of Helios Germany increased to €309 million (H1/22: €308 million) with an EBIT margin1 of 8.5% (H1/22: 8.7%).
EBIT1 of Helios Spain increased due to the strong revenue growth and despite cost inflation by 4% (5% in constant currency) to €154 million (Q2/22: €148 million). The EBIT margin1 was 12.6% (Q2/22: 13.4%).
In H1/23, EBIT1 of Helios Spain increased by 3% (5% in constant currency) to €311 million (H1/22: €301 million). The EBIT margin1 was 13.0% (H1/22: 13.7%).
EBIT1 of Helios Fertility was €7 million (Q2/22: €7 million) with an EBIT margin1 of 10.3% (Q2/22: 10.8%).
In H1/23, EBIT1 of Helios Fertility was €11 million (H1/22: €11 million) with an EBIT margin1 of 8.2% (H1/22: 9.0%).
Net income1,2 decreased by 7% (-7% in constant currency) to €183 million (Q2/22: €197 million).
In H1/23, net income1,2 decreased by 5% (-4% in constant currency) to €373 million (H1/22: €392 million).
Operating cash flow decreased to €61 million (Q2/22: €194 million) mainly due to delays in the budget negotiations in Germany leading to higher receivables at Helios Germany. The operating cash flow margin was 2.0% (Q2/22: 6.6%).
In H1/23, operating cash flow increased to €169 million (H1/22: €58 million) with a margin of 2.7% (H1/22: 1.0%).
For FY/23, Fresenius Helios expects organic revenue3 growth in a mid-single-digit percentage range. The EBIT margin4 is expected to be within the structural margin band of 9% to 11%.
1 Before special items
2 Net income attributable to shareholders of Fresenius SE & Co. KGaA
3 FY/22 base: €11,716 million
4 FY/22 base: EBIT margin: 10.1%, before special items, FY/23 before special items
For a detailed overview of special items please see the reconciliation tables starting page 27 of the PDF.
Business Segments – Investment Companies
(Financial data according to Fresenius Medical Care press release)
Fresenius Medical Care is the world's largest provider of products and services for individuals with renal diseases. As of June 30, 2023, Fresenius Medical Care was treating approximately 344,000 patients in 4,050 dialysis clinics. Dialyzers and dialysis machines are among the most important product lines. In addition, Fresenius Medical Care offers dialysis-related services.
Preview
Source: Fresenius
Fresenius Medical Care successfully executes strategic plan
Organic growth accelerated in the second quarter in Care Enablement and Care Delivery
Savings resulting from FME25 transformation program fully on track
Legal form conversion to a German Stock Corporation approved by shareholders
FY 2023 operating income guidance range narrowed
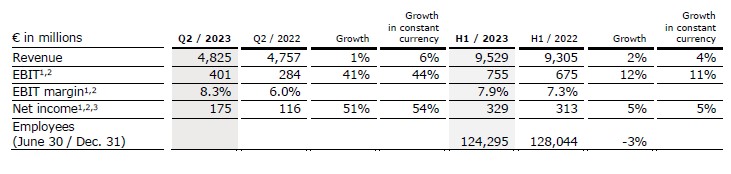
Revenue increased by 1% to €4,825 million (+6% in constant currency, organic: +6%). In H1/23, revenue increased by 2% (4% in constant currency) to €9,529 million (H1/22: €9,305 million).
EBIT increased by 5% (5% in constant currency) to €357 million (Q2/22: €341 million), resulting in a margin of 7.4% (Q2/22: 7.2%). EBIT excluding special items and U.S. Provider Relief Funding (PRF) increased by 41% to €401 million (44% in constant currency), resulting in a margin of 8.3% (Q2/22: 6.0%).
1 Before special items
2 According to FY/23 guidance, excluding Provider Relief Fund (PRF) at Fresenius Medical Care
3 Net income attributable to shareholders of Fresenius Medical Care AG & Co. KGaA
For a detailed overview of special items please see the reconciliation tables starting page 27 of the PDF.
In H1/23, EBIT decreased by 10% (-11% in constant currency) to €618 million (H1/22: €688 million) resulting in a margin of 6.5% (H1/22: 7.4%). EBIT excluding special items and PRF increased by 12% (11% in constant currency) to €755 million (H1/22: €675 million), resulting in a margin of 7.9% (H1/22: 7.3%).
Net income1 decreased by 5% to €140 million (-4% in constant currency). Excluding special items and PRF, net income1 increased by 51% to €175 million (54% in constant currency).
In H1/23, net income1 decreased by 26% (-26% in constant currency) to €227 million (H1/22: €305 million). Net income1 before special items and PRF increased by 5% (5% in constant currency) to €329 million (H1/22: €313 million).
In the second quarter, Fresenius Medical Care generated €1,007 million of operating cash flow (Q2/22: €751 million), resulting in a margin of 20.9% (Q2/22: 15.8%). The increase was mainly driven by the recoupment of advanced payments during 2022, which had been received in the U.S. under the Medicare Accelerated and Advance Payment Program in 2020, as well as by seasonality of invoicing. In H1/23, operating cash flow was €1,150 million (H1/22: €910 million) with a margin of 12.1% (H1/22: 9.8%).
1 Net income attributable to shareholders of Fresenius Medical Care AG & Co. KGaA
For a detailed overview of special items please see the reconciliation tables starting page 27 of the PDF.
The Company continues to expect for 2023 revenue1 to grow at a low to mid-single digit percentage rate. Based on the earnings development for the first half of the year, Fresenius Medical Care narrows its EBIT target range for 2023. The Company now expects EBIT2 to remain flat or decline by up to a low-single digit percentage rate3 (previous target: remain flat or decline by up to a high-single digit percentage rate3). The Company’s target to achieve an operating income margin of 10 to 14% by 2025 remains unchanged.
For further information, please see Fresenius Medical Care’s press release at www.freseniusmedicalcare.com.
1 FY/22 base: €19,398 million
2 FY/22 base: €1,540 million
3 Revenue and EBIT, as referred to in the outlook, are both on a constant currency basis and excluding special items. Special items will be provided as separate KPI (“Revenue excluding special items”, “EBIT excluding special items”) to capture effects that are unusual in nature and have not been foreseeable or not foreseeable in size or impact at the time of giving guidance. These items are excluded to ensure comparability of the figures presented with the Company’s financial targets which have been defined excluding special items.
For FY 2022, special items included costs related to the FME25 program, the impact of the war in Ukraine, the impact of hyperinflation in Turkiye, the Humacyte investment remeasurement, and the net gain related to InterWell Health. Additionally, FY 2022 basis for Outlook 2023 and 2025 was adjusted for Provider Relief Funding.
For FY 2023, special items include costs related to the FME25 program, the Humacyte investment remeasurement, the costs associated with the legal form conversion and effects from legacy portfolio optimization.
Fresenius Vamed
Fresenius Vamed manages projects and provides services for hospitals and other health care facilities worldwide and is a leading post-acute care provider in Central Europe. The portfolio ranges along the entire value chain: from project development, planning, and turnkey construction, via maintenance and technical management to total operational management.
Preview
Source: Fresenius
Negative revenue growth driven by project delays and portfolio adjustments due to transformation measures
EBIT1 negatively impacted by lower top-line and nonrecurring items
Transformation program initiated
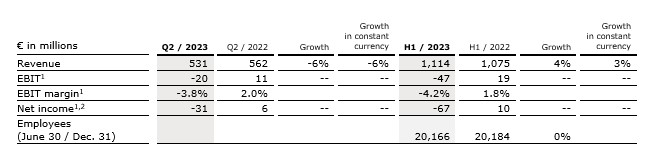
Revenue decreased by 6% (-6% in constant currency) to €531 million (Q2/22: €562 million). Organic growth was -7%.
In H1/23, revenue increased by 4% (3% in constant currency) to €1,114 million (H1/22: €1,075 million). Organic growth was 3%.
Revenue in the service business increased by 6% (5% in constant currency) to €443 million (Q2/22: €417 million) due to positive development of High-End Services (HES).
In H1/23, revenue in the service business increased by 7% (6% in constant currency) to €879 million (H1/22: €822 million).
Revenue in the project business decreased by 39% (-39% in constant currency) to €88 million (Q2/22: €145 million). In H1/23, revenue in the project business decreased by 7% (-7% in constant currency) to €235 million (H1/22: €253 million).
EBIT1 decreased to -€20 million (Q2/22: €11 million) with an EBIT margin1 of
-3.8% (Q2/22: 2.0%). The weak development was related to lower revenues and negative nonrecurring items. To counteract the negative EBIT development, a major transformation program was initiated.
In H1/23, EBIT1 decreased to -€47 million (H1/22: €19 million) with an EBIT margin1 of -4.2% (H1/22: 1.8%).
Net income1,2 decreased to -€31 million (Q2/22: €6 million).
In H1/23, net income1,2 decreased to -€67 million (H1/22: €10 million).
Order intake was €179 million (Q2/22: €253 million). As of June 30, 2023, order backlog was at €3,280 million3 (December 31, 2022: €3,689 million).
Operating cash flow decreased to €2 million (Q2/22: €7 million) with a margin of 0.4% (Q2/22: 1.2%) due to the negative earnings development. In H1/23, operating cash flow decreased to -€66 million (H1/22: -€38 million) with a margin of -5.9% (H1/22: -3.5%).
For FY/2023, Fresenius Vamed confirms the outlook and expects organic revenue4 to grow in a low-to mid-single digit percentage range. The EBIT margin5 is expected to be clearly below the structural margin band of 4% to 6%.
1 Before special items
2 Net income attributable to shareholders of VAMED AG
3 Thereof conditionally agreed order backlog of €1,017 million
4 FY/22 base: €2,359 million
5 FY/22 base: EBIT margin: 0.8%, before special items; FY/23 before special items
For a detailed overview of special items please see the reconciliation tables starting page 27 of the PDF.
Conference Call and Webcast
As part of the publication of the results for Q2/23, a conference call will be held on August 2, 2023 at 1:30 p.m. CEDT (7:30 a.m. EDT). All investors are cordially invited to follow the conference call in a live broadcast over the Internet at www.fresenius.com/investors. Following the call, a replay will be available on our website.
For more details,please visit the original website
The content of the article does not represent any opinions of Synapse and its affiliated companies. If there is any copyright infringement or error, please contact us, and we will deal with it within 24 hours.
Indications
Targets
-Drugs
-Hot reports


Get started for free today!
Accelerate Strategic R&D decision making with Synapse, PatSnap’s AI-powered Connected Innovation Intelligence Platform Built for Life Sciences Professionals.
Start your data trial now!
Synapse data is also accessible to external entities via APIs or data packages. Leverages most recent intelligence information, enabling fullest potential.