Request Demo
Last update 01 Apr 2025
Restoration Robotics, Inc.
Public Company | Subsidiary Company|
2002|
California, United States
| 100-250
| NASDAQ: HAIR| Public Company | Subsidiary Company|
2002|
California, United States
| 100-250
| NASDAQ: HAIR| Last update 01 Apr 2025
Overview
Related
2
Clinical Trials associated with Restoration Robotics, Inc.NCT02914587
Computer-Assisted Hair Implantation Using ARTAS System VS Manual Implantation Technique Hair Restoration Study
To investigate and compare the safety and effectiveness of the ARTAS™ System to manual hair follicle implantation method following a nine month period of post-procedure evaluation.
Start Date01 Aug 2016 |
Sponsor / Collaborator |
NCT00926211
Safety and Efficacy of Computer-Assisted vs. Manual Hair Follicle Harvest: A Comparative Hair Count Study
The objective of this clinical study is to investigate and compare the safety and efficacy of the Restoration Robotics Computer-Assisted Harvesting System to the manual hair follicle harvesting method following a nine-month period of post-procedural evaluation.
Start Date01 Jun 2009 |
Sponsor / Collaborator |
100 Clinical Results associated with Restoration Robotics, Inc.
Login to view more data
0 Patents (Medical) associated with Restoration Robotics, Inc.
Login to view more data
1
Literatures (Medical) associated with Restoration Robotics, Inc.01 Jan 2013·Acta neurochirurgica. Supplement
The Birth of Human Stereotactic Surgery
Article
Author: Gildenberg, Philip L
Stereotactic surgery began with the Horsley-Clarke apparatus which has been used in animal research since 1908. In 1947, Spiegel and Wycis introduced stereotactic surgery in human patients. Their initial choice of target involved the extrapyramidal system, which Russell Meyers had recently performed with craniotomy and manual lesions that might alleviate symptoms of movement disorders, albeit with significant morbidity and mortality, a problem not seen with stereotactic surgery.
2
News (Medical) associated with Restoration Robotics, Inc.19 Jan 2024
TORONTO, Jan. 19, 2024 (GLOBE NEWSWIRE) -- Venus Concept, Inc. (“Venus Concept” or the “Company”) (NASDAQ: VERO), a global medical aesthetic technology leader, announced today that it has issued new secured convertible notes to EW Healthcare Partners, L.P. and one of its affiliates (“EW Healthcare”) in an aggregate principal amount of $2.0 million. The convertible notes have a maturity date of December 9, 2025 and an annual interest rate of 90-day Adjusted SOFR + 8.5% that is payable in kind on a quarterly basis. The notes are convertible at any time into shares of common stock of the Company (“Common Stock”) at an initial conversion price of $1.251 per share, subject to adjustment. The convertible notes include a mandatory redemption provision for part or all of the notes upon the Company or Venus Concept USA Inc. receiving payments in connection with employee retention credits, and the occurrence of certain specified events.
“I want to thank EW Healthcare for their valuable partnership and support of the Company over many years,” said Rajiv De Silva, Chief Executive Officer of Venus Concept. “While our fourth quarter 2023 revenue results were softer-than-expected due to the impact of restructuring activities related to improving profitability in our international markets and the difficult financing environment for customers in all markets including the US, we are pleased to deliver on our primary objective for 2023 - to reduce our cash used in operations by approximately 50% year-over-year. This new debt financing provides Venus Concept with additional liquidity to support ongoing operations and execution of our near-to-intermediate term strategic turnaround objectives.”
Additional information regarding the convertible notes will be set forth in a Current Report on Form 8-K, which the Company expects to the Securities and Exchange Commission (“SEC”) today.
The offer and sale of the foregoing securities are being made in a transaction not involving a public offering and have not been registered under the Securities Act of 1933, as amended (the “1933 Act”), or applicable state securities laws. The securities may not be offered or sold in the United States absent registration or pursuant to an exemption from the registration requirements of the Securities Act and applicable state securities laws. The Company has agreed to registration statement covering the resale of the Common Stock issuable upon conversion of the notes.
This press release does not constitute an offer to sell or the solicitation of an offer to buy the securities in the described offering, nor shall there be any offer, solicitation or sale of the securities in any jurisdiction in which such offer, solicitation or sale would be unlawful prior to registration or qualification under the securities laws of any such jurisdiction.
Cautionary Statement Regarding Forward-Looking Statements
This communication contains “forward-looking” statements within the meaning of Section 27A of the 1933 Act and Section 21E of the Securities Exchange Act of 1934, as amended, including, without limitation, statements about the Company’s financial condition, and other statements containing the words “expect,” “intend,” “may,” “will,” and similar expressions, constitute forward-looking statements within the meaning of The Private Securities Litigation Reform Act of 1995. These forward-looking statements are based on current expectations, estimates, forecasts, and projections about the Company’s business and the industry in which it operates and management’s beliefs and assumptions and are not guarantees of future performance or developments and involve known and unknown risks, uncertainties, and other factors that are in some cases beyond the Company’s control. Factors that could materially affect the Company’s business operations and financial performance and condition include, but are not limited to, those risks and uncertainties described under Part I Item 1A—“Risk Factors” in the Company’s most recent Annual Report on Form 10-K, Part II Item 1A—“Risk Factors” in the Company’s most recent Form 10-Q and in other documents the Company may the SEC. You are urged to consider these factors carefully in evaluating the forward-looking statements and are cautioned not to place undue reliance on the forward-looking statements. The forward-looking statements are based on information available to the Company as of the date hereof. Unless required by law, the Company does not intend to publicly update or revise any forward-looking statements to reflect new information or future events or otherwise.
About Venus Concept
Venus Concept is an innovative global medical aesthetic technology leader with a broad product portfolio of minimally invasive and non-invasive medical aesthetic and hair restoration technologies and reach in over 60 countries and 14 direct markets. Venus Concept’s product portfolio consists of aesthetic device platforms, including Venus Versa, Venus Legacy, Venus Velocity, Venus Fiore, Venus Viva, Venus Glow, Venus Bliss, Venus BlissMAX, Venus Epileve, Venus Viva MD and AI.ME. Venus Concept’s hair restoration systems include NeoGraft® and the ARTAS iX® Robotic Hair Restoration system. Venus Concept has been backed by leading healthcare industry growth equity investors including EW Healthcare Partners (formerly Essex Woodlands), HealthQuest Capital, Longitude Capital Management, Aperture Venture Partners, and Masters Special Situations.
Investor Relations Contact:
ICR Westwicke on behalf of Venus Concept:
Mike Piccinino, CFA
VenusConceptIR@westwicke.com
30 Mar 2023
Record full-year 2022 total revenue of EUR 55.1 million ($58.0 million) increased 25.1% over full-year 2021
Full-year HIFU revenue was EUR 15.6 million (USD 16.4 million), an increase of 57.7% as compared to EUR 9.9 million (USD 11.7 million) for the full-year 2021
Record Q4 2022 total revenue of EUR 15.7 million ($16.2 million) versus EUR 14.0 million ($15.9 million) for Q4 2021
Ended the year with a strong cash position of EUR 63.1 million ($67.5 million) as of December 31, 2022
Ryan Rhodes to succeed Marc Oczachowski as Chief Executive Officer of the Company, effective May 1, 2023
Company to host conference call and webcast today, March 30th, at 8:30 a.m. ET
LYON, France, March 30, 2023 -- EDAP TMS SA (Nasdaq: EDAP) (the “Company”), a global leader in robotic energy-based therapies, announced today unaudited financial results for the fourth quarter and full-year 2022 and announced a change in its leadership, effective May 1, 2023.
In line with EDAP’s Global Group Strategy, and its focus on expansion in the United States and rest of world markets, the Board of Directors has decided to embark on a new era of leadership for the Company. The Board has therefore unanimously appointed Ryan Rhodes Chief Executive Officer of EDAP TMS effective May 1, 2023 to lead, strengthen and accelerate the Company’s development. Marc Oczachowski will continue to serve as Chairman of the Board of the Company.
Mr. Rhodes has over 30 years of leadership experience in market development in the medical device industry, including 20 years dedicated to medical robotics. Prior to joining EDAP, he served as Chief Executive Officer of Restoration Robotics, where he led the company to a successful merger with Venus Concept Inc. in 2019. He also held leadership positions at Intuitive Surgical, and Ethicon Inc., a Johnson & Johnson Company.
Marc Oczachowski, EDAP's Chairman and Chief Executive Officer, said: “In 2022, EDAP delivered another strong year of financial and operational performance, achieving record revenue and more than doubling worldwide Focal One sales compared to 2021. With EDAP experiencing strong positive HIFU momentum, particularly in the U.S., we have now reached a key inflection point to make this transition and to further accelerate our global expansion. I have enjoyed working with Ryan for almost two years. His leadership and knowledge of the industry, combined with his acute understanding of global commercial market development, are excellent assets for EDAP. I have complete confidence in Ryan’s ability to continue to accelerate the growth and development of the Company in support of its ongoing strategic objectives.”
Ryan Rhodes, Chief Executive Officer of EDAP US, stated, “During the fourth quarter, we achieved a record of nine Focal One transactions in the U.S., reflecting the growing appreciation for the clinical value of Focal One by both large academic healthcare institutions as well as local community hospitals. 2022 was a critical year in the adoption of Focal One robotic HIFU and the growth of this therapeutic option as part of the comprehensive management of prostate cancer. The number of U.S. sites selecting Focal One doubled over the previous year, and we saw positive momentum in the advancement of U.S. society guidelines with focal ablation. Our team and capacity have grown to be well positioned to drive even greater clinical and market expansion in 2023.”
Ryan Rhodes added: "I am very pleased to be appointed Chief Executive Officer of the EDAP TMS group, and I am grateful to both Marc and the EDAP Board for their continued confidence in my abilities. I am excited to lead EDAP’s global strategy to a new era of growth as we continue to build and expand our winning organization across the U.S. and international markets.”
Full-Year 2022 Results
Total revenue for the full year 2022 was EUR 55.1 million ($58.0 million), representing an increase of 25.1% over full-year 2021 total revenue of EUR 44.1 million ($51.9 million).
Total revenue in the HIFU business for the full year 2022 was EUR 15.6 million (USD 16.4 million), an increase of 57.7% as compared to EUR 9.9 million (USD 11.7 million) for the full year 2021.
Total revenue in the LITHO business for the full year 2022 was EUR 11.6 million (USD 12.2 million), an increase of 5.0% from EUR 11.0 million (USD 13.0 million) for the full year 2021.
Total revenue in the Distribution business for the full year 2022 was EUR 27.9 million (USD 29.4 million), a 20.6% increase compared to EUR 23.1 million (USD 27.3 million) for the full year 2021.
Gross profit for the twelve months ended December 31, 2022, was EUR 24.2 million (USD 25.4 million), compared to EUR 18.4 million (USD 21.7 million) for the year-ago period. Gross profit margin on net sales was 43.9% for the twelve months ended December 31, 2022, compared to 41.8% for the comparable period in 2021. The increase in gross profit year-over-year was due to higher sales effect on fixed costs, particularly in the HIFU business.
Operating expenses were EUR 28.5 million (USD 29.90 million) for the twelve months ended December 31, 2022, compared to EUR 20.0 million (USD 23.6 million) for the same period in 2021.
Operating loss for the twelve months ended December 31, 2022, was EUR 4.3 million (USD 4.5 million), compared to an operating loss of EUR 1.6 million (USD 1.9 million) for the twelve months ended December 31, 2021.
Net loss for the twelve months ended December 31, 2022, was EUR 2.9 million (USD 3.1 million), or EUR (0.09) per diluted share, as compared to net income of EUR 0.7 million (USD 0.8 million), or EUR 0.02 per diluted share in the year-ago period.
As of December 31, 2022, the company held cash, cash equivalents and short-term investments of EUR 63.1 million ($67.5 million), as compared to EUR 47.2 million (USD 53.4 million) as of December 31, 2021.
Fourth Quarter 2022 Results
Total revenue for the fourth quarter 2022 was EUR 15.7 million (USD 16.2 million), a 12.8% increase as compared to total revenue of EUR 14.0 million (USD 15.9 million) for the same period in 2021.
Total revenue in the HIFU business for the fourth quarter 2022 was EUR 5.4 million (USD 5.5 million), an increase of 27.9% as compared to EUR 4.2 million (USD 4.8 million) for the fourth quarter of 2021.
Total revenue in the LITHO business for the fourth quarter 2022 was EUR 3.6 million (USD 3.7 million), an increase of 7.5% as compared to EUR 3.3 million (USD 3.8 million) for the fourth quarter of 2021.
Total revenue in the Distribution business for the fourth quarter 2022 was EUR 6.7 million (USD 7.0 million), a 5.0% increase compared to EUR 6.4 million (USD 7.3 million) for the fourth quarter of 2021.
Gross profit for the fourth quarter 2022 was EUR 7.2 million (USD 7.4 million), compared to EUR 6.2 million (USD 7.1 million) for the year-ago period. Gross profit margin on net sales was 45.9% in the fourth quarter of 2022, compared to 44.5% in the year-ago period. The increase in gross profit year-over-year was driven by the higher sales effect on fixed costs.
Operating expenses were EUR 8.8 million (USD 9.1 million) for the fourth quarter of 2022, compared to EUR 5.8 million (USD 6.5 million) for the same period in 2021.
Operating loss for the fourth quarter of 2022 was EUR 1.6 million (USD 1.6 million), compared to an operating profit of EUR 0.5 million (USD 0.5 million) in the fourth quarter of 2021.
Net loss for the fourth quarter of 2022 was EUR 5.1 million (USD 5.3 million), or EUR (0.14) per diluted share, as compared to net income of EUR 1.4 million (USD 1.6 million), or EUR 0.04 per diluted share in the year-ago period.
Conference Call
An accompanying conference call and webcast will be conducted by management to review the results. The call will be held at 8:30 a.m. ET today, March 30th, 2023. Please refer to the information below for conference call dial-in information and webcast registration.
Conference Call & Webcast
Thursday, March 30th, 2023 @ 8:30 a.m. ET
Domestic: 877-451-6152
International: 201-389-0879
Passcode: 13736071
Webcast link: Here
Following the live call, a replay will be available on the Company's website, under "Investors Information."
About EDAP TMS SA
A recognized leader in the global therapeutic ultrasound market, EDAP TMS develops, manufactures, promotes and distributes worldwide minimally invasive medical devices for various pathologies using ultrasound technology. By combining the latest technologies in imaging and treatment modalities in its complete range of Robotic HIFU devices, EDAP TMS introduced the Focal One® in Europe and in the U.S. as an answer to all requirements for ideal prostate tissue ablation. With the addition of the ExactVu™ Micro-Ultrasound device, EDAP TMS is now the only company offering a complete solution from diagnostics to focal treatment of Prostate Cancer. EDAP TMS also produces and distributes other medical equipment including the Sonolith® i-move lithotripter and lasers for the treatment of urinary tract stones using extra-corporeal shockwave lithotripsy (ESWL). For more information on the Company, please visit and us.hifu-prostate.com and
Forward-Looking Statements
In addition to historical information, this press release contains forward-looking statements within the meaning of applicable federal securities laws, including Section 27A of the U.S. Securities Act of 1933 (the “Securities Act”) or Section 21E of the U.S. Securities Exchange Act of 1934, which may be identified by words such as “believe,” “can,” “contemplate,” “could,” “plan,” “intend,” “is designed to,” “may,” “might,” “potential,” “objective,” “target,” “project,” “predict,” “forecast,” “ambition,” “guideline,” “should,” “will,” “estimate,” “expect” and “anticipate,” or the negative of these and similar expressions, which reflect our views about future events and financial performance. Such statements are based on management's current expectations and are subject to a number of risks and uncertainties, including matters not yet known to us or not currently considered material by us, and there can be no assurance that anticipated events will occur or that the objectives set out will actually be achieved. Important factors that could cause actual results to differ materially from the results anticipated in the forward-looking statements include, among others, the clinical status and market acceptance of our HIFU devices and the continued market potential for our lithotripsy and distribution divisions, as well as risks associated with the current worldwide inflationary environment, the uncertain worldwide economic, political and financial environment, geopolitical instability, climate change and pandemics like the COVID 19 pandemic, or other public health crises, and their related impact on our business operations, including their impacts across our businesses or demand for our devices and services.
Other factors that may cause such a difference may also include, but are not limited to, those described in the Company's filings with the Securities and Exchange Commission and in particular, in the sections "Cautionary Statement on Forward-Looking Information" and "Risk Factors" in the Company's Annual Report on Form 20-F.
Forward-looking statements speak only as of the date they are made. Other than required by law, we do not undertake any obligation to update them in light of new information or future developments. These forward-looking statements are based upon information, assumptions and estimates available to us as of the date of this press release, and while we believe such information forms a reasonable basis for such statements, such information may be limited or incomplete.
Company Contact
Blandine Confort
Investor Relations / Legal Affairs
EDAP TMS SA
+33 4 72 15 31 50
bconfort@edap-tms.com
Investor Contact
John Fraunces
LifeSci Advisors, LLC
917-355-2395
jfraunces@lifesciadvisors.com
EDAP TMS S.A.
UNAUDITED CONDENSED CONSOLIDATED STATEMENTS OF OPERATIONS
(Amounts in thousands of Euros and U.S. Dollars, except per share data)
Three Months Ended:
Three Months Ended:
December 31,
December 31,
December 31,
December 31,
2022
2021
2022
2021
Euros
Euros
$US
$US
Sales of medical equipment
11,493
9,864
11,840
11,231
Net Sales of RPP and Leases
1,441
1,387
1,484
1,579
Sales of spare parts, supplies and Services
2,784
2,720
2,868
3,097
TOTAL NET SALES
15,718
13,971
16,192
15,907
Other revenues
—
1
—
2
TOTAL REVENUES
15,718
13,973
16,192
15,909
Cost of sales
(8,500)
(7,762)
(8,756)
(8,837)
GROSS PROFIT
7,218
6,211
7,436
7,072
Research & development expenses
(1,304)
(562)
(1,344)
(640)
S, G & A expenses
(7,484)
(5,188)
(7,709)
(5,907)
Total operating expenses
(8,788)
(5,750)
(9,053)
(6,547)
OPERATING PROFIT (LOSS)
(1,570)
461
(1,617)
525
Interest (expense) income, net
297
23
306
26
Currency exchange gains (loss), net
(4,075)
786
(4,198)
895
INCOME (LOSS) BEFORE TAXES AND MINORITY INTEREST
(5,348)
1,270
(5,509)
1,446
Income tax (expense) credit
217
95
224
108
NET INCOME (LOSS)
(5,130)
1,365
(5,285)
1,554
Earning per share – Basic
(0.14)
0.04
(0.14)
0.05
Average number of shares used in computation of EPS
36,863,623
33,466,136
36,863,623
33,466,136
Earning per share – Diluted
(0.14)
0.04
(0.14)
0.05
Average number of shares used in computation of EPS for positive net income
36,863,623
33,641,317
36,863,623
33,641,317
NOTE: Translated for convenience of the reader to U.S. dollars at the 2022 average three months’ noon buying rate of 1 Euro = 1.0302 USD, and 2021 average three months noon buying rate of 1 Euro = 1.1386 USD
EDAP TMS S.A.
UNAUDITED CONDENSED CONSOLIDATED STATEMENTS OF OPERATIONS
(Amounts in thousands of Euros and U.S. Dollars, except per share data)
Year Ended:
Year Ended:
December 31,
December 31,
December 31,
December 31,
2022
2021
2022
2021
Euros
Euros
$US
$US
Sales of medical equipment
38,462
29,040
40,456
34,229
Net Sales of RPP and Leases
5,617
4,968
5,908
5,856
Sales of spare parts, supplies and Services
11,030
10,052
11,602
11,848
TOTAL NET SALES
55,108
44,060
57,966
51,932
Other revenues
—
6
—
7
TOTAL REVENUES
55,108
44,065
57,966
51,939
Cost of sales
(30,916)
(25,643)
(32,519)
(30,225)
GROSS PROFIT
24,193
18,422
25,447
21,714
Research & development expenses
(4,920)
(3,402)
(5,175)
(4,010)
S, G & A expenses
(23,530)
(16,633)
(24,751)
(19,605)
Total operating expenses
(28,450)
(20,034)
(29,925)
(23,614)
OPERATING PROFIT (LOSS)
(4,257)
(1,612)
(4,478)
(1,900)
Interest (expense) income, net
235
145
248
171
Currency exchange gains (loss), net
1,926
2,360
2,025
2,781
INCOME (LOSS) BEFORE TAXES AND MINORITY INTEREST
(2,096)
893
(2,205)
1,052
Income tax (expense) credit
(837)
(193)
(880)
(227)
NET INCOME (LOSS)
(2,933)
700
(3,085)
825
Earning per share – Basic
(0.09)
0.02
(0.09)
0.03
Average number of shares used in computation of EPS
34,392,598
32,129,047
34,392,598
32,129,047
Earning per share – Diluted
(0.09)
0.02
(0.09)
0.03
Average number of shares used in computation of EPS for positive net income
34,392,598
32,422,871
34,392,598
32,422,871
NOTE: Translated for convenience of the reader to U.S. dollars at the 2022 average twelve months’ noon buying rate of 1 Euro = 1.0519 USD, and 2021 average twelve months noon buying rate of 1 Euro = 1.1787 USD
EDAP TMS S.A.
UNAUDITED CONSOLIDATED BALANCE SHEETS HIGHLIGHTS
(Amounts in thousands of Euros and U.S. Dollars)
December 31,
December 31,
December 31,
December 31,
2022
2021
2022
2021
Euros
Euros
$US
$US
Cash, cash equivalents and short-term treasury investments
63,136
47,183
67,539
53,405
Account receivables, net
14,943
12,118
15,985
13,716
Inventory
11,780
7,499
12,601
8,487
Other current assets
660
581
706
658
TOTAL CURRENT ASSETS
90,518
67,382
96,832
76,267
Property, plant and equipment, net
5,984
5,173
6,401
5,855
Goodwill
2,412
2,412
2,580
2,730
Other non-current assets
2,210
2,260
2,364
2,558
TOTAL ASSETS
101,123
77,226
108,177
87,409
Accounts payable & other accrued liabilities
13,087
10,786
14,000
12,208
Deferred revenues, current portion
4,050
3,408
4,333
3,857
Short term borrowing
1,846
1,914
1,975
2,167
Other current liabilities
2,725
1,843
2,916
2,086
TOTAL CURRENT LIABILITIES
21,708
17,951
23,223
20,318
Obligations under operating and finance leases non-current
1,222
1,318
1,308
1,492
Long term debt, non-current
3,587
4,930
3,837
5,580
Deferred revenues, non-current
264
440
282
498
Other long term liabilities
2,710
2,534
2,899
2,868
TOTAL LIABILITIES
29,492
27,172
31,549
30,755
TOTAL SHAREHOLDERS’EQUITY
71,632
50,054
76,628
56,655
TOTAL LIABILITIES & SHAREHOLDERS’ EQUITY
101,123
77,226
108,177
87,409
NOTE: Translated for convenience of the reader to U.S. dollars at the noon buying rate of 1 Euro = 1.0697 USD, on December 31, 2022 and at the noon buying rate of 1 Euro = 1.1319 USD, on December 31, 2021.
EDAP TMS S.A.
UNAUDITED CONSOLIDATED STATEMENTS OF CASH FLOWS
(Amounts in thousands of Euros)
Year Ended
Twelve Months Ended
Year Ended
Twelve Months Ended
December 31,
December 31,
December 31,
December 31,
2022
2021
2022
2021
(Euros)
(Euros)
($US)
($US)
NET INCOME (LOSS)
(2,933)
700
(3,085)
825
Adjustments to reconcile net income (loss) to net cash generated by (used in) operating activities(1)
4,225
3,225
4,444
3,801
OPERATING CASH FLOW
1,292
3,925
1,359
4,626
Increase/Decrease in operating assets and liabilities
(4,316)
520
(4,539)
613
NET CASH GENERATED BY (USED IN) OPERATING ACTIVITIES
(3,024)
4,445
(3,180)
5,239
Short term investments
—
—
—
—
Additions to capitalized assets produced by the company and other capital expenditures
(2,378)
(1,638)
(2,501)
(1,931)
NET CASH GENERATED BY (USED IN) INVESTING ACTIVITIES
(2,378)
(1,638)
(2,501)
(1,931)
NET CASH GENERATED BY (USED IN) FINANCING ACTIVITIES
21,741
20,266
22,869
23,887
NET EFFECT OF EXCHANGE RATE CHANGES ON CASH AND CASH EQUIVALENTS
(388)
(585)
(3,053)
(3,992)
NET INCREASE (DECREASE) IN CASH AND CASH EQUIVALENTS
15,952
22,488
14,134
23,204
(1) including share based compensation expenses for 2,103 thousand of Euros for theyear ended December 31,2022 and 1,900 thousand of Euros for the full year endedDecember 31, 2021.
NOTE: Translated for convenience of the reader to U.S. dollars at the 2022 average twelve months’ noon buying rate of 1 Euro = 1.0519 USD, and 2021 average twelve months noon buying rate of 1 Euro = 1.1787 USD
EDAP TMS S.A.
UNAUDITED CONDENSED STATEMENTS OF OPERATIONS BY DIVISION
twelvemonths endedDecember 31, 2022
(Amounts in thousands of Euros)
HIFU
ESWL
Distribution
Reconciling
Total After
Division
Division
Division
Items
Consolidation
Sales of goods
9,437
4,880
24,145
—
38,462
Sales of RPPs & Leases
4,287
1,058
272
—
5,617
Sales of spare parts & services
1,909
5,630
3,491
—
11,030
TOTAL NET SALES
15,634
11,568
27,907
—
55,108
Other revenues
—
—
—
—
—
TOTAL REVENUES
15,634
11,568
27,907
—
55,108
GROSS PROFIT (% of Net Sales)
8,846
56.6
%
4,836
41.8
%
10,511
37.7
%
—
24,193
43.9
%
Research & Development
(3,525)
(950)
(444)
—
(4,920)
Total SG&A plus depreciation
(10,214)
(2,964)
(8,099)
(2,254)
(23,530)
OPERATING PROFIT (LOSS)
(4,894)
922
1,968
(2,254)
(4,257)
Attachment
2023 - 03 - 30 -- EDAP FY2022 Strategy - FINAL2
Financial StatementExecutive Change
100 Deals associated with Restoration Robotics, Inc.
Login to view more data
100 Translational Medicine associated with Restoration Robotics, Inc.
Login to view more data
Corporation Tree
Boost your research with our corporation tree data.
login
or

Pipeline
Pipeline Snapshot as of 29 Apr 2025
No data posted
Login to keep update
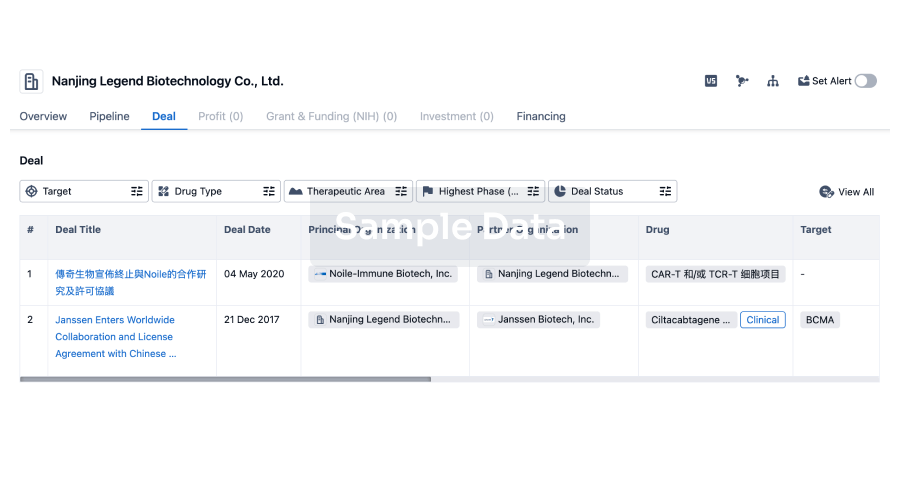
Deal
Boost your decision using our deal data.
login
or
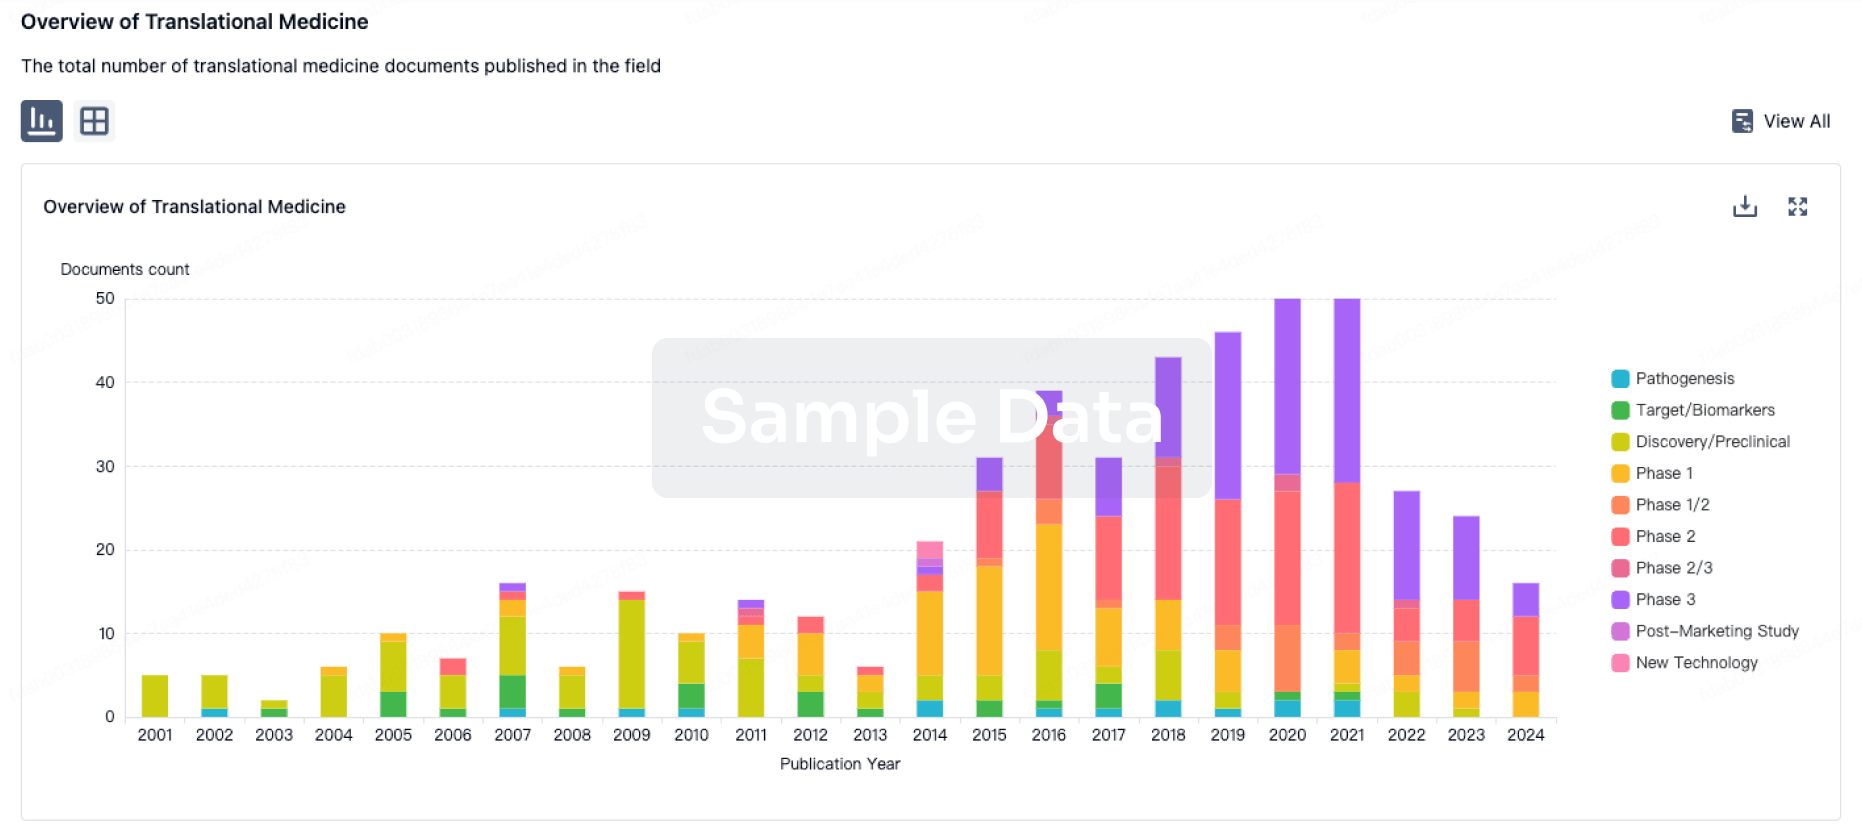
Translational Medicine
Boost your research with our translational medicine data.
login
or
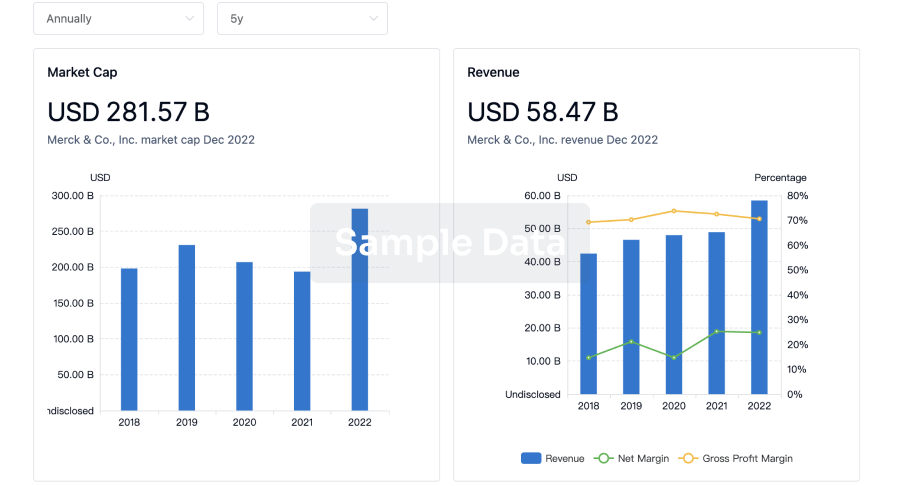
Profit
Explore the financial positions of over 360K organizations with Synapse.
login
or
Grant & Funding(NIH)
Access more than 2 million grant and funding information to elevate your research journey.
login
or
Investment
Gain insights on the latest company investments from start-ups to established corporations.
login
or
Financing
Unearth financing trends to validate and advance investment opportunities.
login
or
Chat with Hiro
Get started for free today!
Accelerate Strategic R&D decision making with Synapse, PatSnap’s AI-powered Connected Innovation Intelligence Platform Built for Life Sciences Professionals.
Start your data trial now!
Synapse data is also accessible to external entities via APIs or data packages. Empower better decisions with the latest in pharmaceutical intelligence.
Bio
Bio Sequences Search & Analysis
Sign up for free
Chemical
Chemical Structures Search & Analysis
Sign up for free