An analysis of Tusamitamab ravtansine's R&D progress and its clinical results presented at the 2023 AACR Annual Meeting
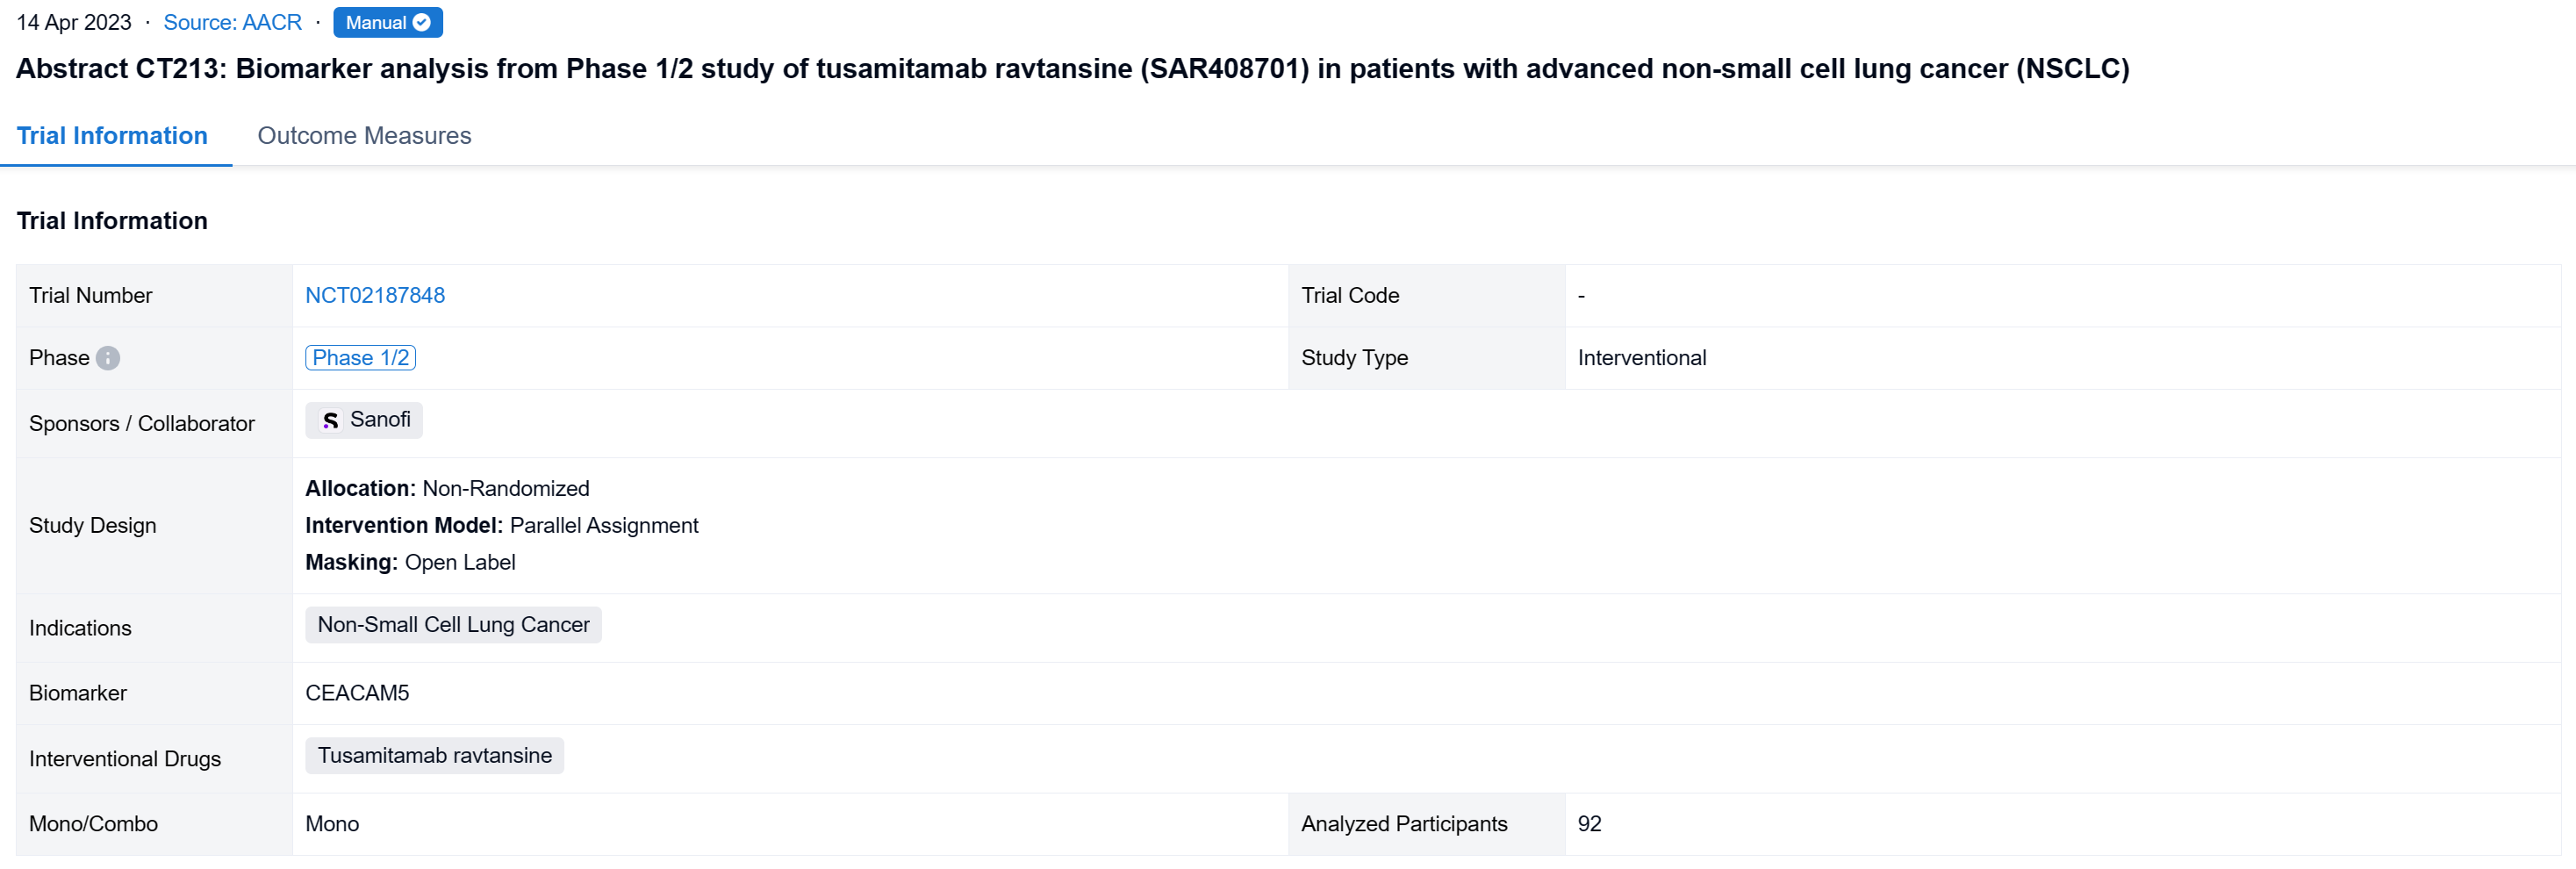
Based on previous studies, biomarker analysis from Phase 1/2 study of tusamitamab ravtansine (SAR408701) in patients with advanced non-small cell lung cancer (NSCLC) was reported at the AACR Congress.
Tusamitamab ravtansine's R&D Progress
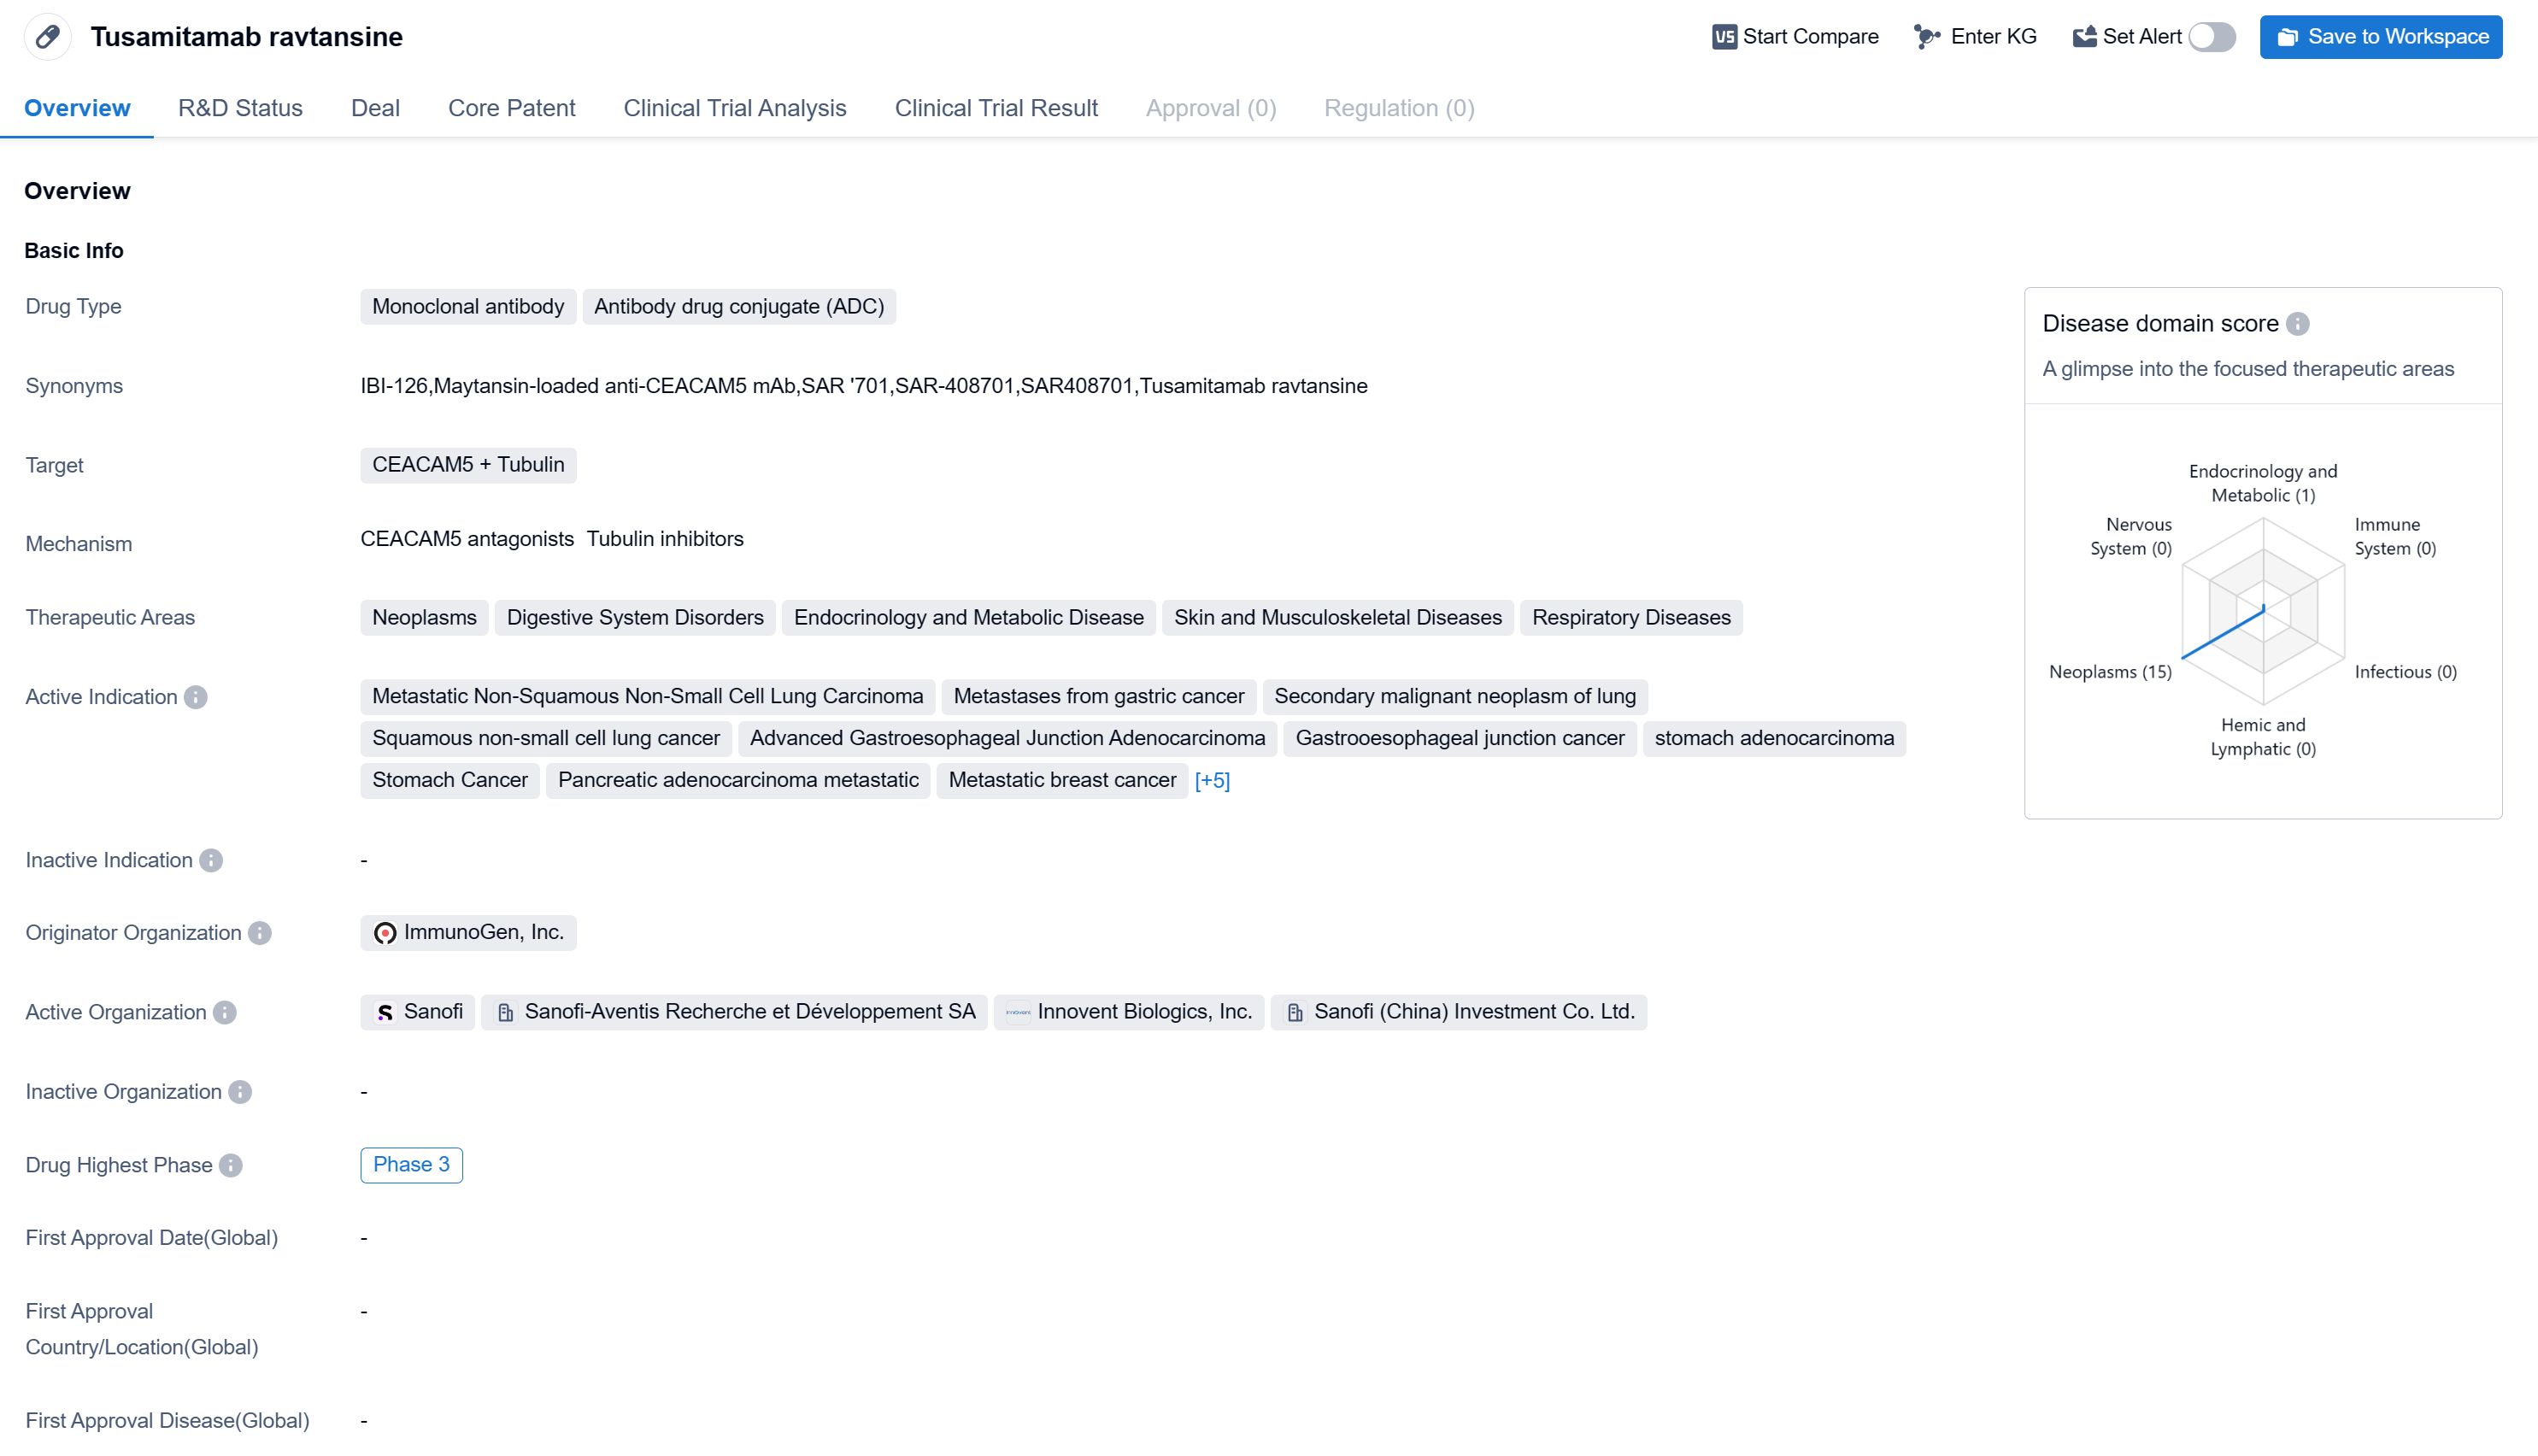
Tusamitamab ravtansine is a monoclonal antibody and antibody drug conjugate (ADC) that targets CEACAM5 and Tubulin. It is being developed by ImmunoGen, Inc. The drug has shown potential therapeutic applications in various therapeutic areas, including neoplasms, digestive system disorders, endocrinology and metabolic disease, skin and musculoskeletal diseases, and respiratory diseases.
According to the Patsnap Synapse, Tusamitamab ravtansine has reached the highest phase of clinical development globally, which is Phase 3. And the clinical trial areas for Tusamitamab ravtansine are primarily in the United States, China, and France. The key indication is Neoplasms. 
Detailed Clinical Result of Tusamitamab ravtansine
The non-randomized, parallel assignment, open-labeled clinical trial (NCT02187848) explored some biomarker associations with tumor CEACAM5 expression by immunohistochemistry (IHC), and whether biomarkers predict objective response rate (ORR).
In this study, CEACAM5 expression was assessed by IHC, RNA sequencing, and whole exome sequencing (WES) on latest archival tumor samples; and circulating CEACAM5 (cCEACAM5) and CEA (cCEA) were also assessed. 2 cohorts of pts with IHC CEACAM5 membrane expression at ≥2+ intensity were enrolled: in ≥50% of tumor cells (high expressors, HEs, n = 64); and in ≥1% to <50% of tumor cells (moderate expressors, MEs, n = 28). Pts received tusamitamab ravtansine 100 mg/m2 IV every 2 weeks.
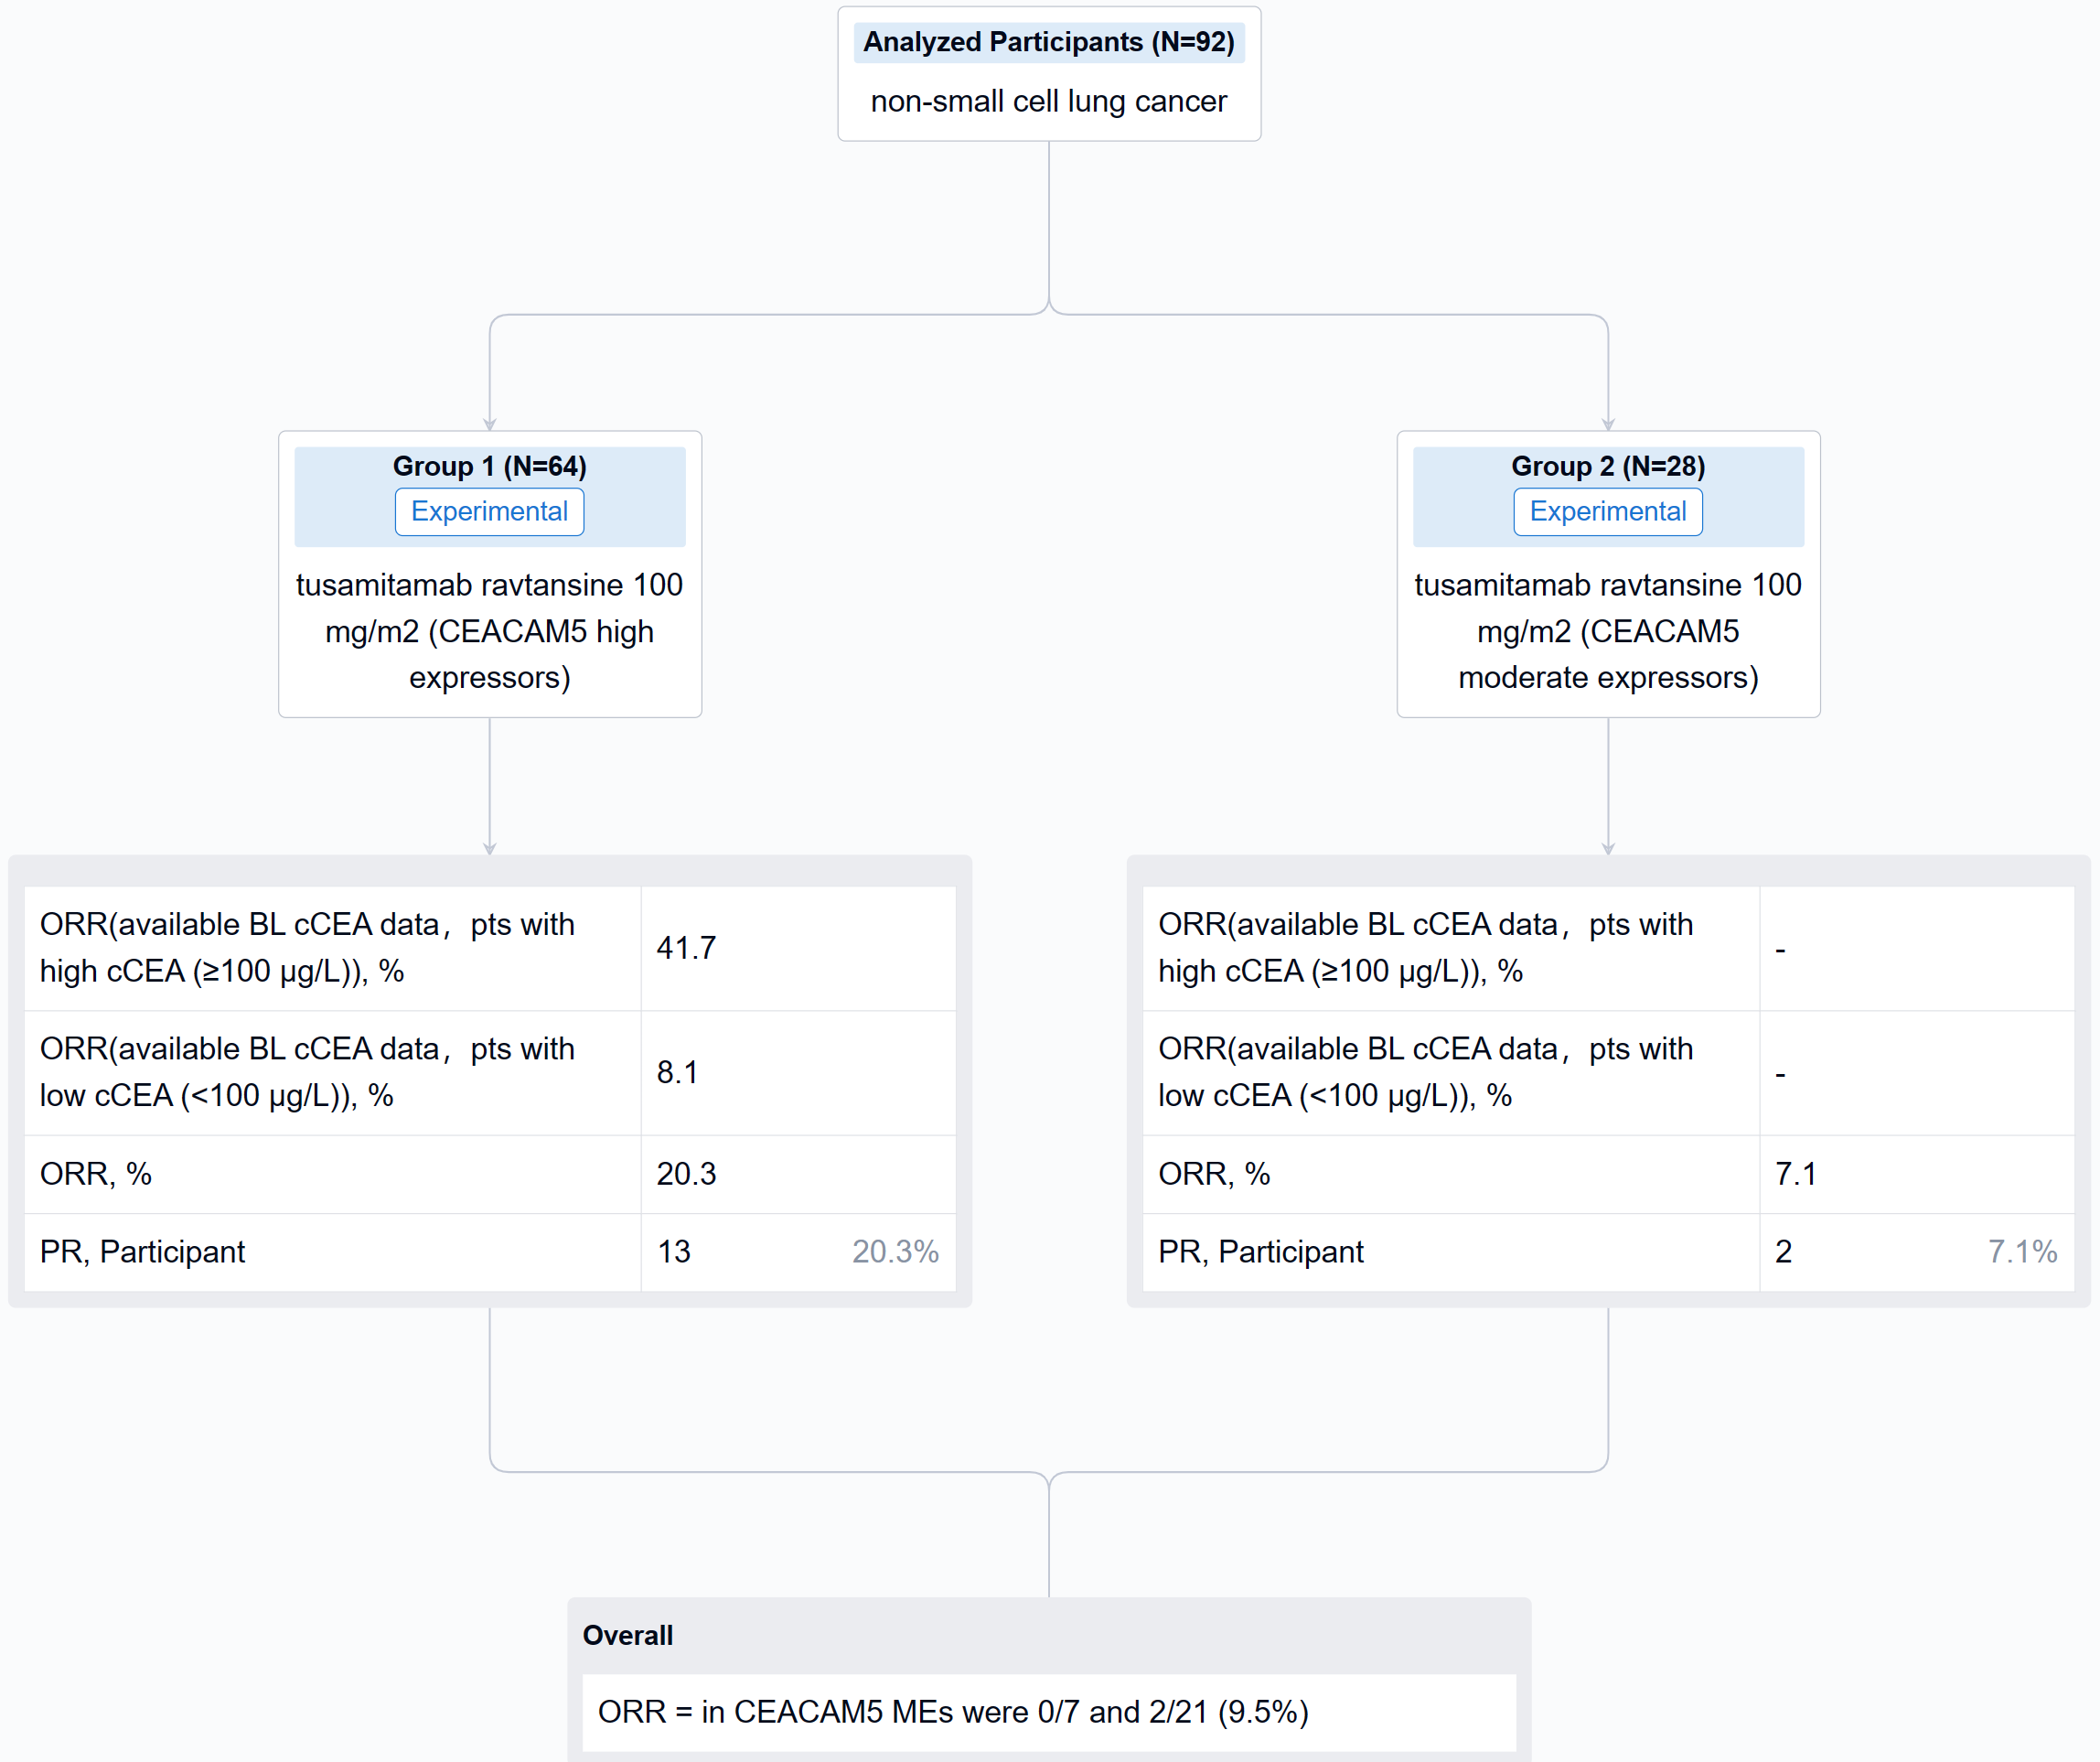
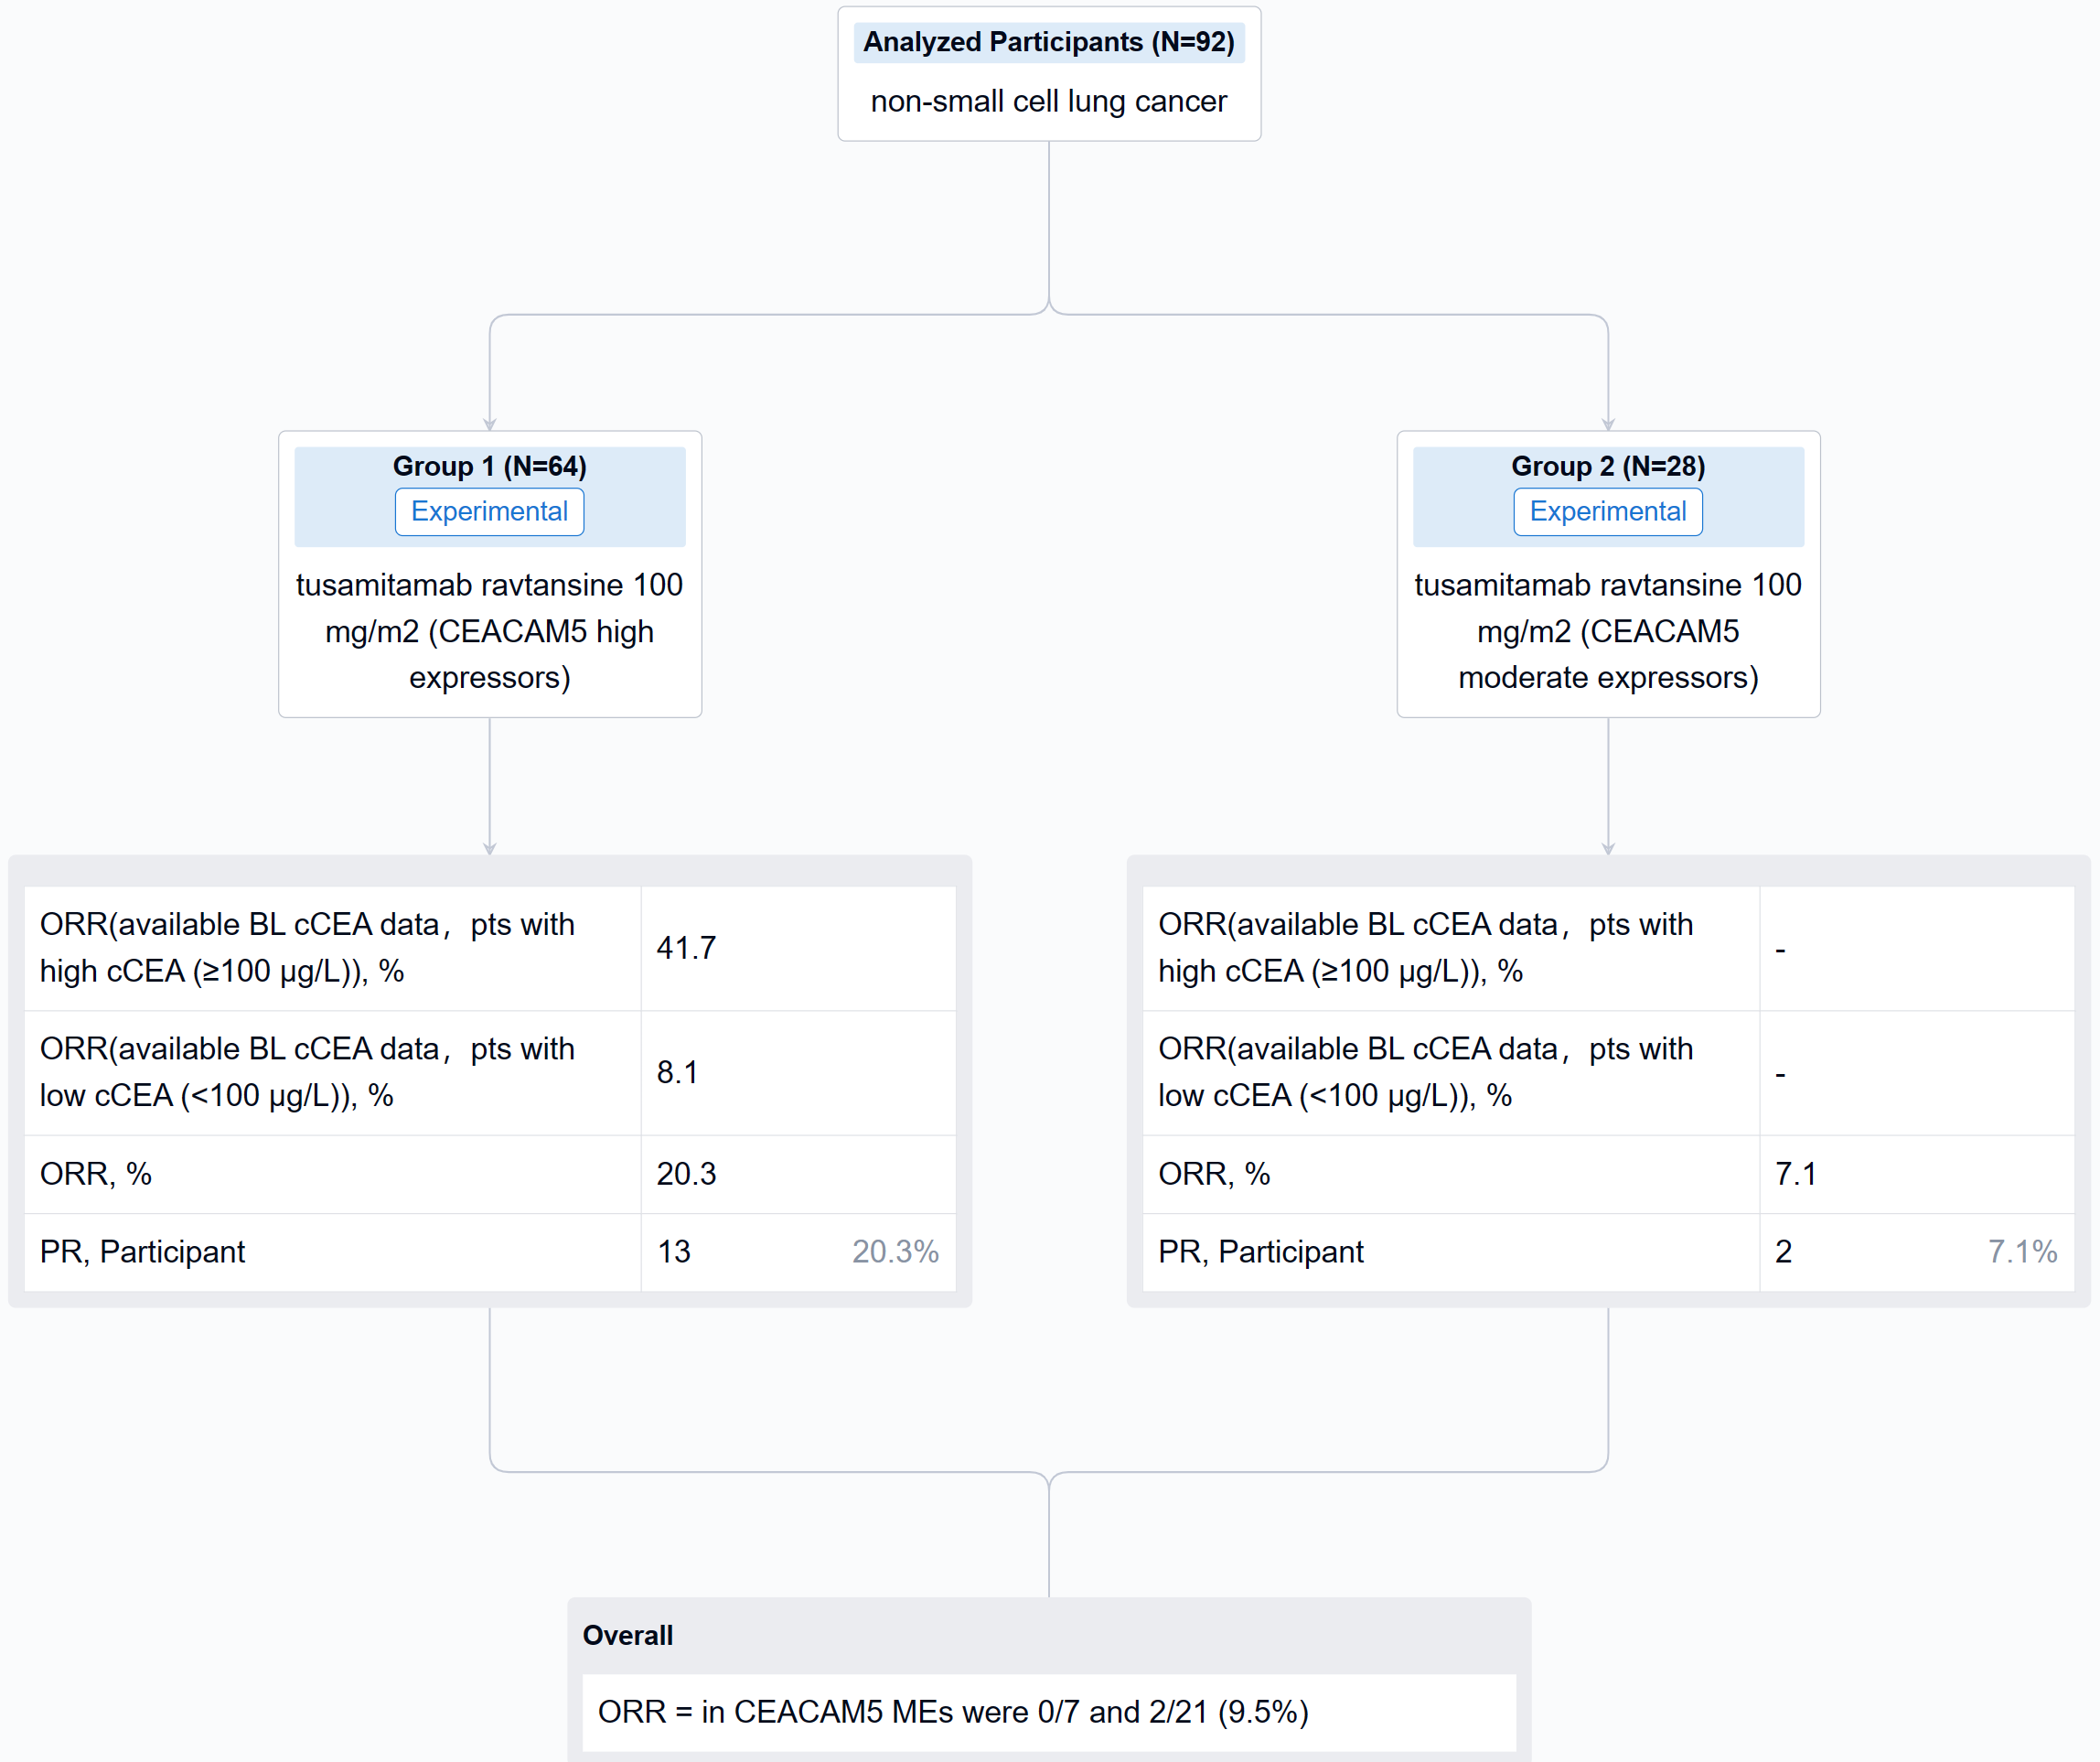
The result showed that cCEA and cCEACAM5 were strongly associated (Spearman rho, 0.9), with weak associations between IHC CEACAM5 and cCEA or cCEACAM5 (Spearman rho, 0.3 and 0.4, respectively). Higher levels of CEACAM5 mRNA were observed in CEACAM5 HEs vs MEs (P=0.0027). EGFR and KRAS genetic alterations by WES were present in 44.8% and 65.5% of CEACAM5 HEs, respectively, and 21.4% and 78.6% of CEACAM5 MEs, respectively. Confirmed partial responses were seen in 13/64 HEs (ORR 20.3%) and 2/28 MEs (ORR 7.1%). In CEACAM5 HEs with available baseline (BL) cCEA data, 25/62 (40.3%) had a cCEA level ≥100 µg/L, with a median value of 71.6 µg/L (range 1-8809); corresponding values in CEACAM5 MEs were 7/28 (25.0%) and 12.4 µg/L (range 0.5-684). In response evaluable CEACAM5 HEs with available BL cCEA data (n = 61), ORR was 10/24 (41.7%) in pts with high cCEA (≥100 µg/L) and 3/37 (8.1%) in pts with low cCEA (<100 µg/L); corresponding ORRs in CEACAM5 MEs were 0/7 and 2/21 (9.5%).
It can be concluded that in CEACAM5 HEs, high cCEA was associated with numerically greater ORR vs low cCEA (41.7% vs 8.1%). Associations were also observed between: cCEA and cCEACAM5; IHC CEACAM5, cCEA, and cCEACAM5; and IHC CEACAM5 and CEACAM5 tumor mRNA levels, but not between IHC CEACAM5 and actionable oncogenic drivers.
How to Easily View the Clinical Results Using Synapse Database?
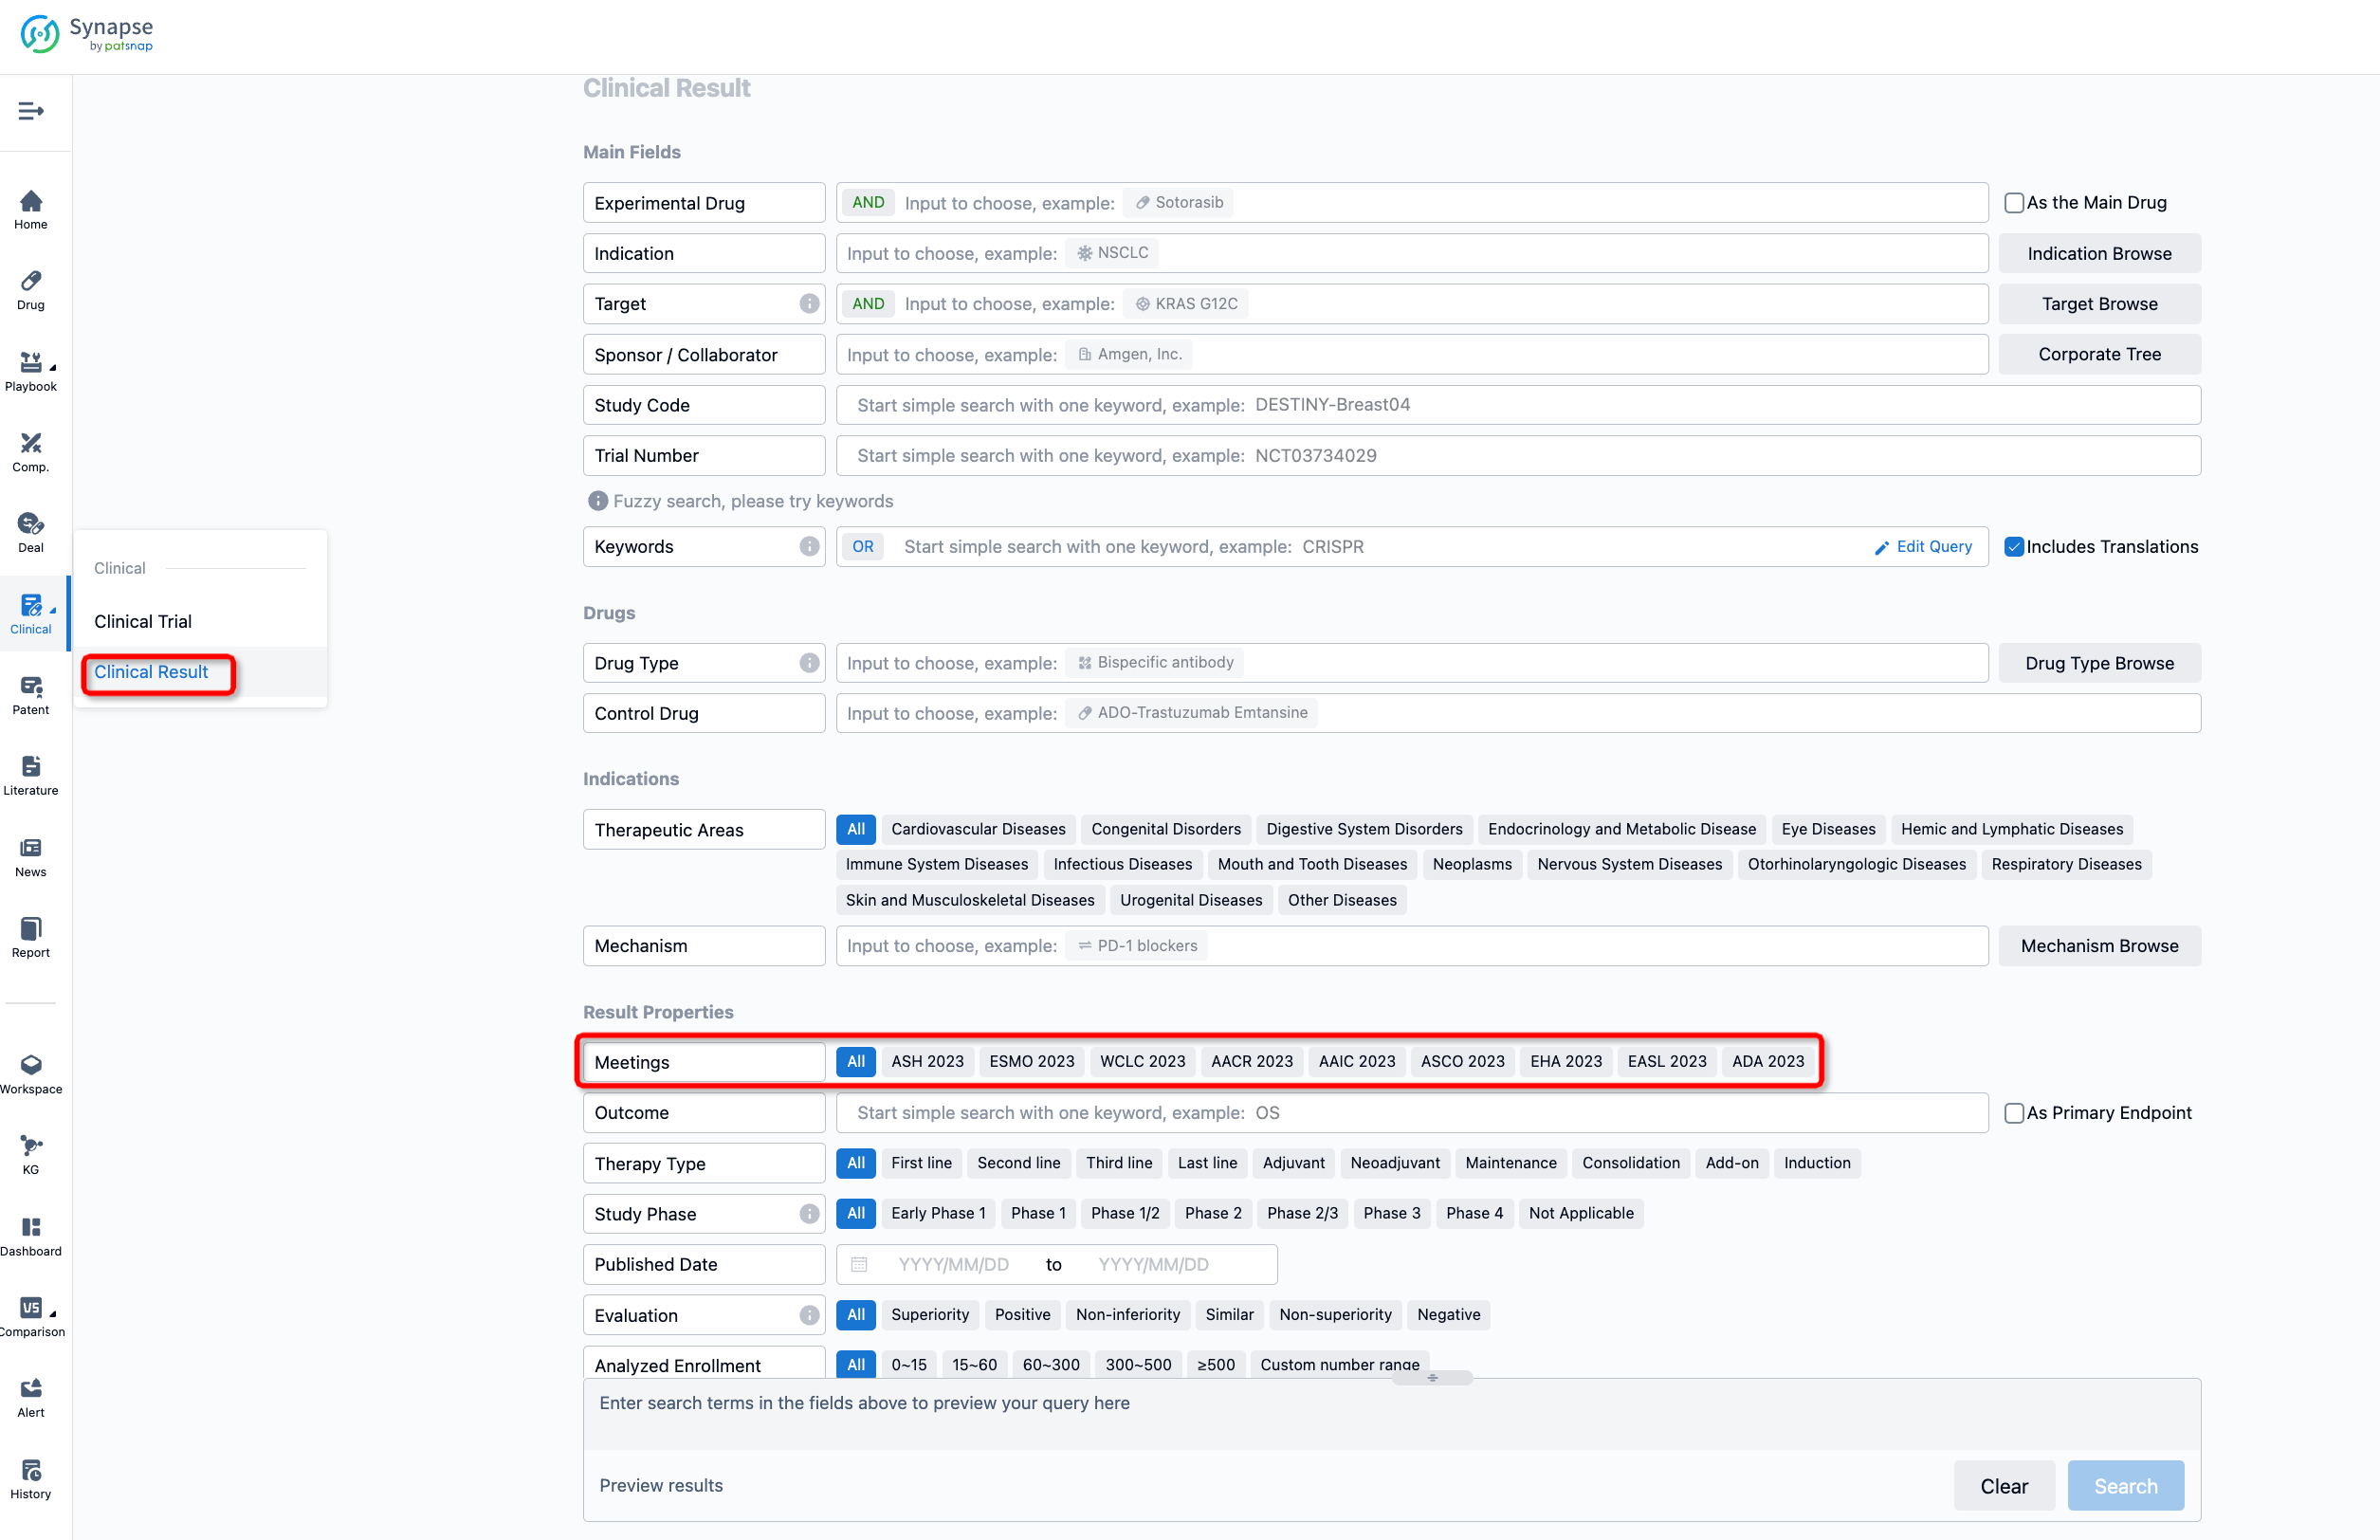
If you want to know the other clinical results of popular conferences, please lick on the “Clinical Results” on the homepage of Patsnap Synapse, which provides multi-dimensional screening and filtering of drugs, indications, targets, companies, result evaluation, release date, popular conferences, etc. to help you quickly locate the data you need.
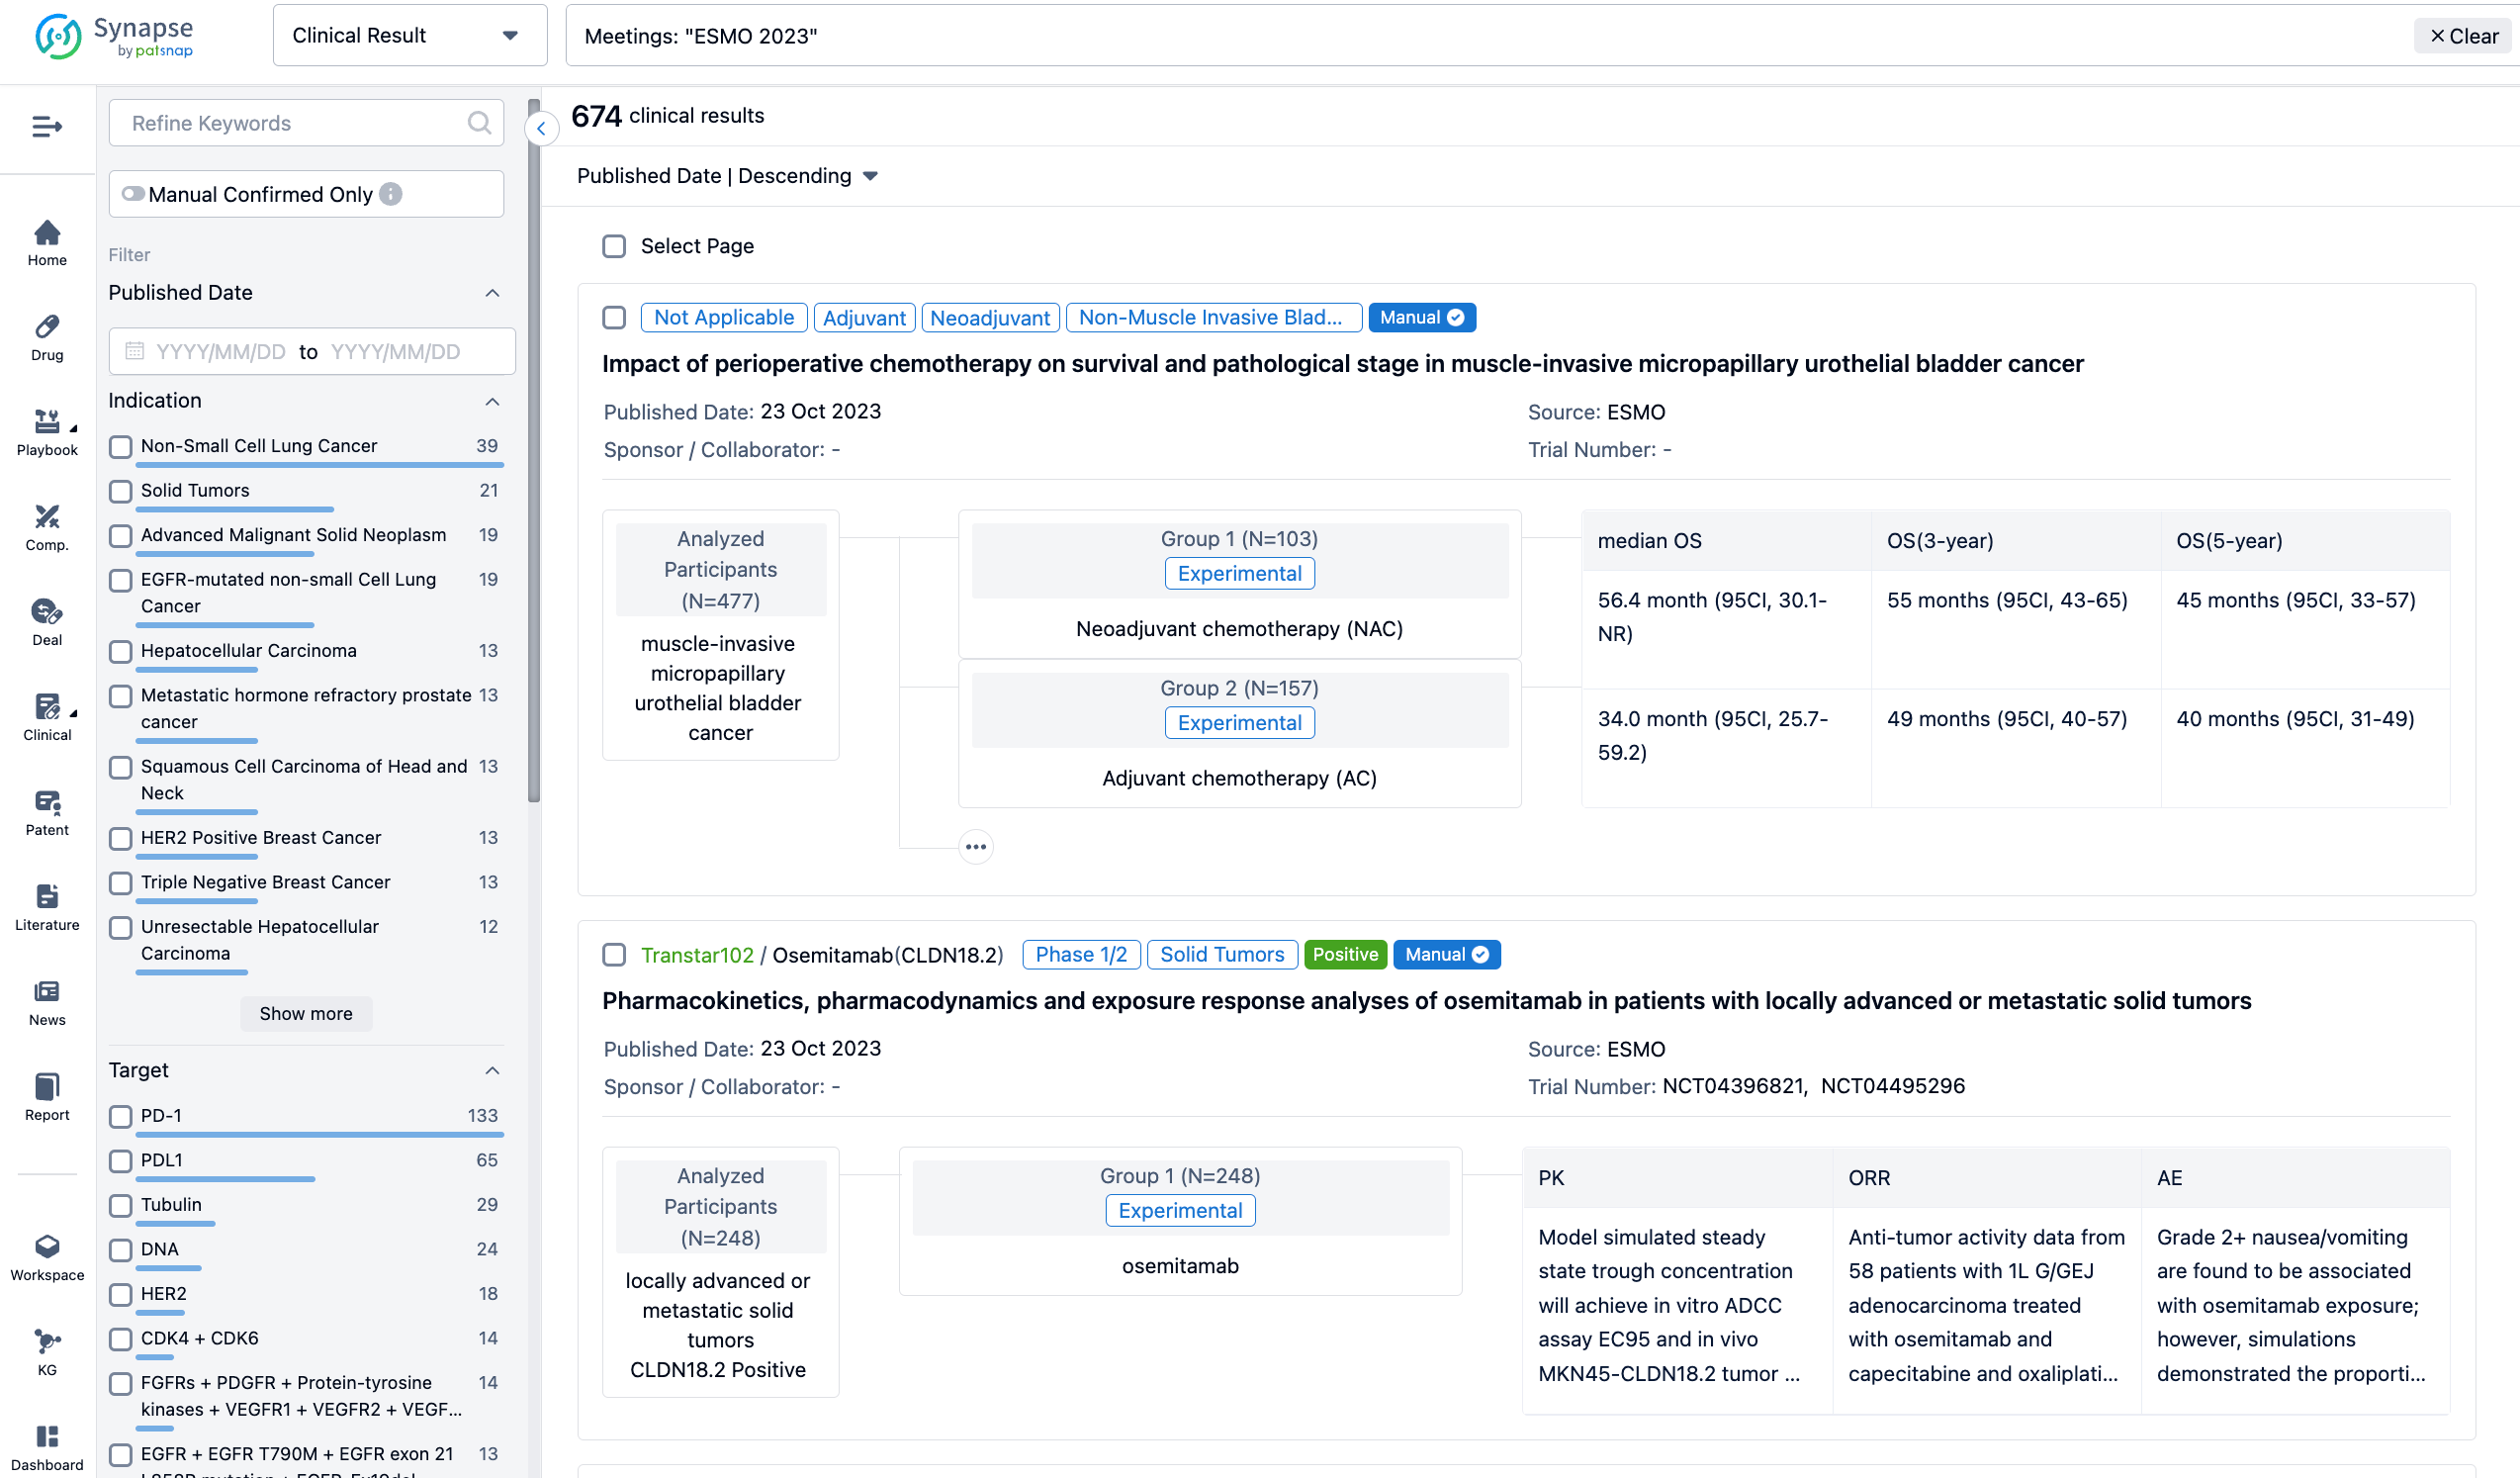
Select the clinical meeting you are interested in, such as ESMO. In the results, you can quickly locate the data you want to view by indication, phase and drug name.
A single result clearly shows important information such as registration number, phase, indication, Sponsor/Collaborator, biomarker, Trial number, dosing regimen and more.
If you would like to view more information about this result, you can go to the result detail page by clicking on the title.
Above the headings, we provide the original source of the outcome data. The basic information is supplemented with more information beyond the list, such as company, study. design, etc.
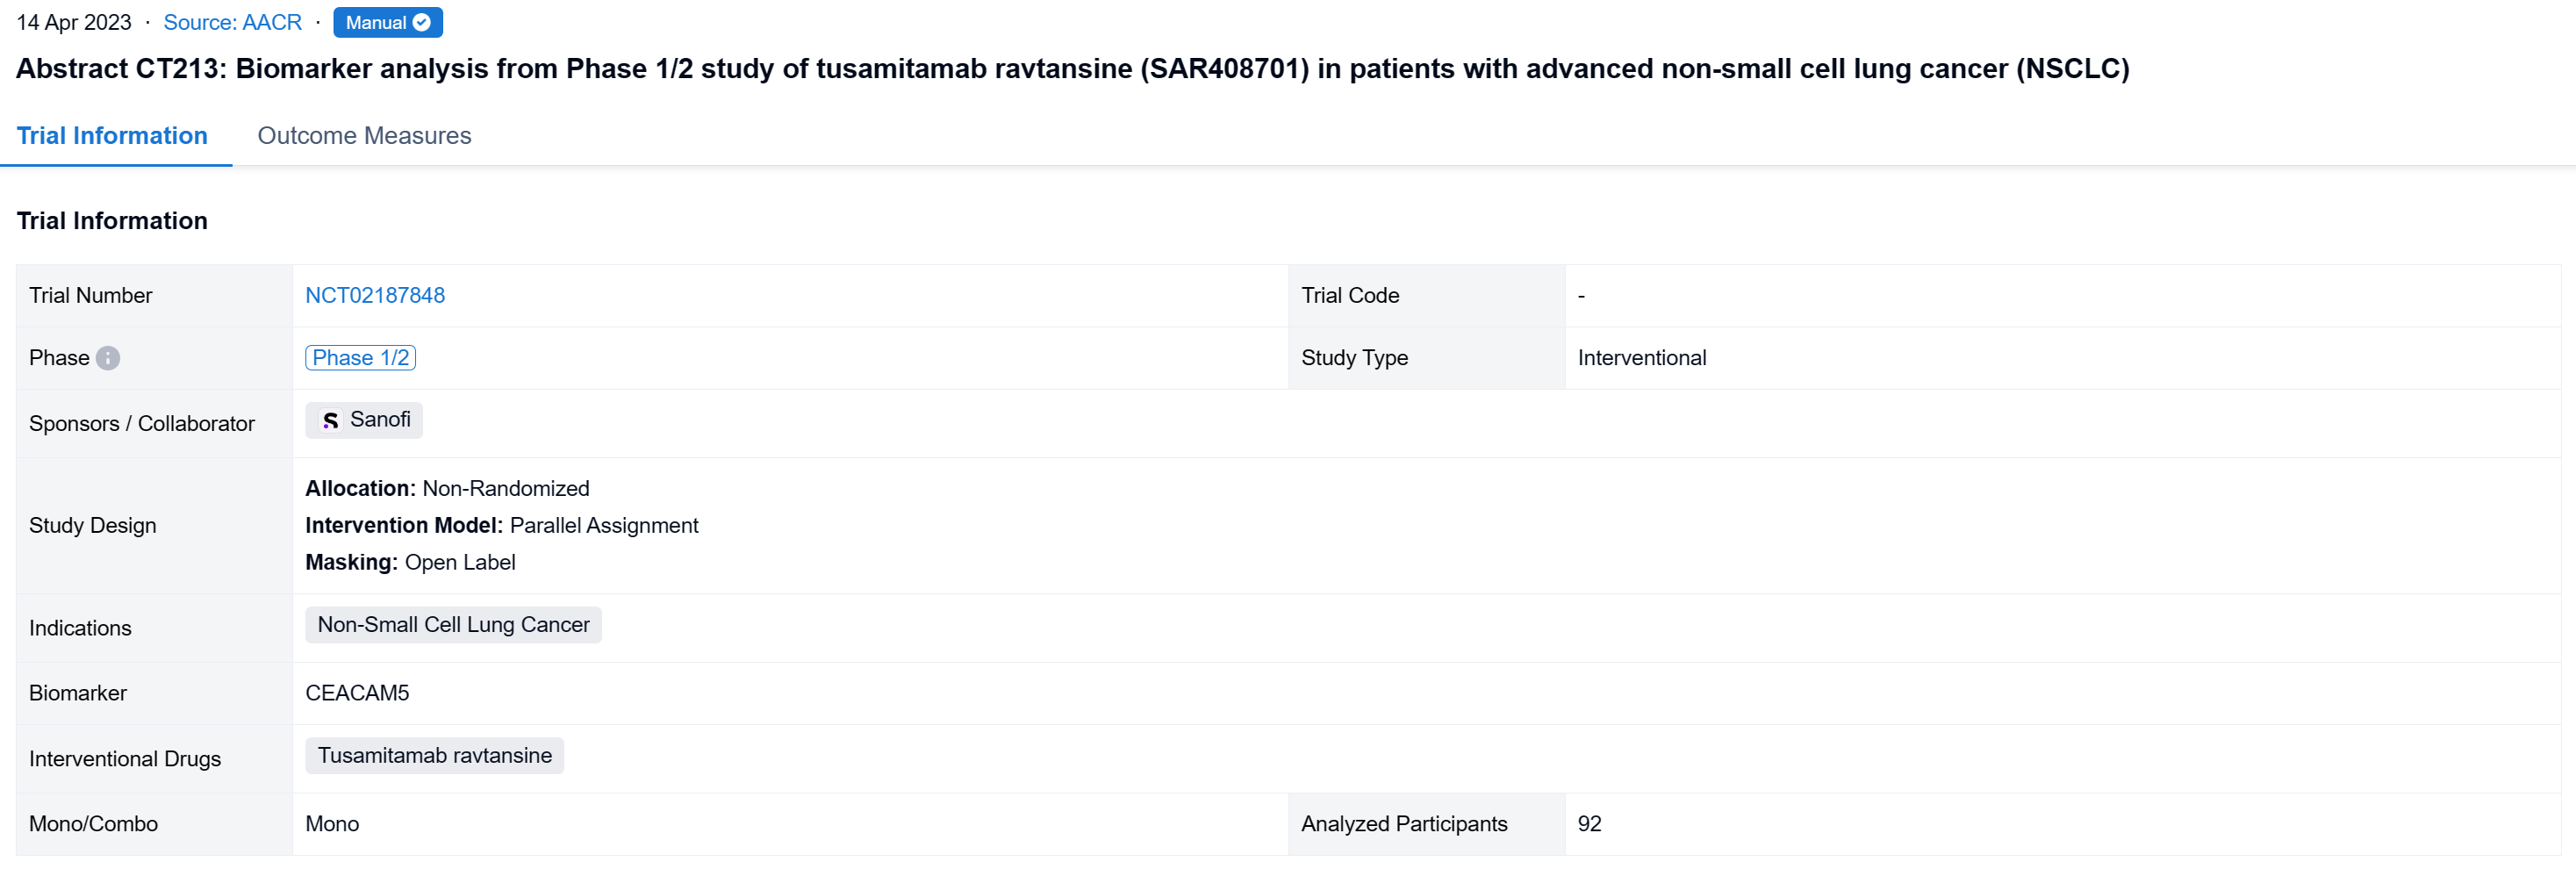
In the important Outcome Measures section, we provide both list and flowchart forms, which are convenient for you to overview the comparison group information and core indicator data.

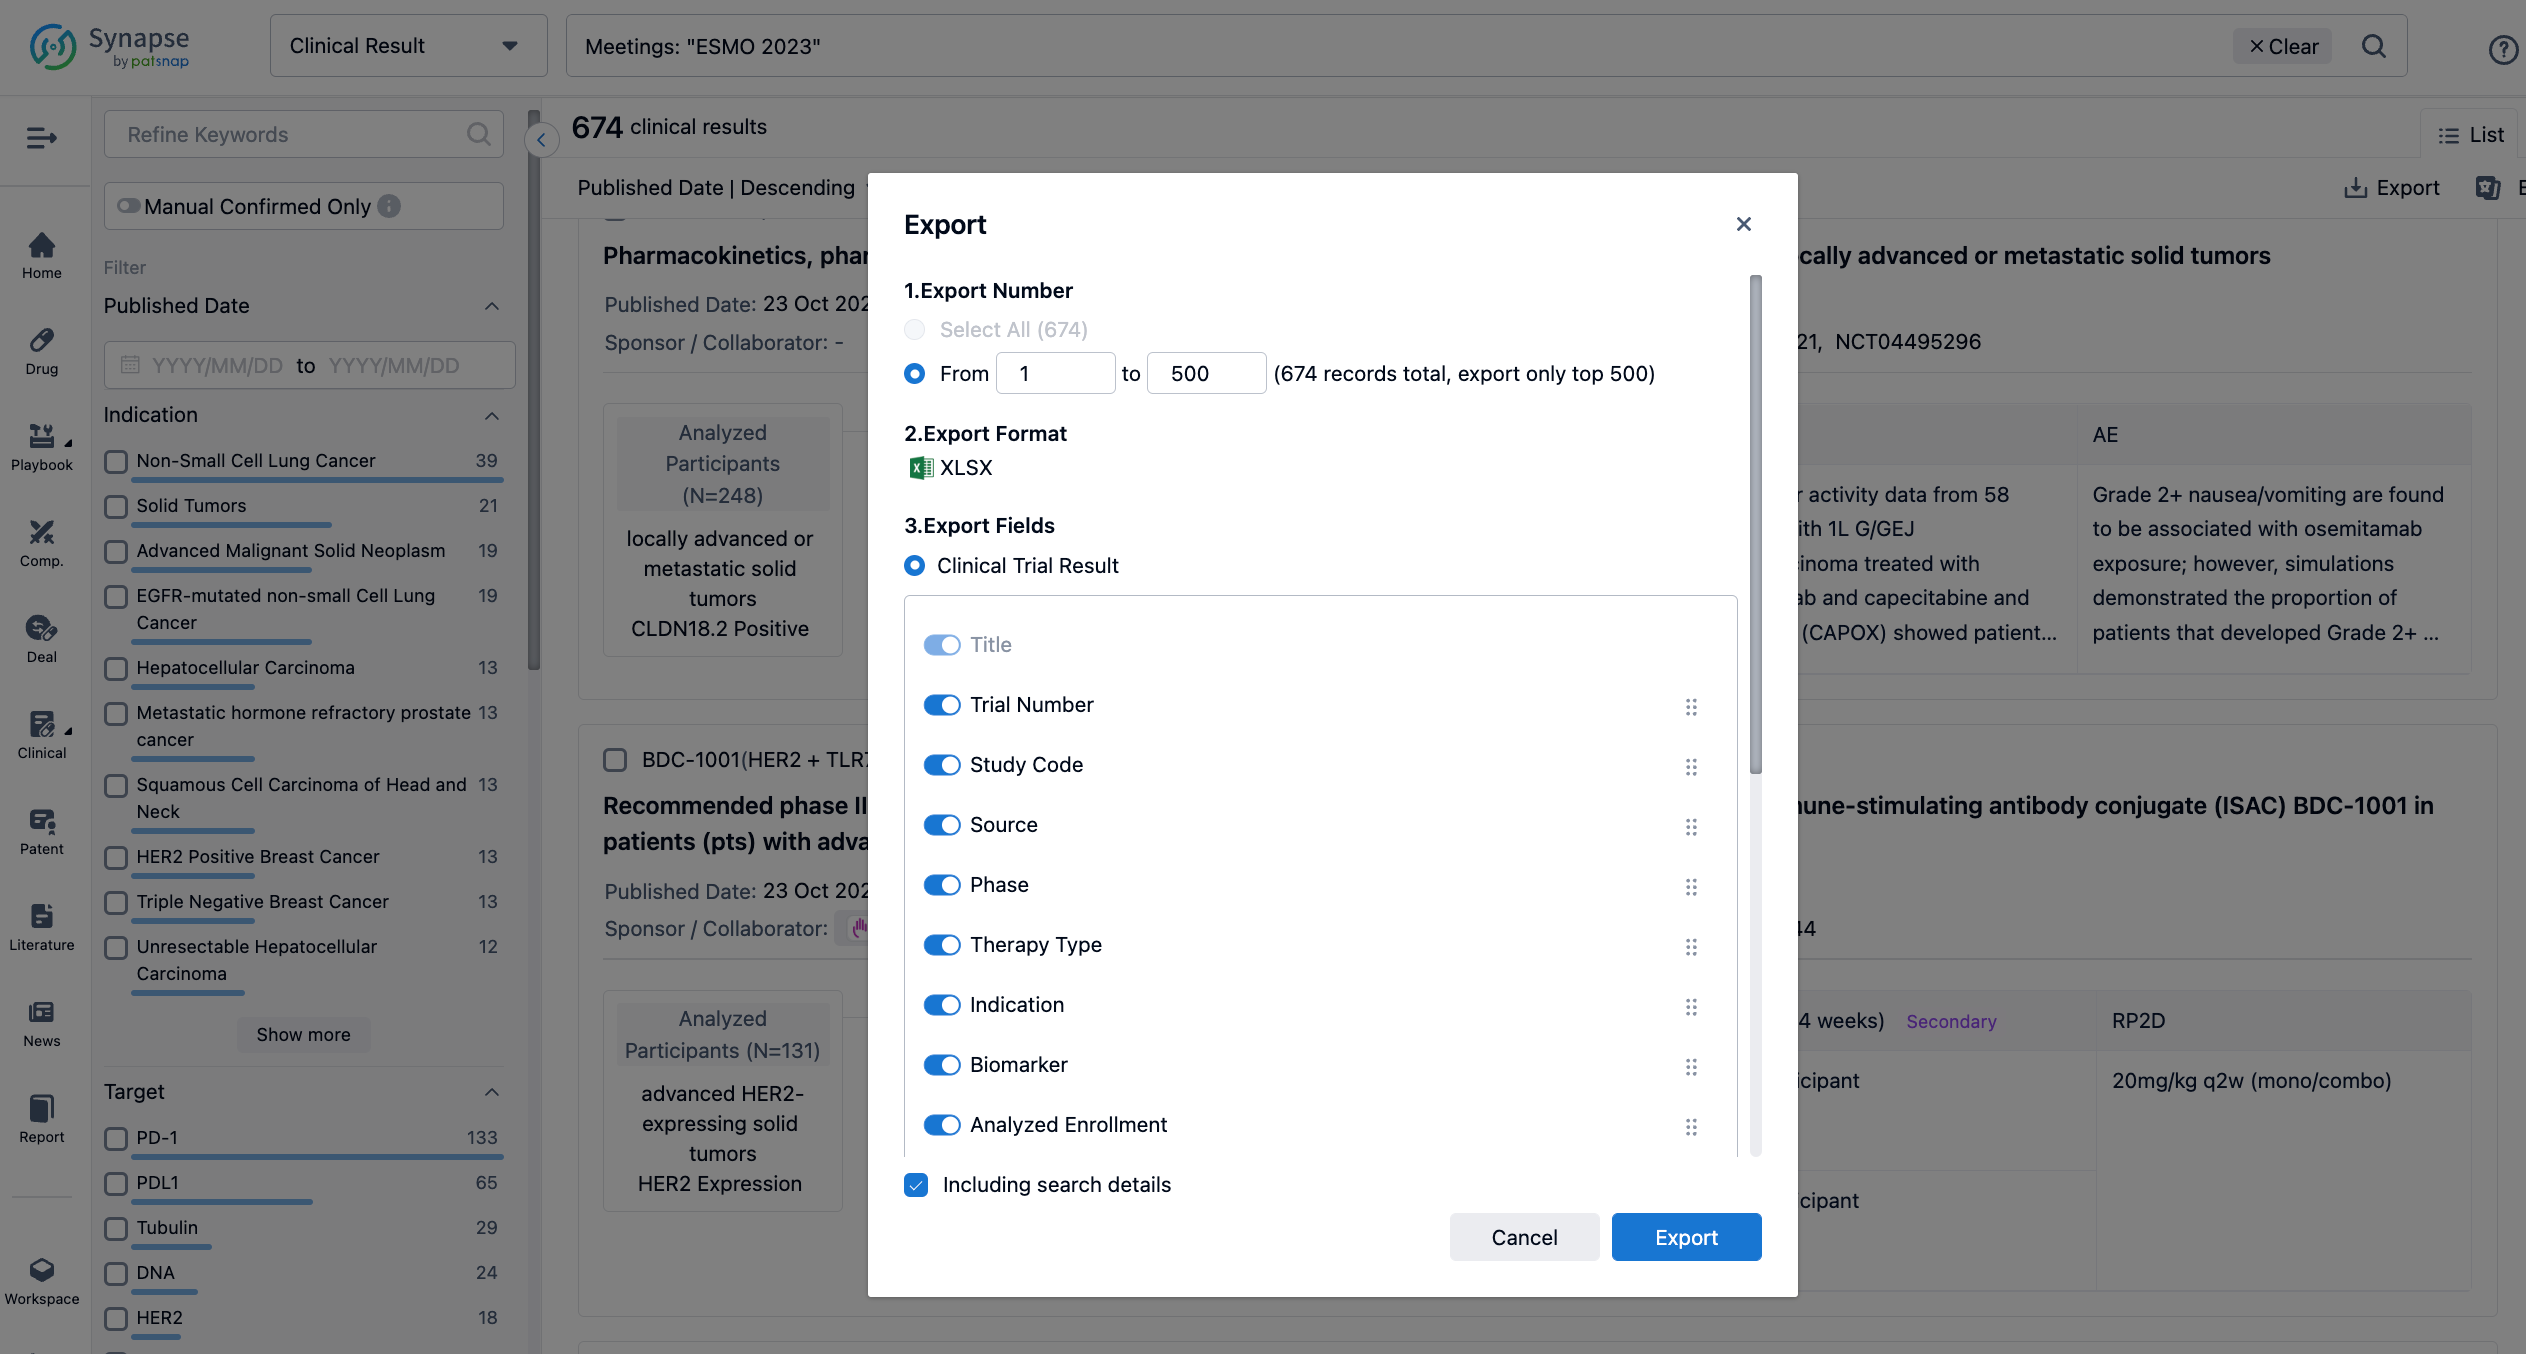
Finally, if you need to download these results, you can conveniently check the check boxes on the left side of the list, or directly click the "Export" button to download the data for personalized analysis and file sharing.
Click on the image below to embark on a brand new journey of drug discovery!
