How to quickly read pharmaceutical company financial reports?
The financial reports of pharmaceutical companies provide insights into the progress of corporate R&D investments, industry trends, market dynamics, and the overall health of the pharmaceutical industry. As we are currently in the Q2 earnings season, this article will use Pfizer as an example to teach you how to quickly learn to read Pharma/Biotech financial reports.
When and where to find financial reports?
Typically, companies announce the specific dates for their earnings release approximately one month after the end of each quarter. However, there are occasions when the actual release date may differ from the announced date.
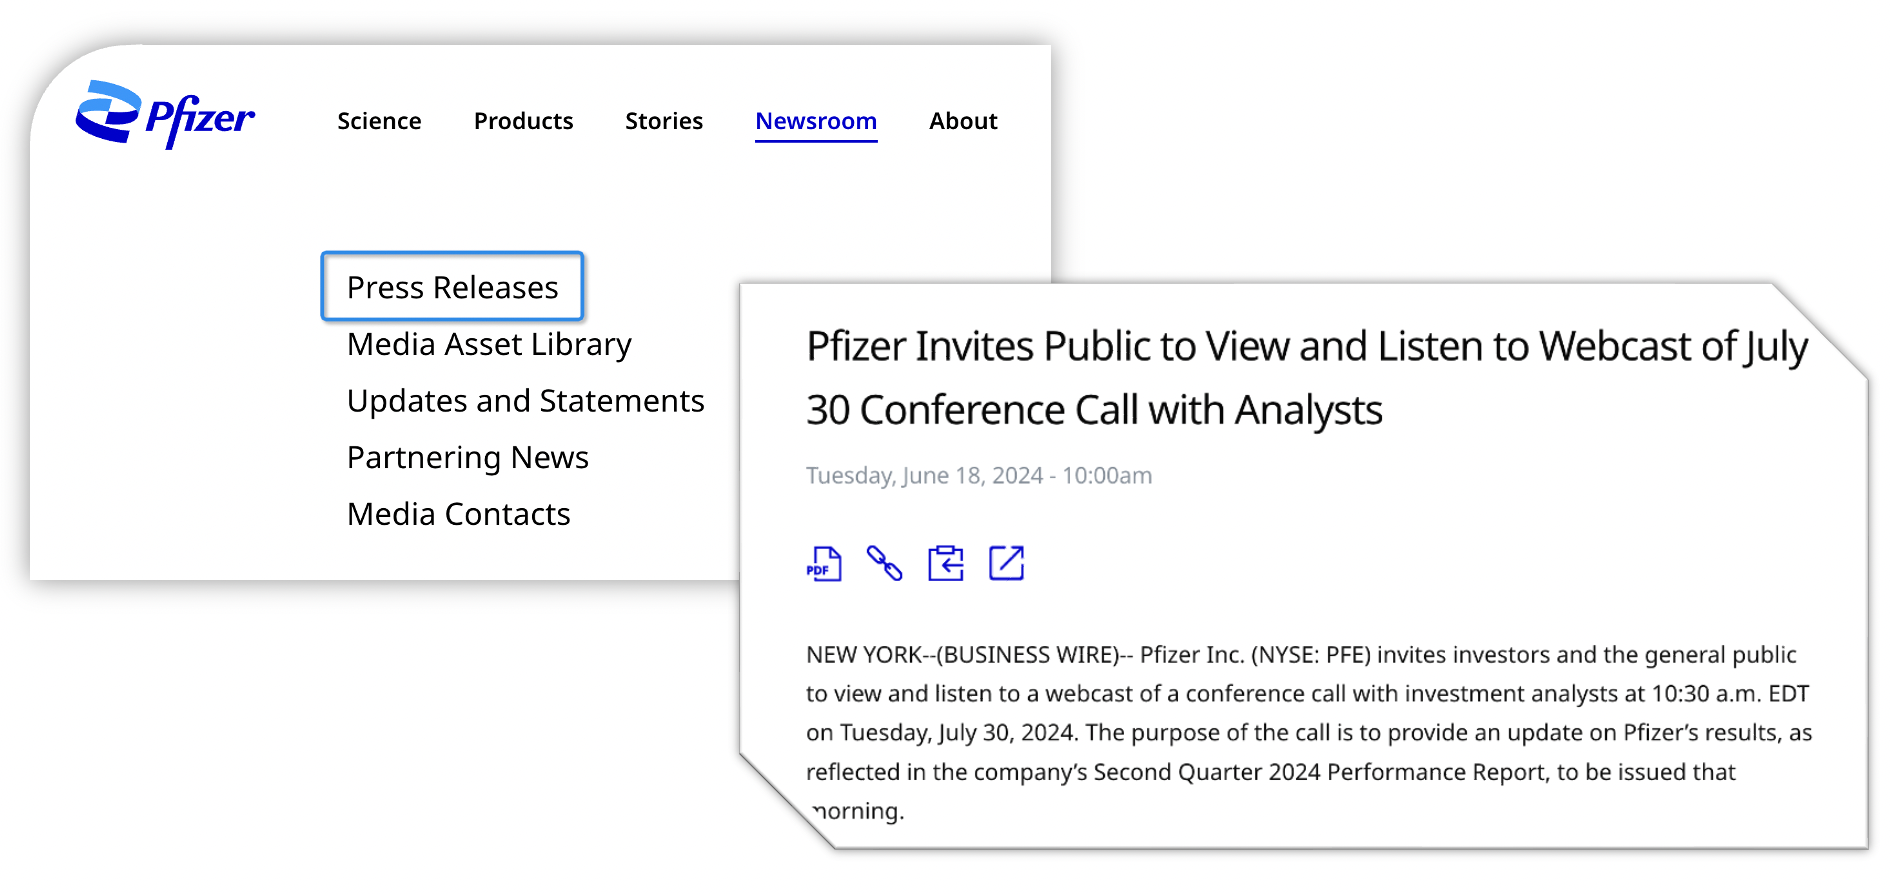
To find this information, you can visit the official company website. Generally, companies will announce the timing of their earnings disclosures under the "Press Release" or "Media/News Release" sections of their site.
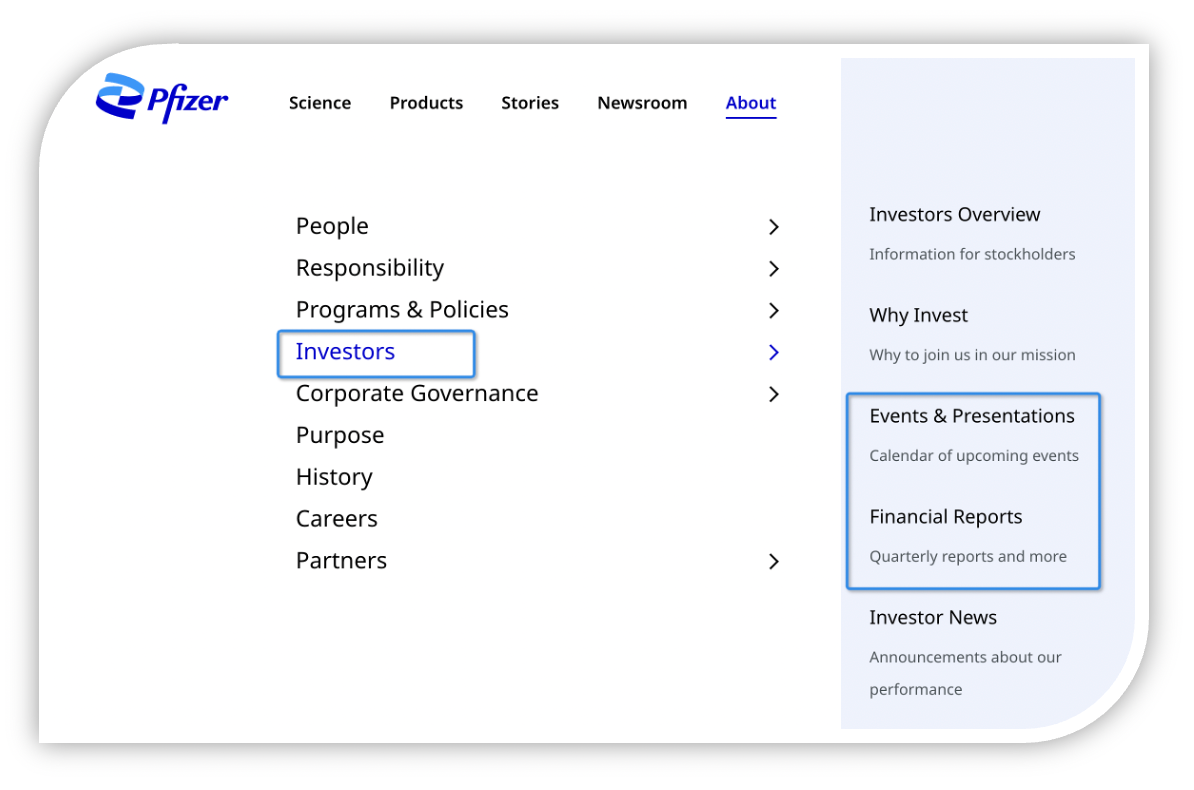
On the day of the financial report, visit the official website and look under the "Investors" section. Here, you can find the report in either the "Events and Presentations" or "Financial Reports" subsections.
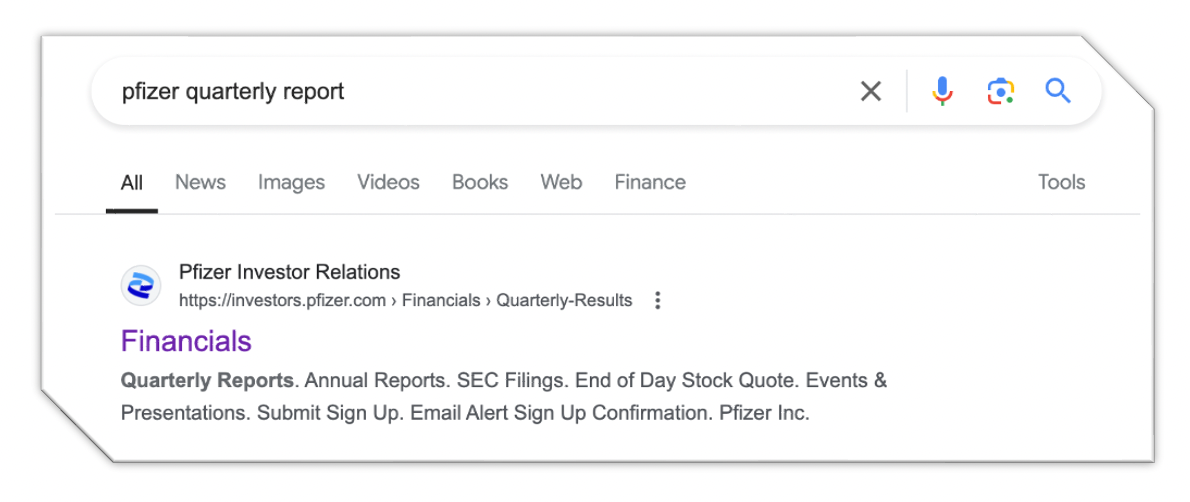
Alternatively, you can directly find the related web pages via a search engine by using the following search format: "Company Name + Quarterly Report".
What information can be obtained from the official website's performance report?
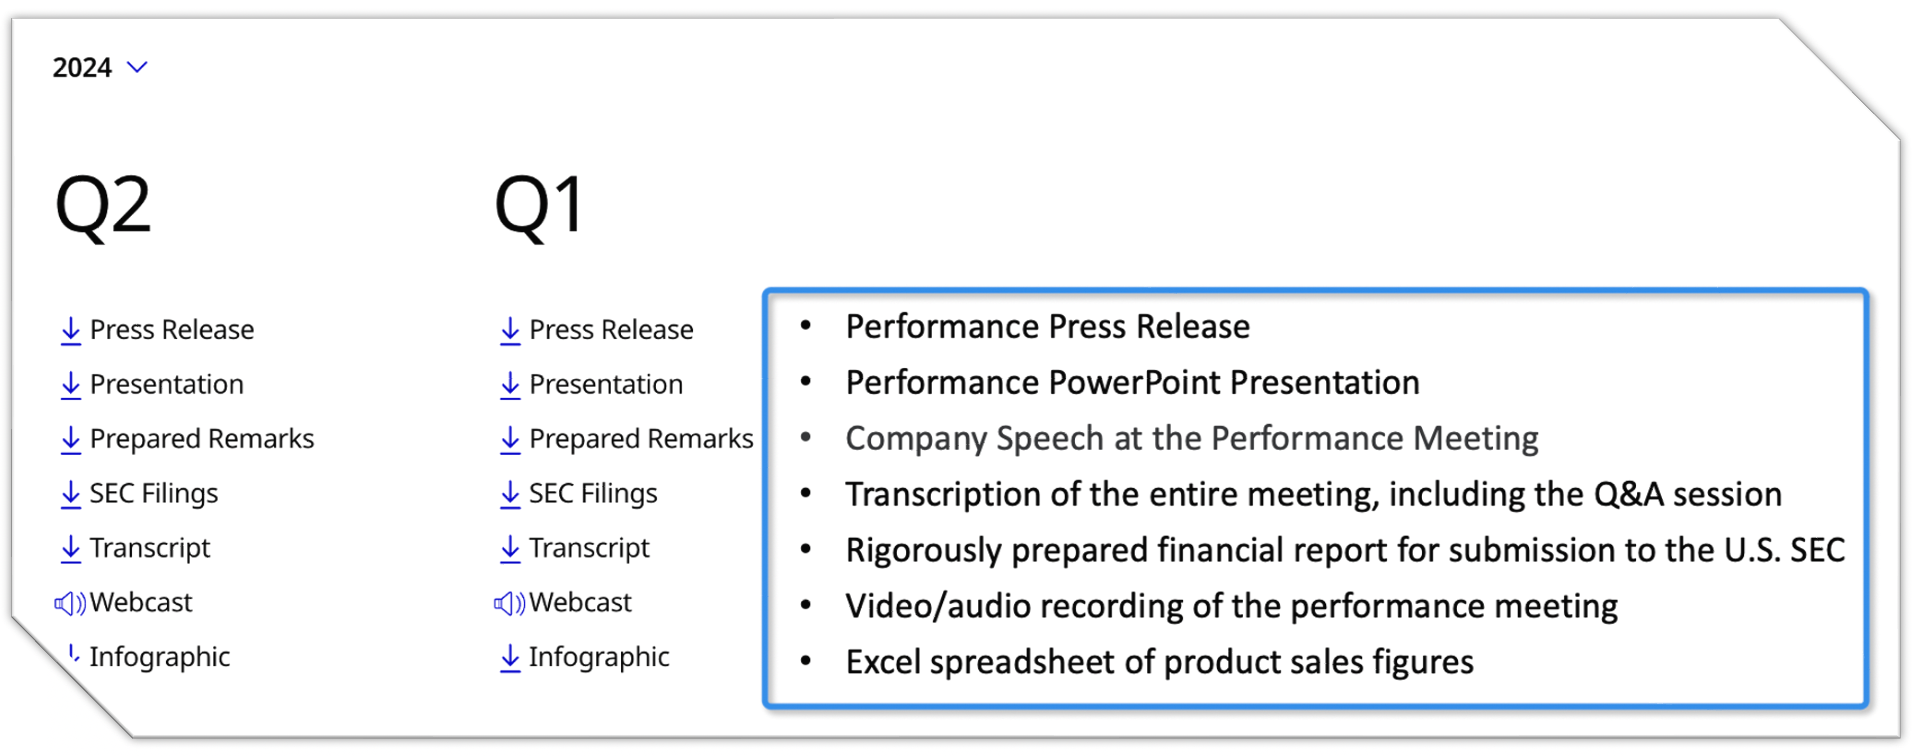
If you just want a quick overview of the company's core business performance for the last quarter, reviewing the Press Release and PowerPoint presentation would suffice.
The Press Release is the fastest and simplest way to obtain the key information from the financial report, essentially listing the financial items and research and development details most concerning to investors. For more detailed information, refer to the SEC Filing.
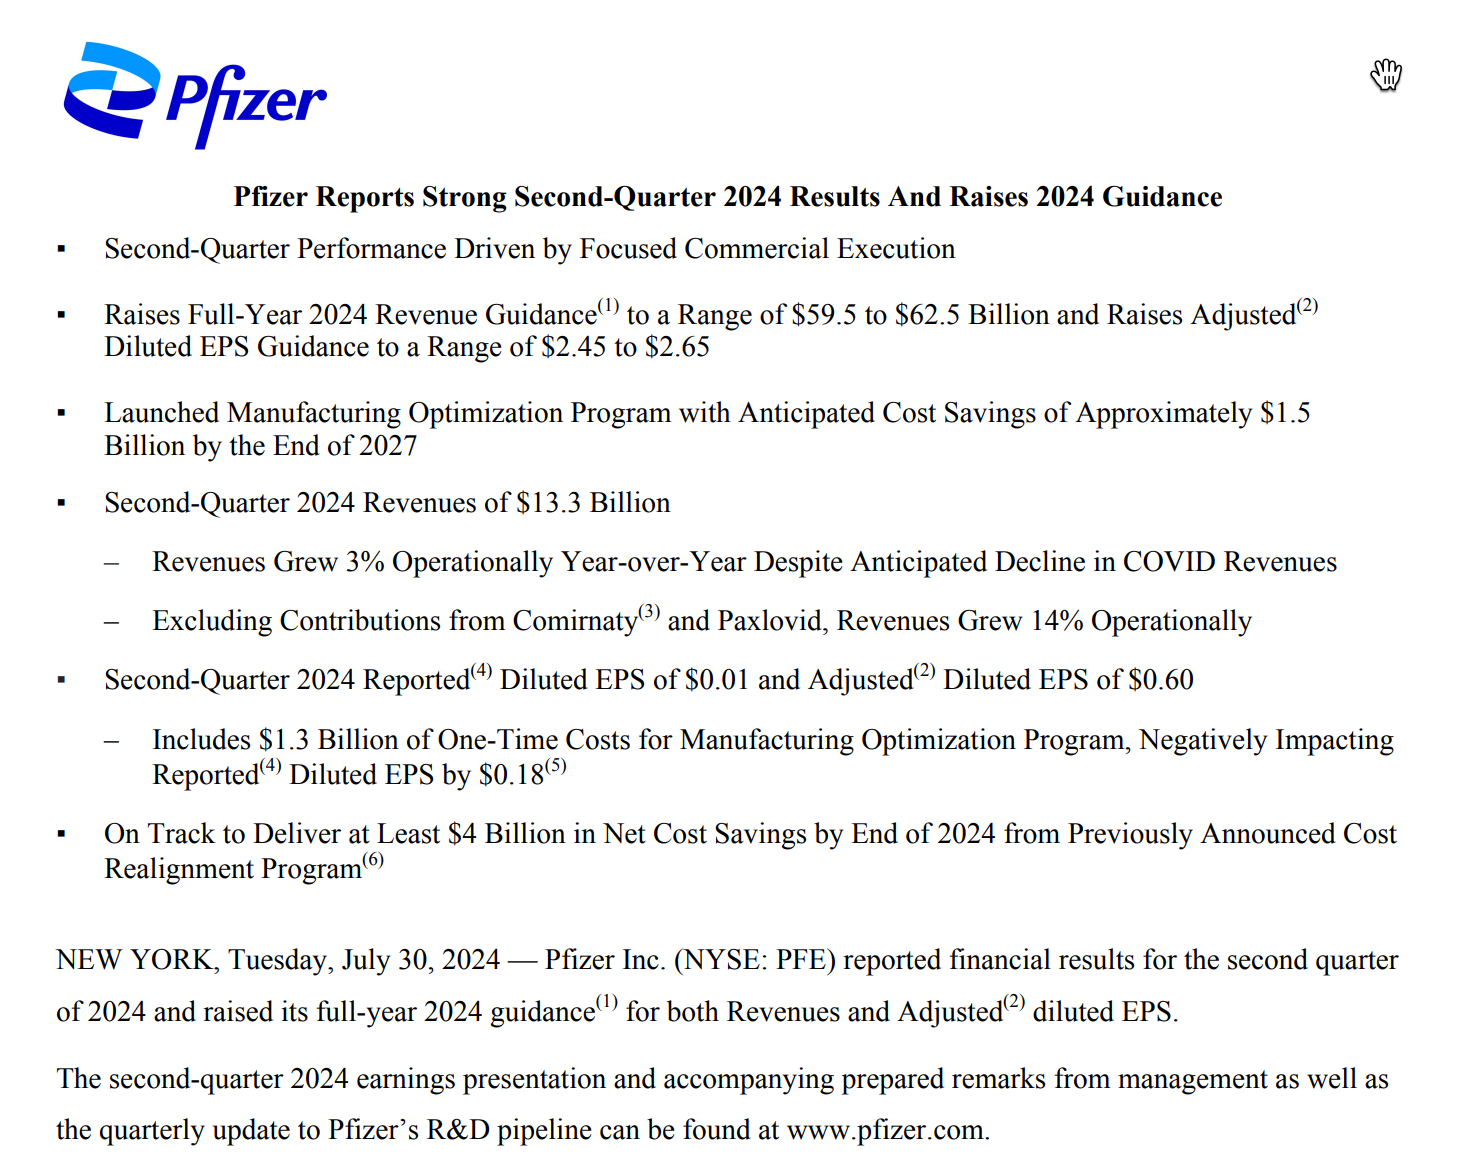
The first paragraph of a typical Press Release is an overview, including information on revenue and profits, annual performance guidance, and the most important research and development progress.
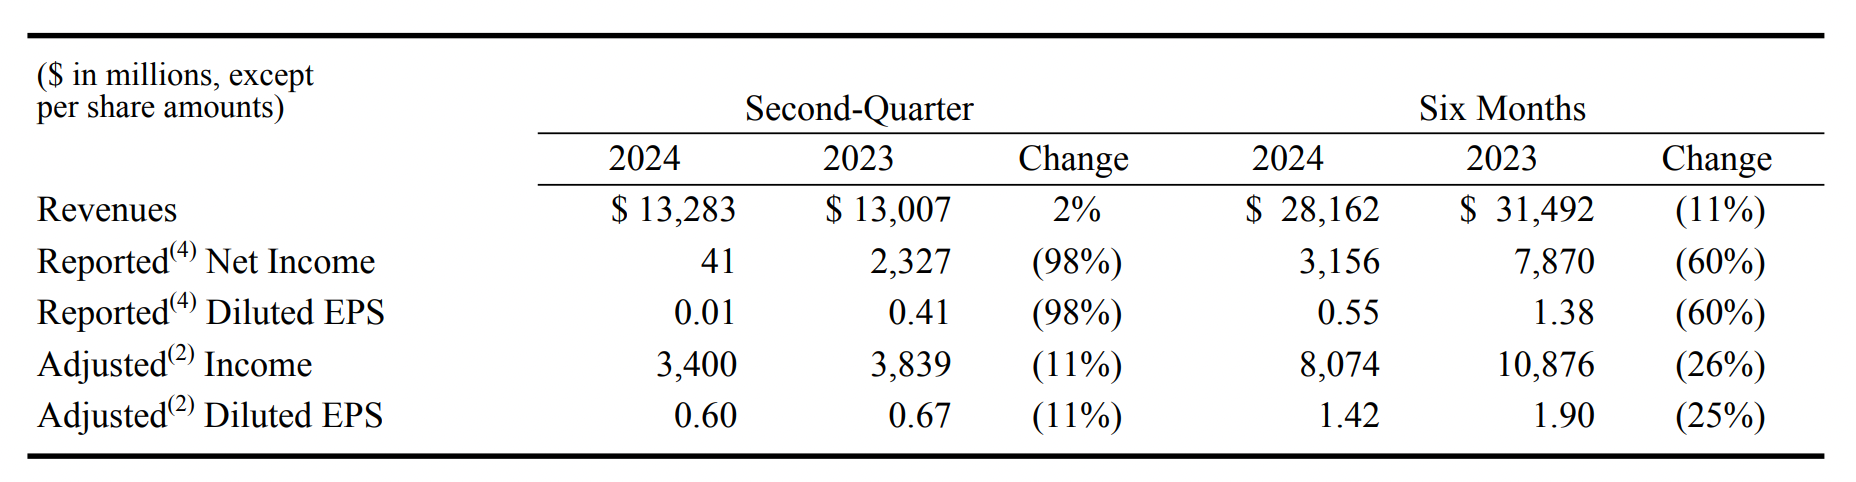
Overall Results
The key figures include revenue, net income, and EPS (earnings per share), with net income and EPS further divided into GAAP and NON-GAAP (adjusted) categories. In simple terms, GAAP results are calculated strictly in accordance with accounting standards, while NON-GAAP results represent "adjusted" or "non-standard" profits. The section may conclude with disclosures of significant accounting adjustments; for example, starting from 2022, the company is required to account for the expenditures of the BD project under R&D, classifying them as IPR&D (IP = in process).
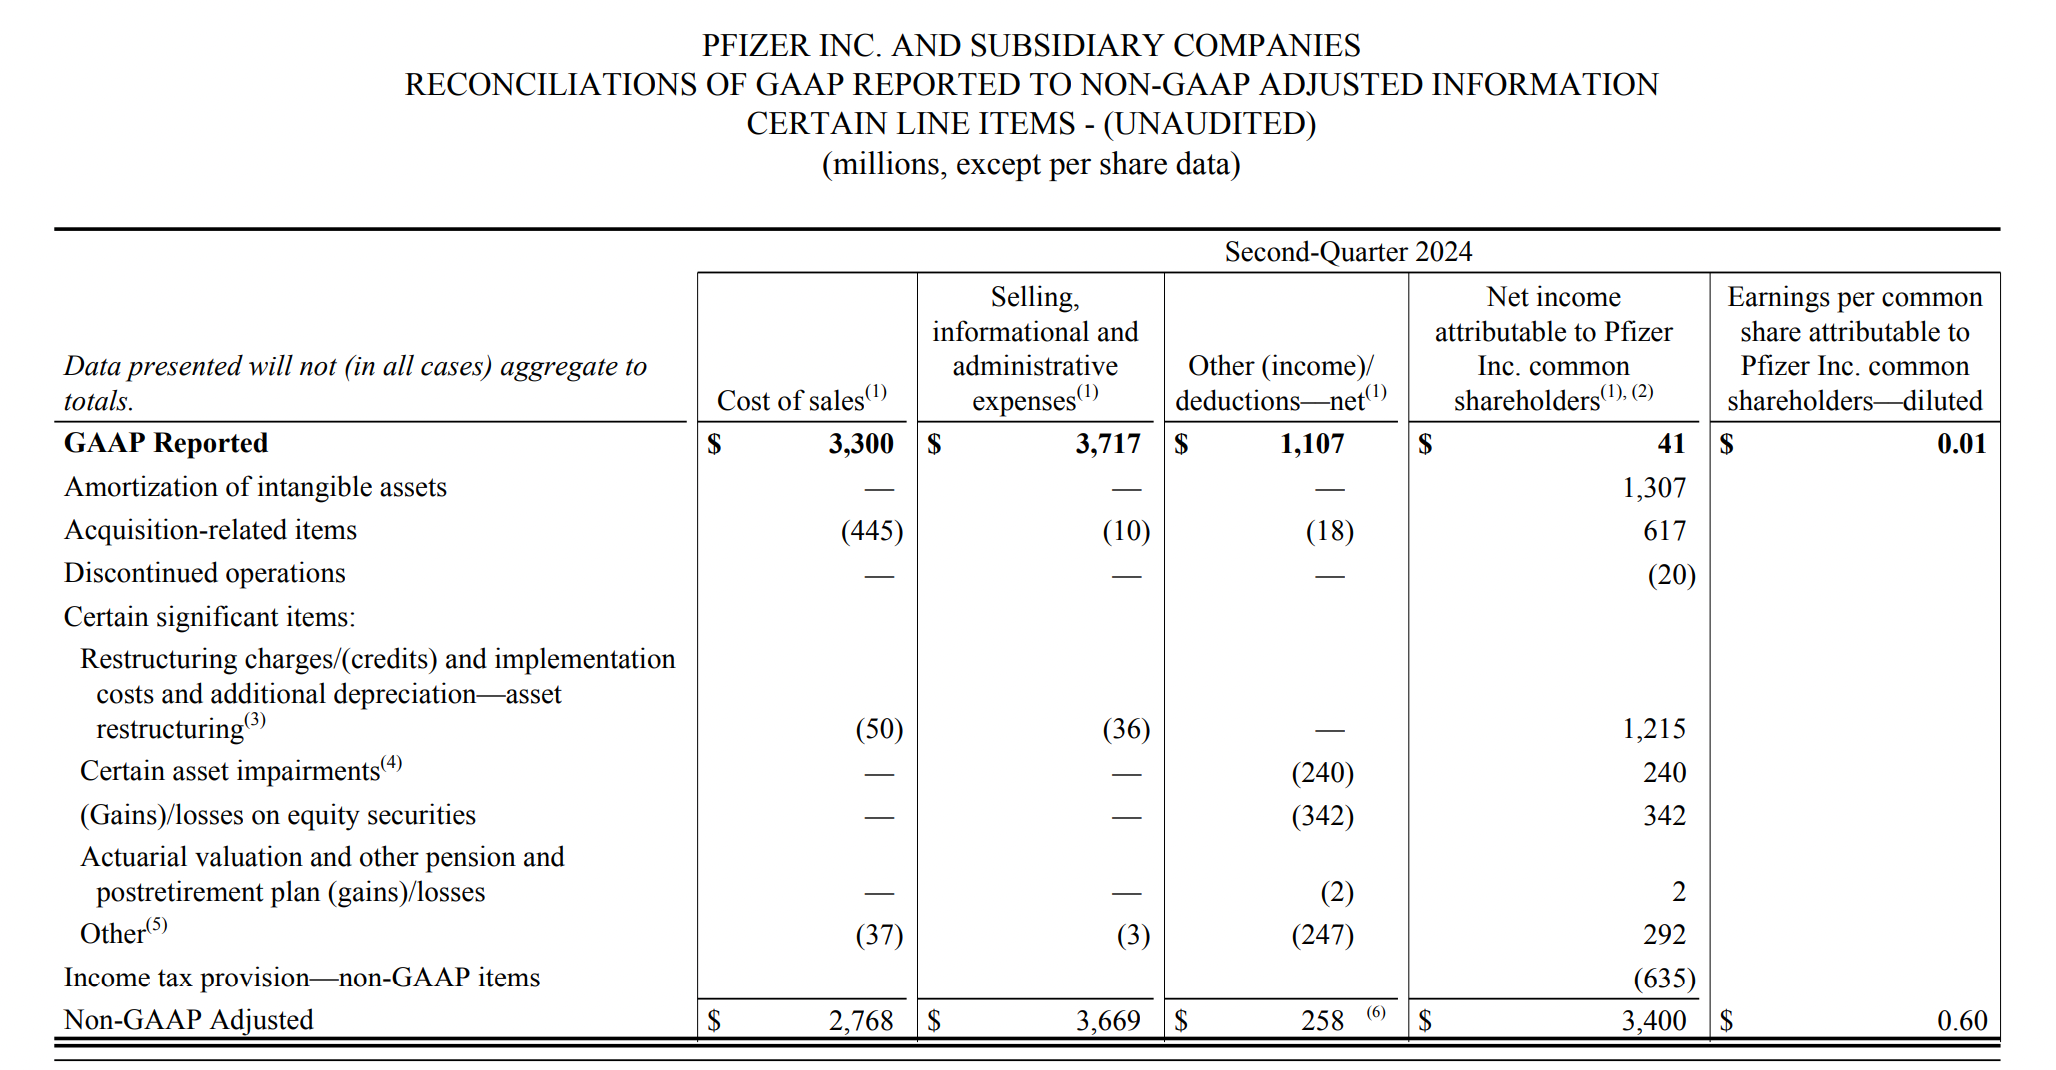
The specific items adjusted for NON-GAAP may vary each quarter. Typically, the process of adjusting from GAAP to NON-GAAP can be found at the end of the document or in the SEC Filings.
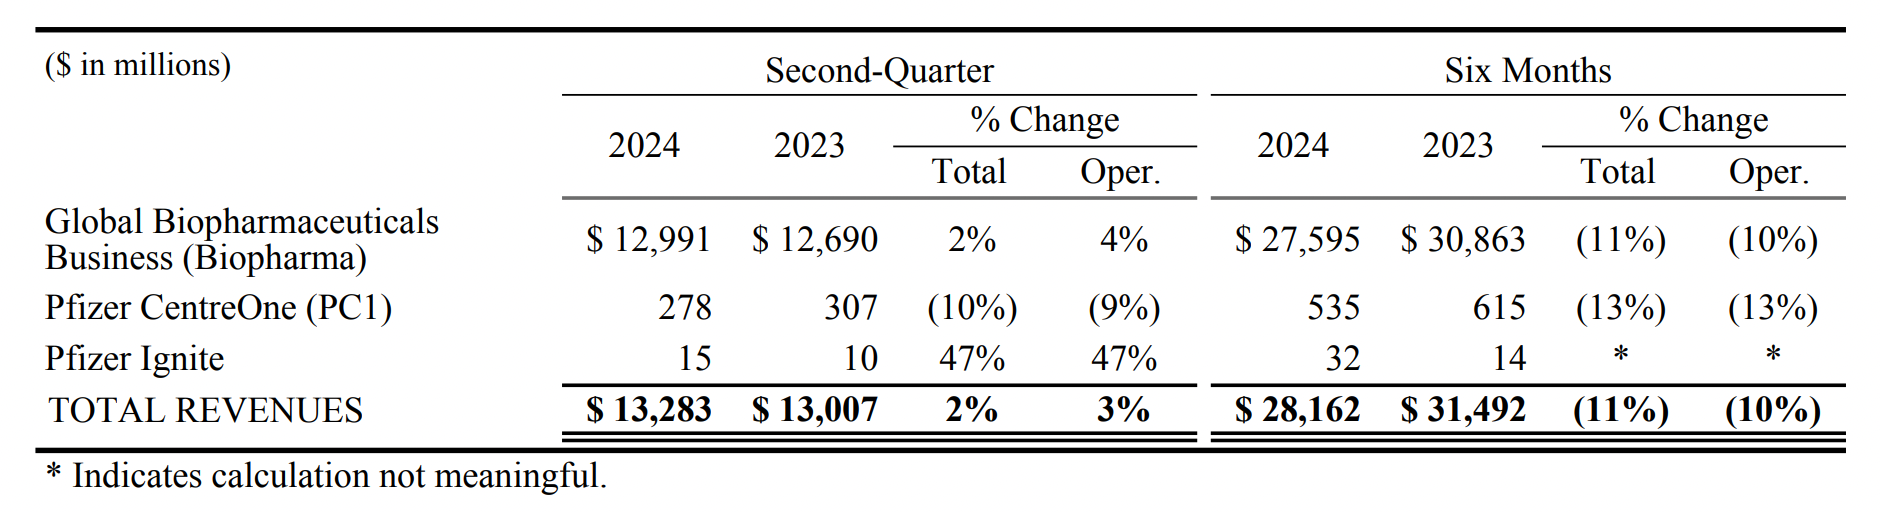
Revenue Structure
This section outlines the composition of sales revenue, which is generally categorized by major product types. Due to the extensive range of products, some companies do not list the sales figures of individual products in the main text, but include a table at the end of the document.
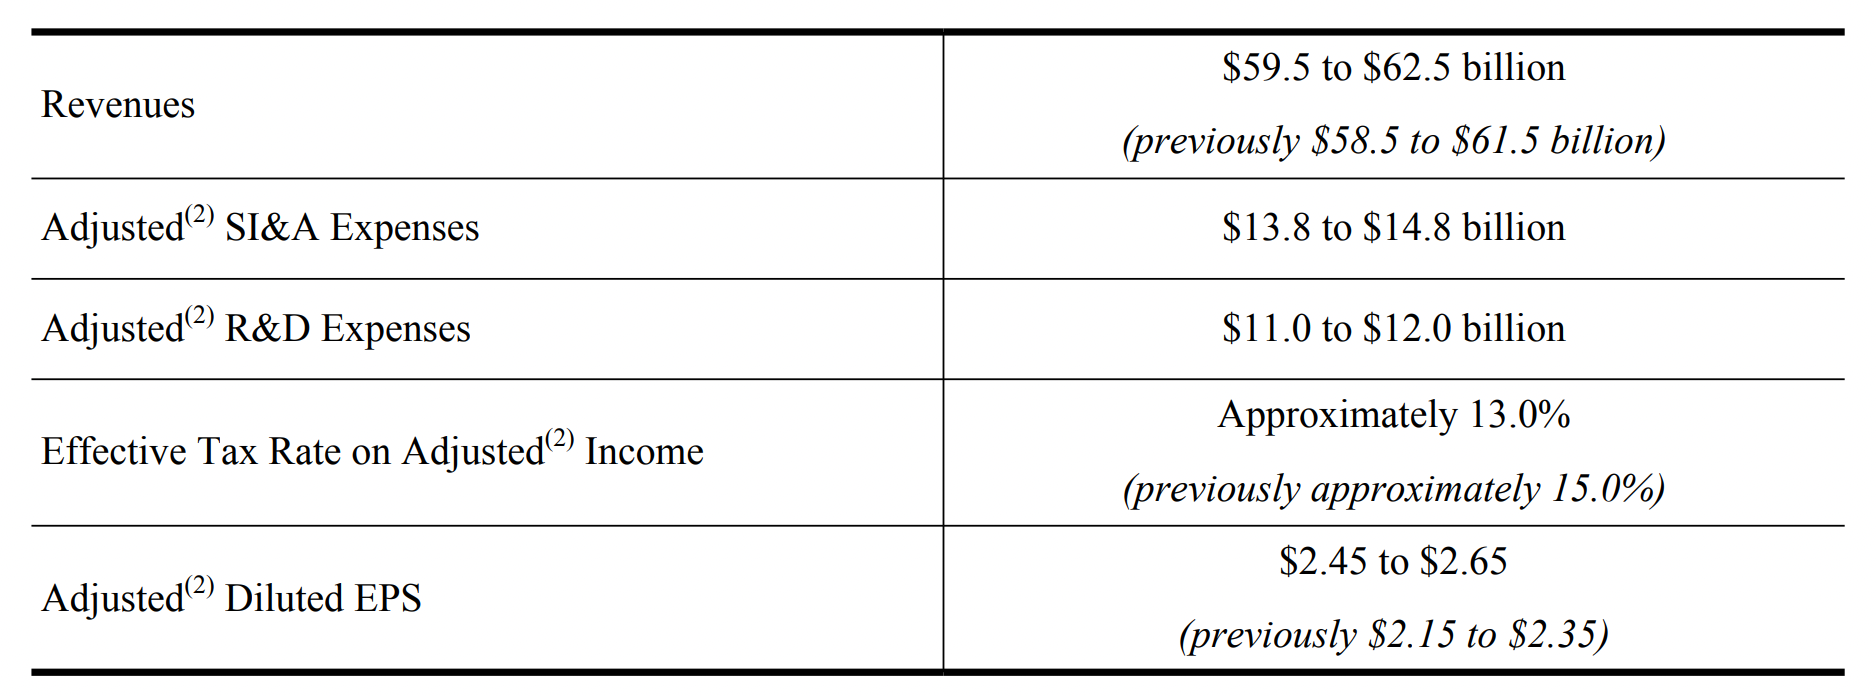
Financial Guidance
The guidance section typically lists only the core data from the income statement, such as revenue, profit, and expenses. Since the full-year performance guidance is an estimated value, it may change based on actual circumstances. Therefore, the company provides a range, along with the guidance issued for this quarter compared to the previous quarter, and explains the reasons for any differences.
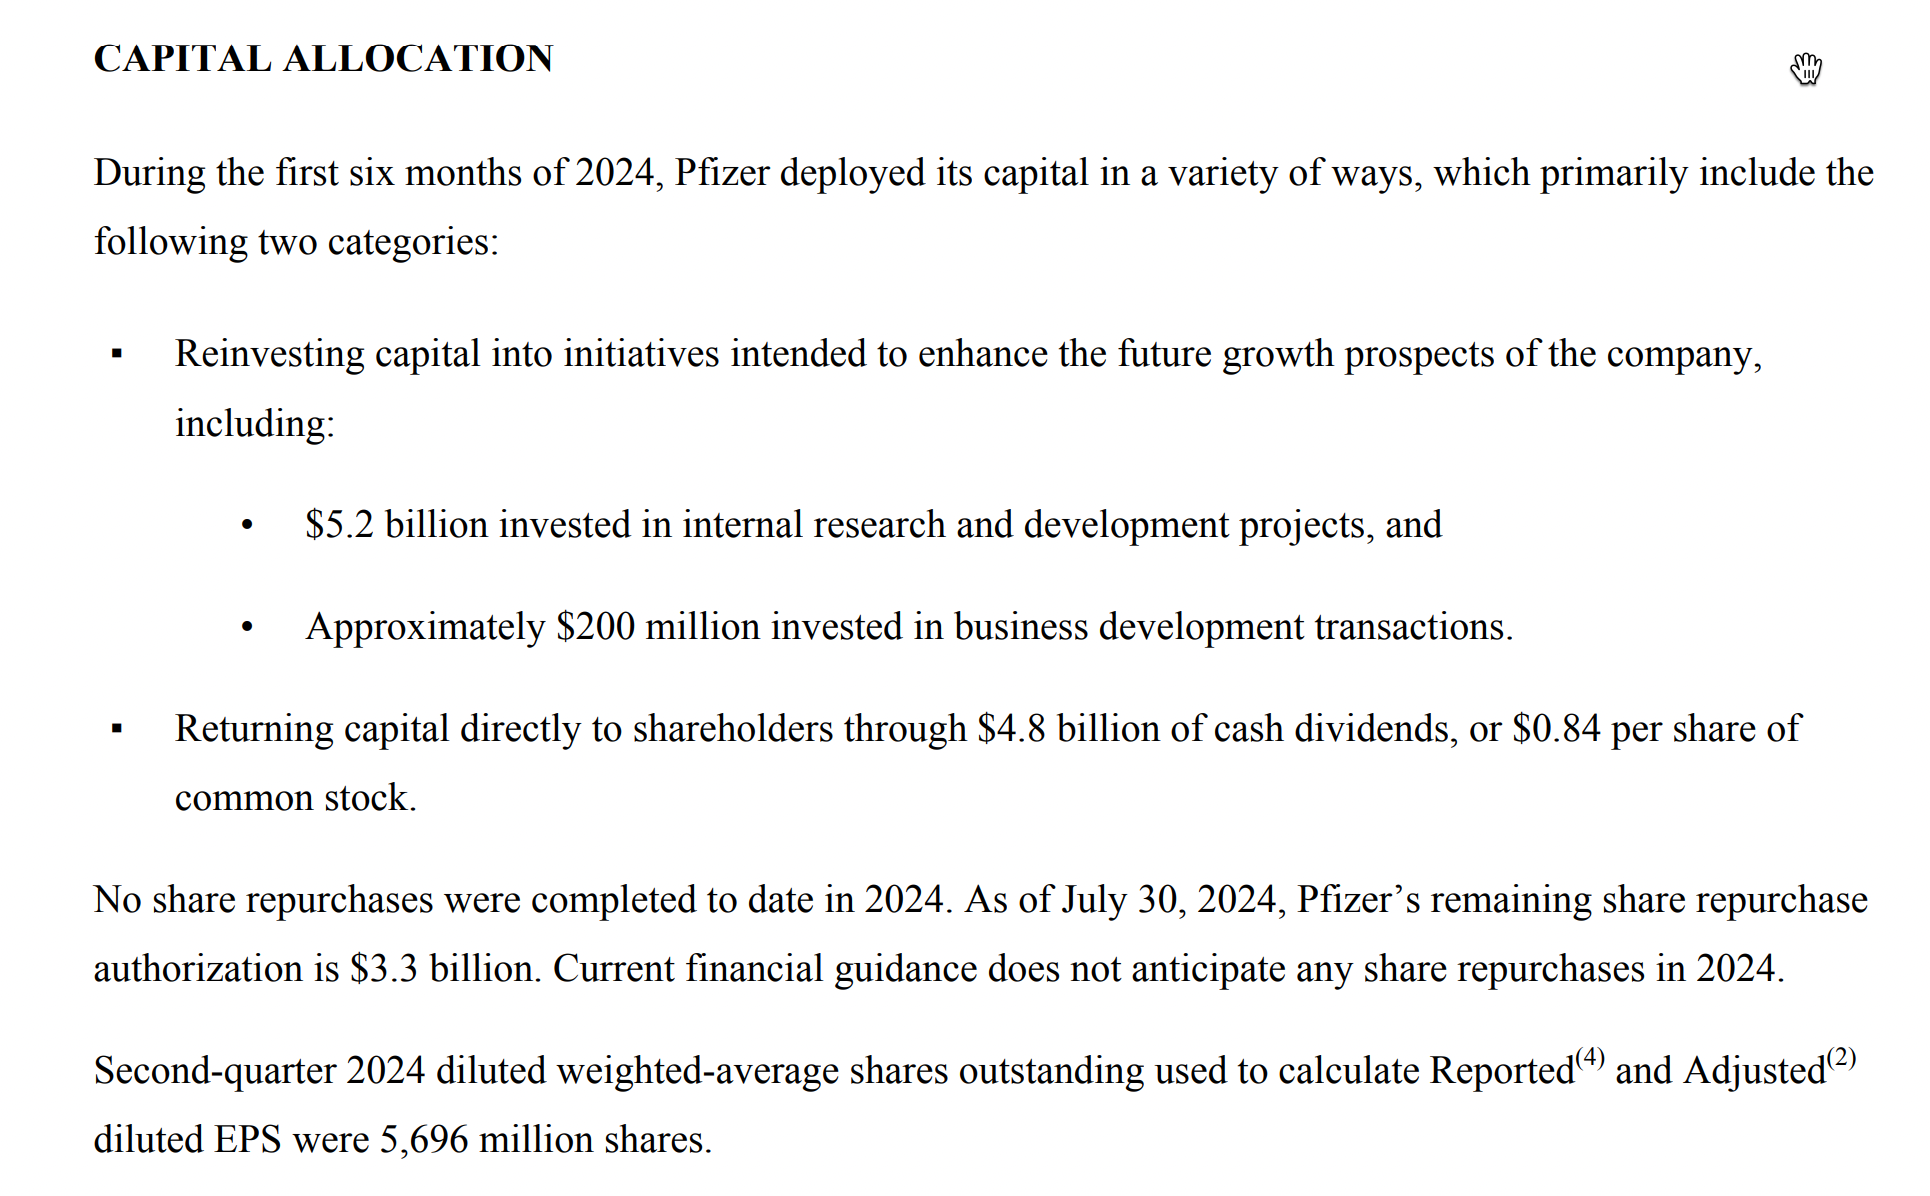
Capital allocation
Capital allocation refers to the strategies and decisions of a company regarding how it utilizes its capital resources, including cash assets, debt, and equity. Capital allocation is a crucial tool used by management to enhance value and optimize the overall worth of the company, encompassing various aspects such as investment, financing, and dividend policies.
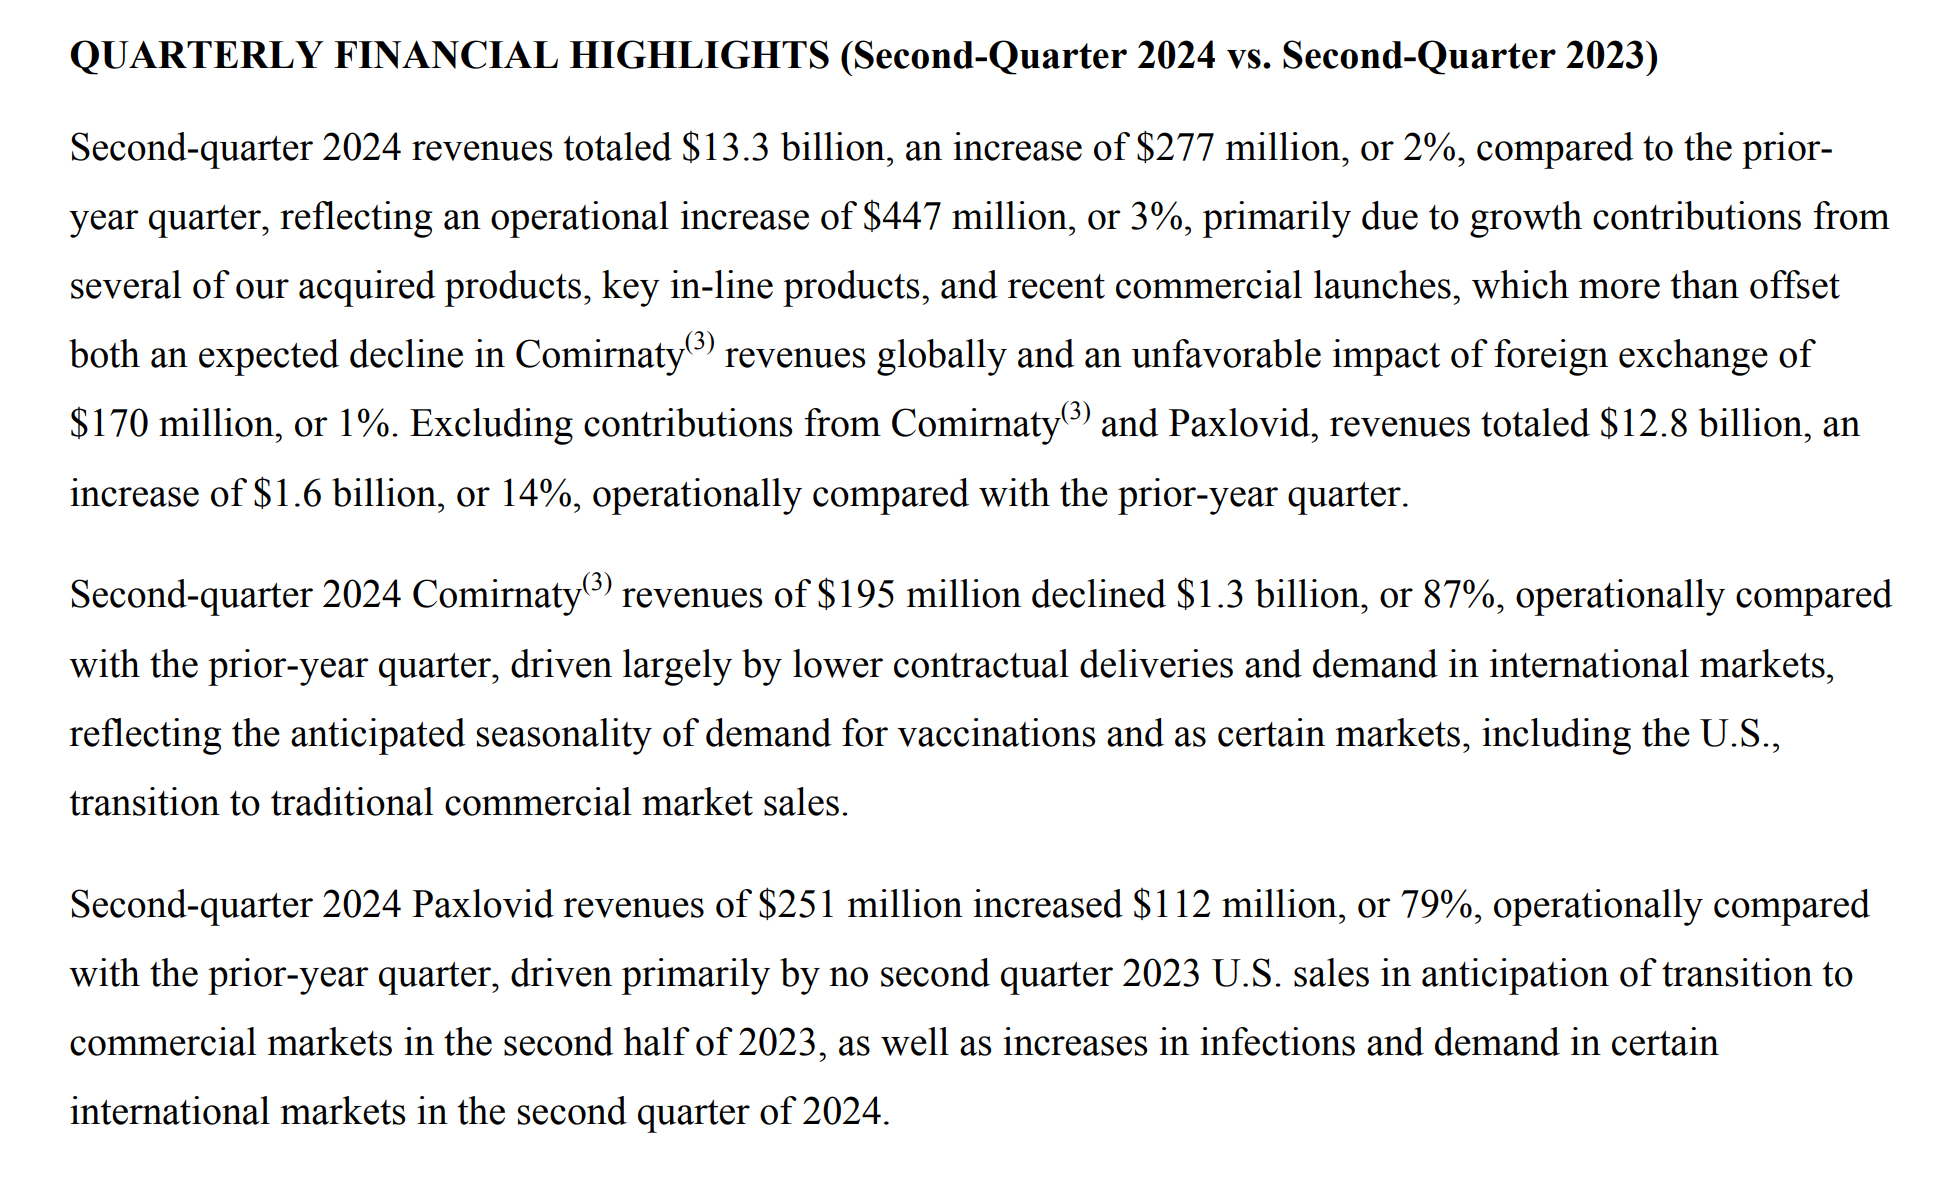
Financial Highlights
This section will focus on discussing the core drivers of performance growth, typically highlighting major categories and segments separately.
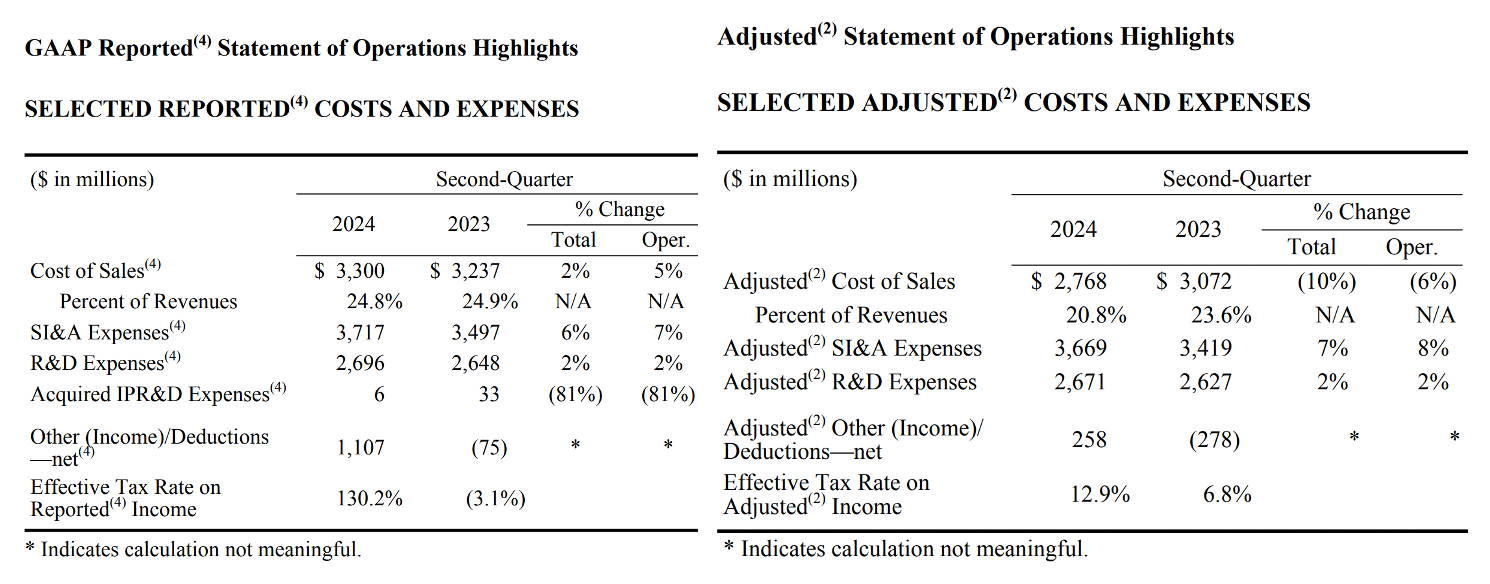
Cost & Expenses
This section is also divided into GAAP and Non-GAAP.
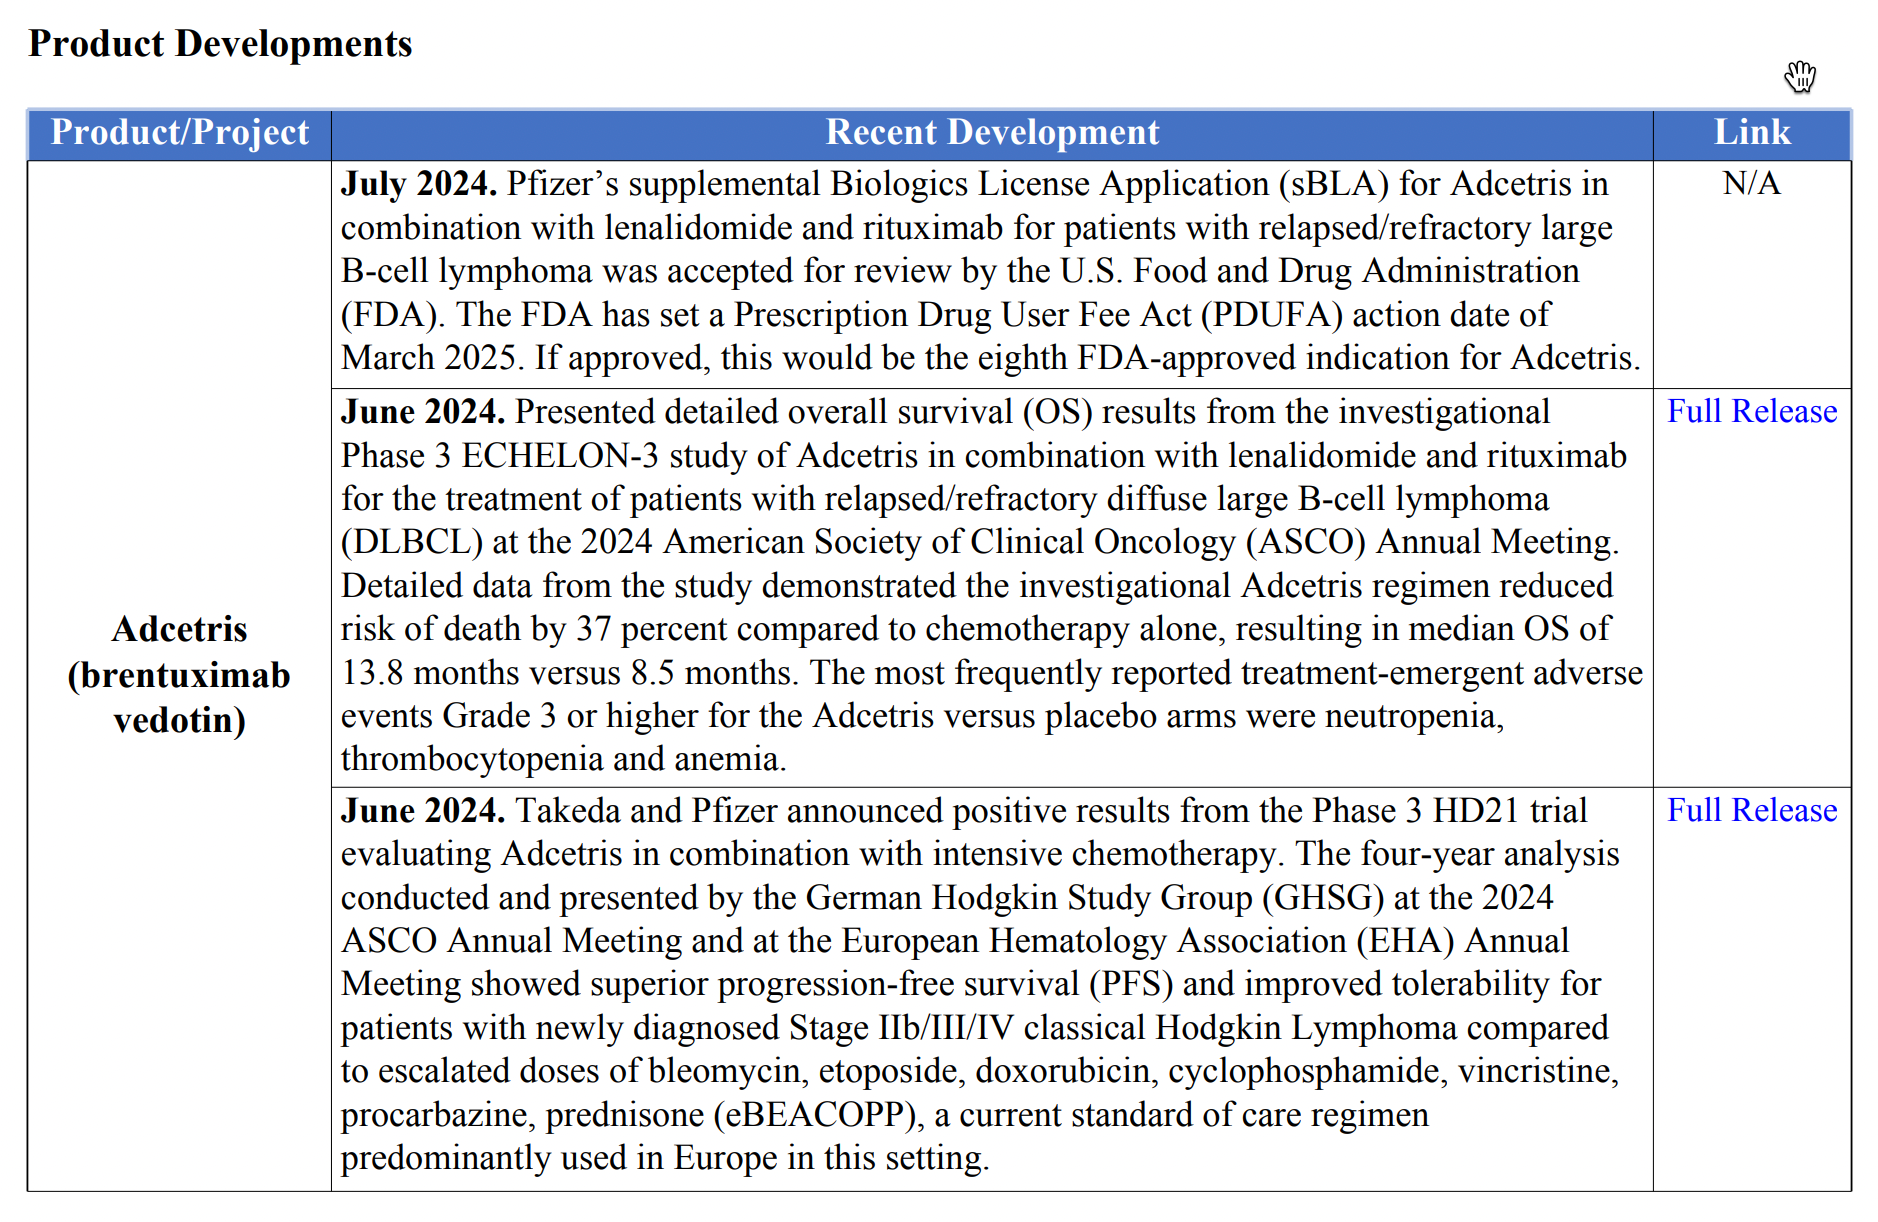
Product Development
This section mainly discusses the research and development progress of products that have already been launched, including the launch and release of new products, further expansion into new indications and regions, clinical data for new indications, and new orders signed, among others.
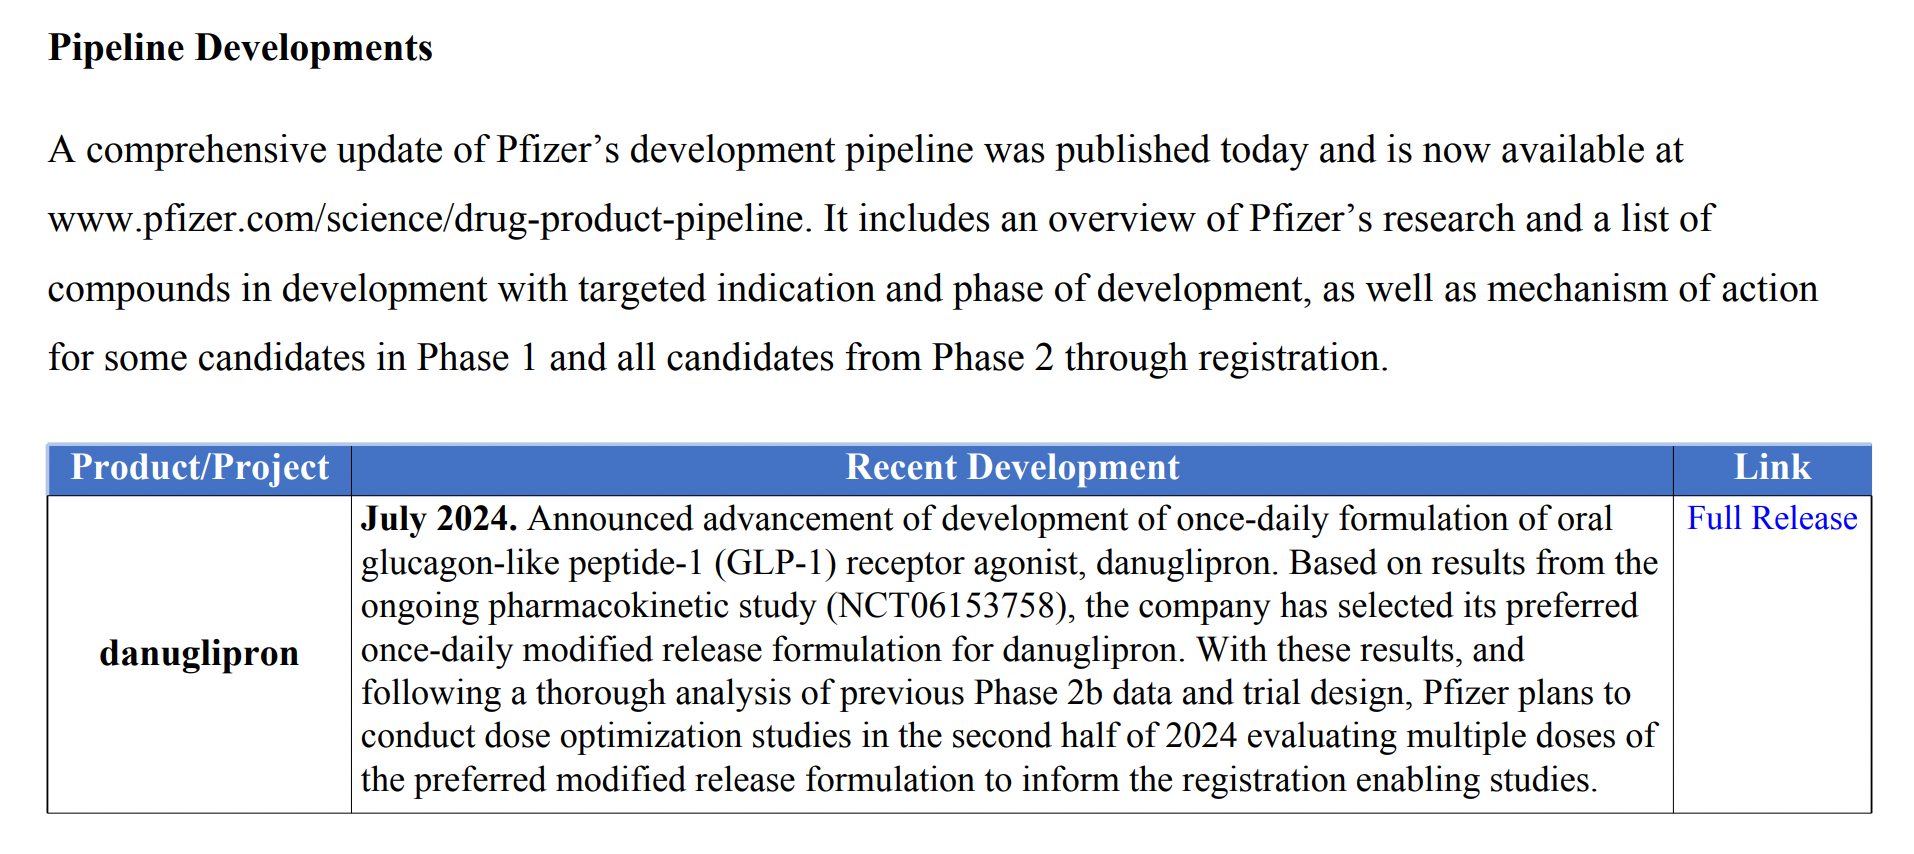
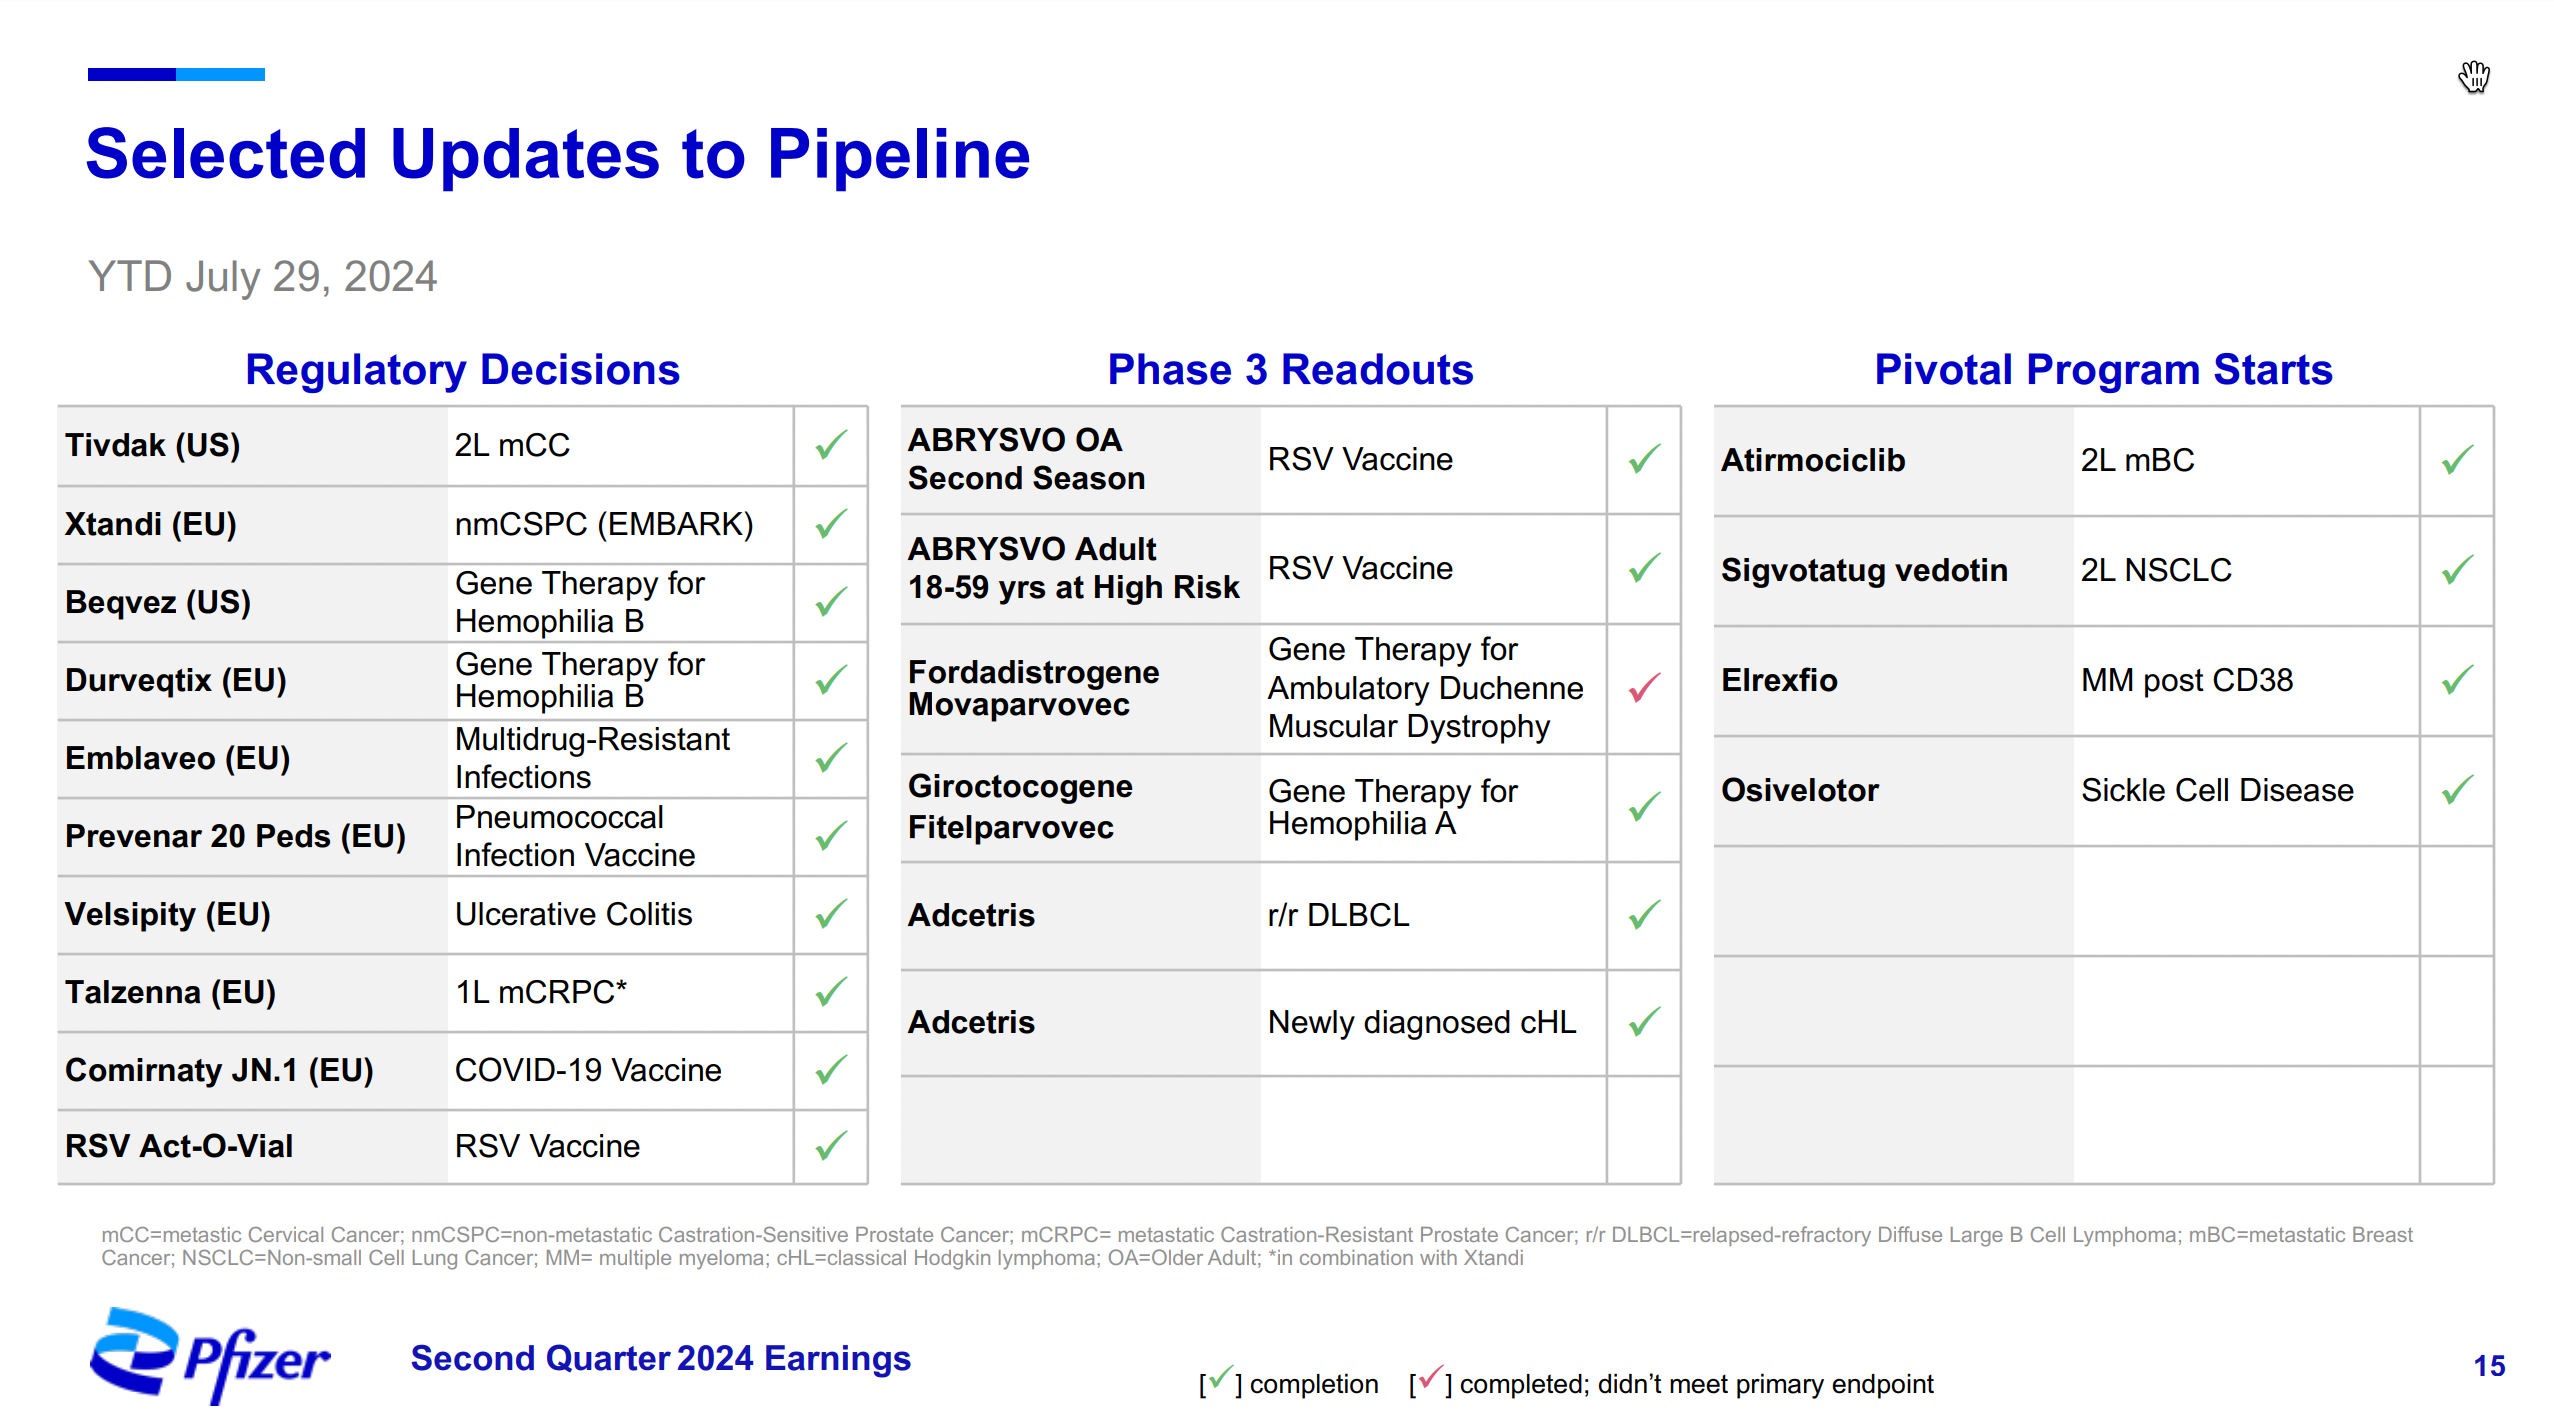
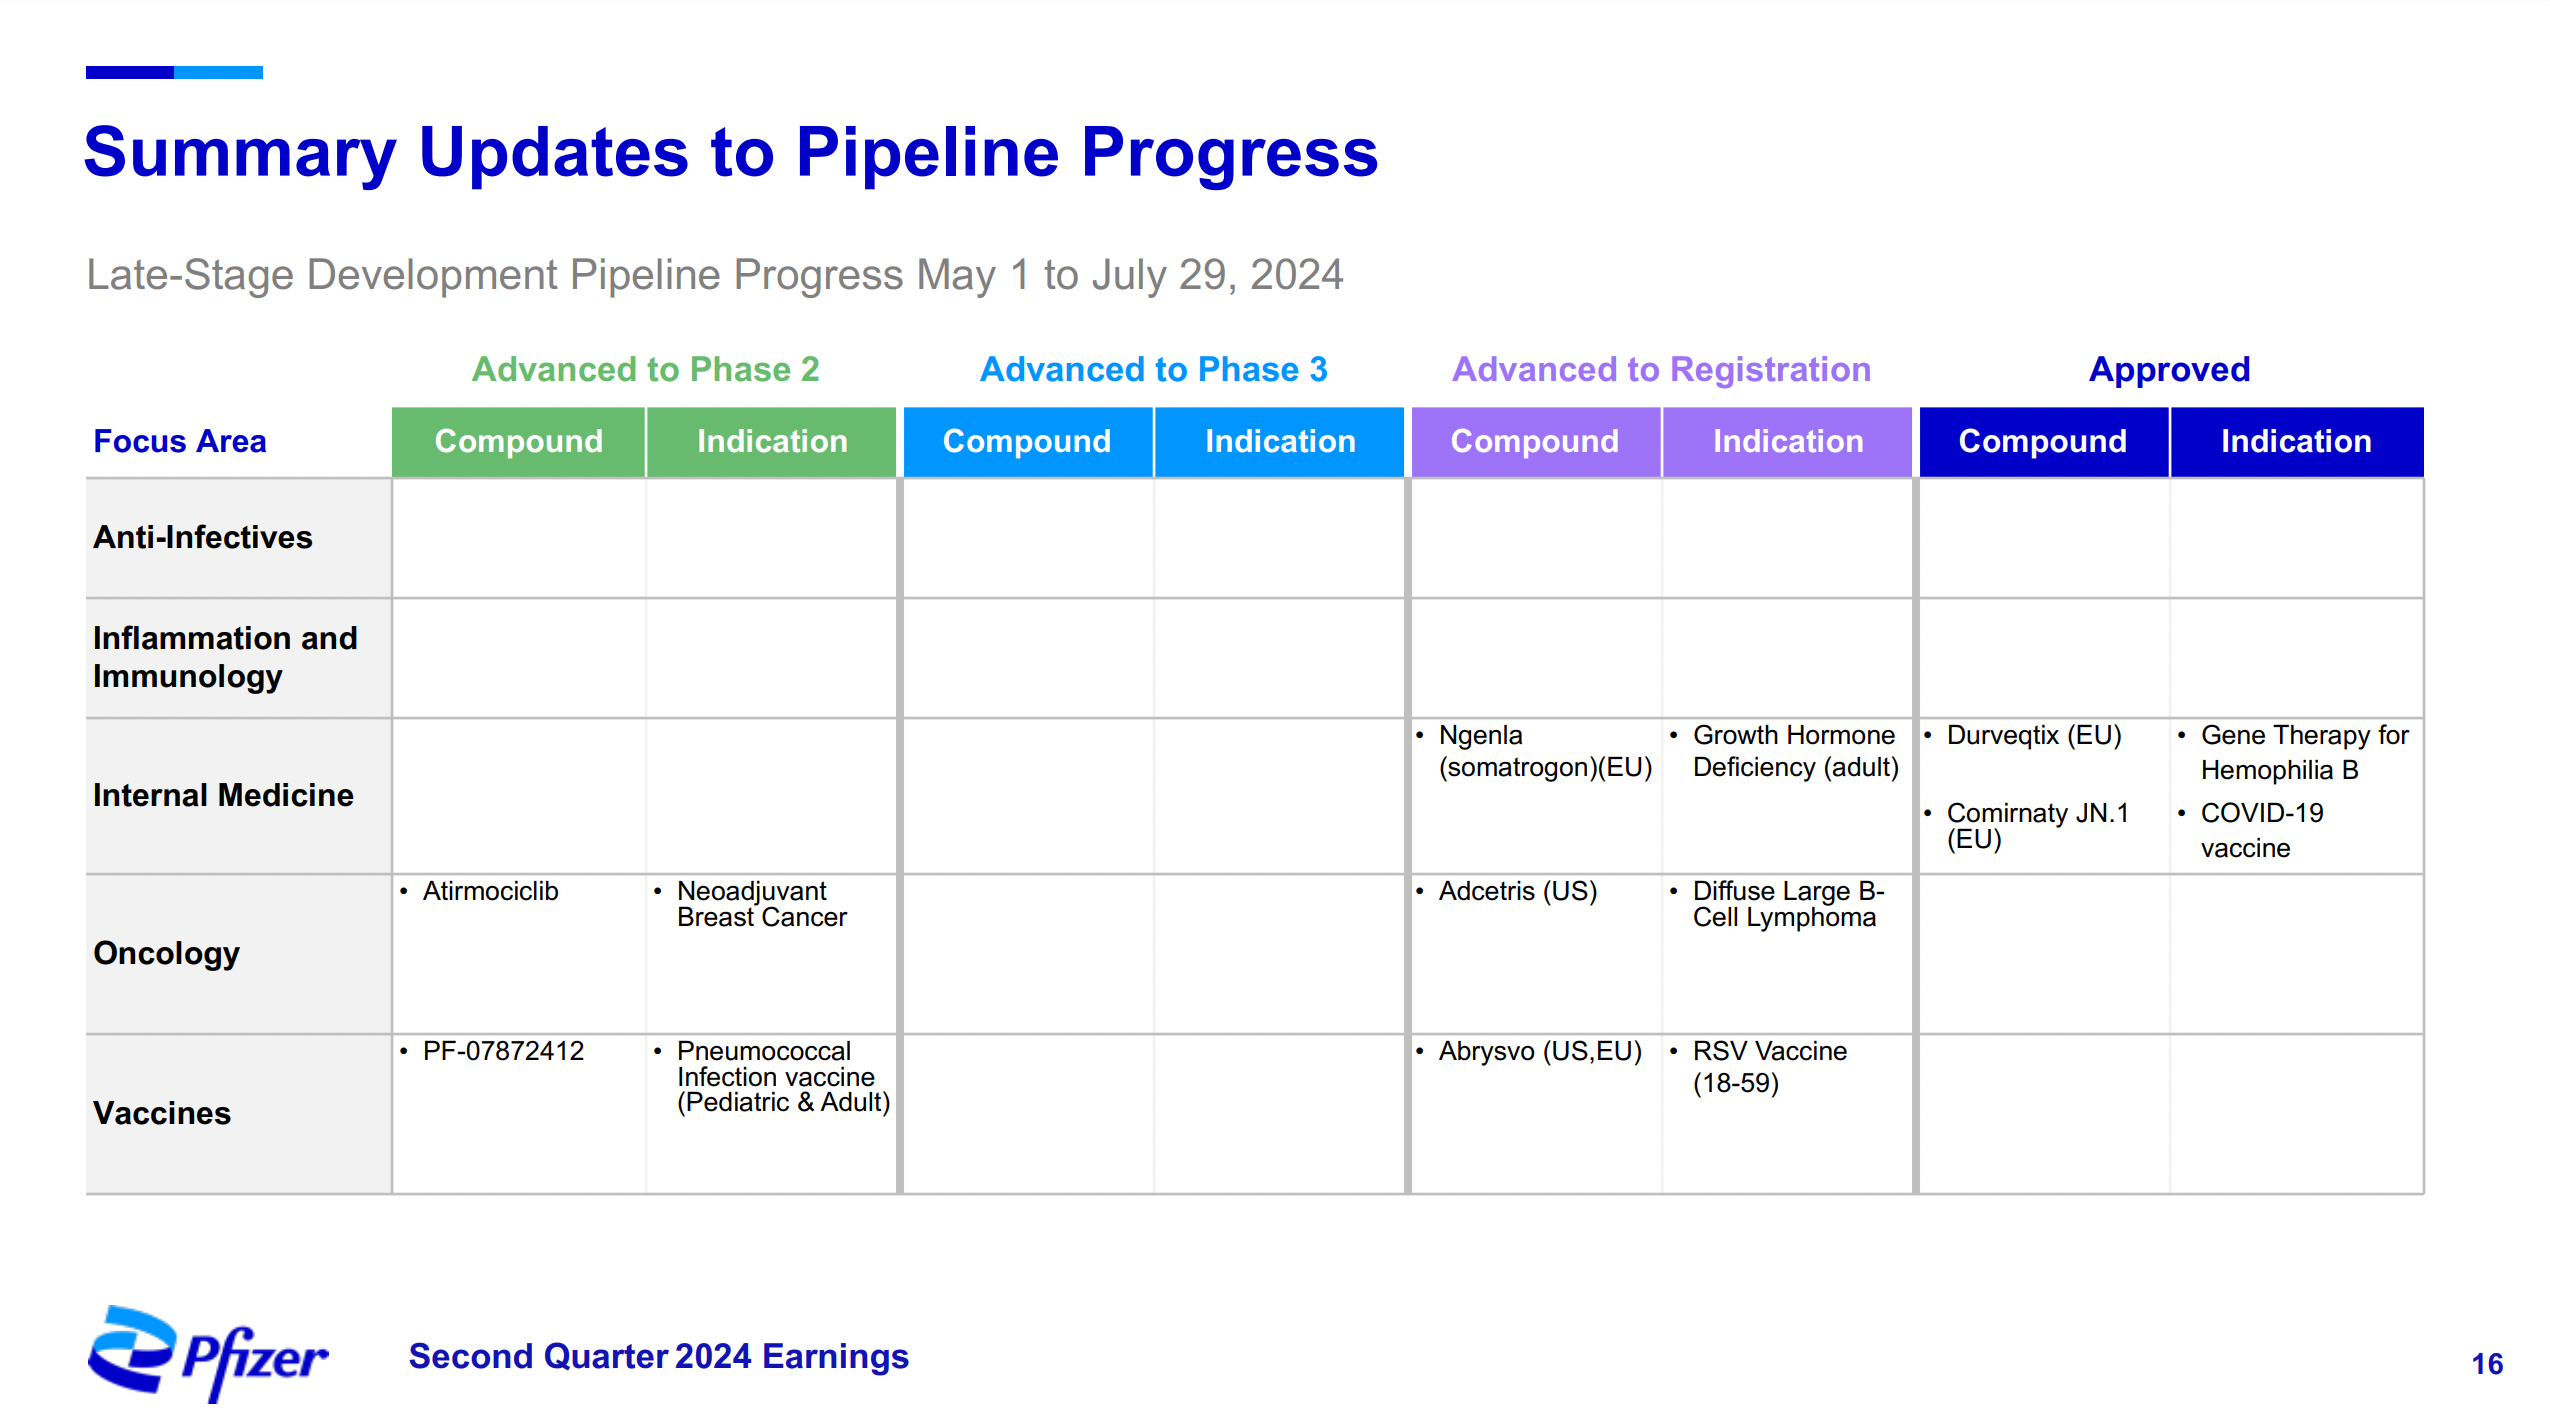
Pipeline Developments
This section primarily covers the progress of products that are still in the research and development pipeline and have not yet been marketed. It includes clinical data, research and development plans, as well as directives issued by regulatory bodies/FDA, such as orders to pause clinical trials and their respective reasons, among other details.
Corporate Developments
This section primarily discusses the company's overall recent developments, including M&A (mergers and acquisitions), ESG (environmental, social, and governance) initiatives, executive changes, and business adjustments made in response to the international situation.
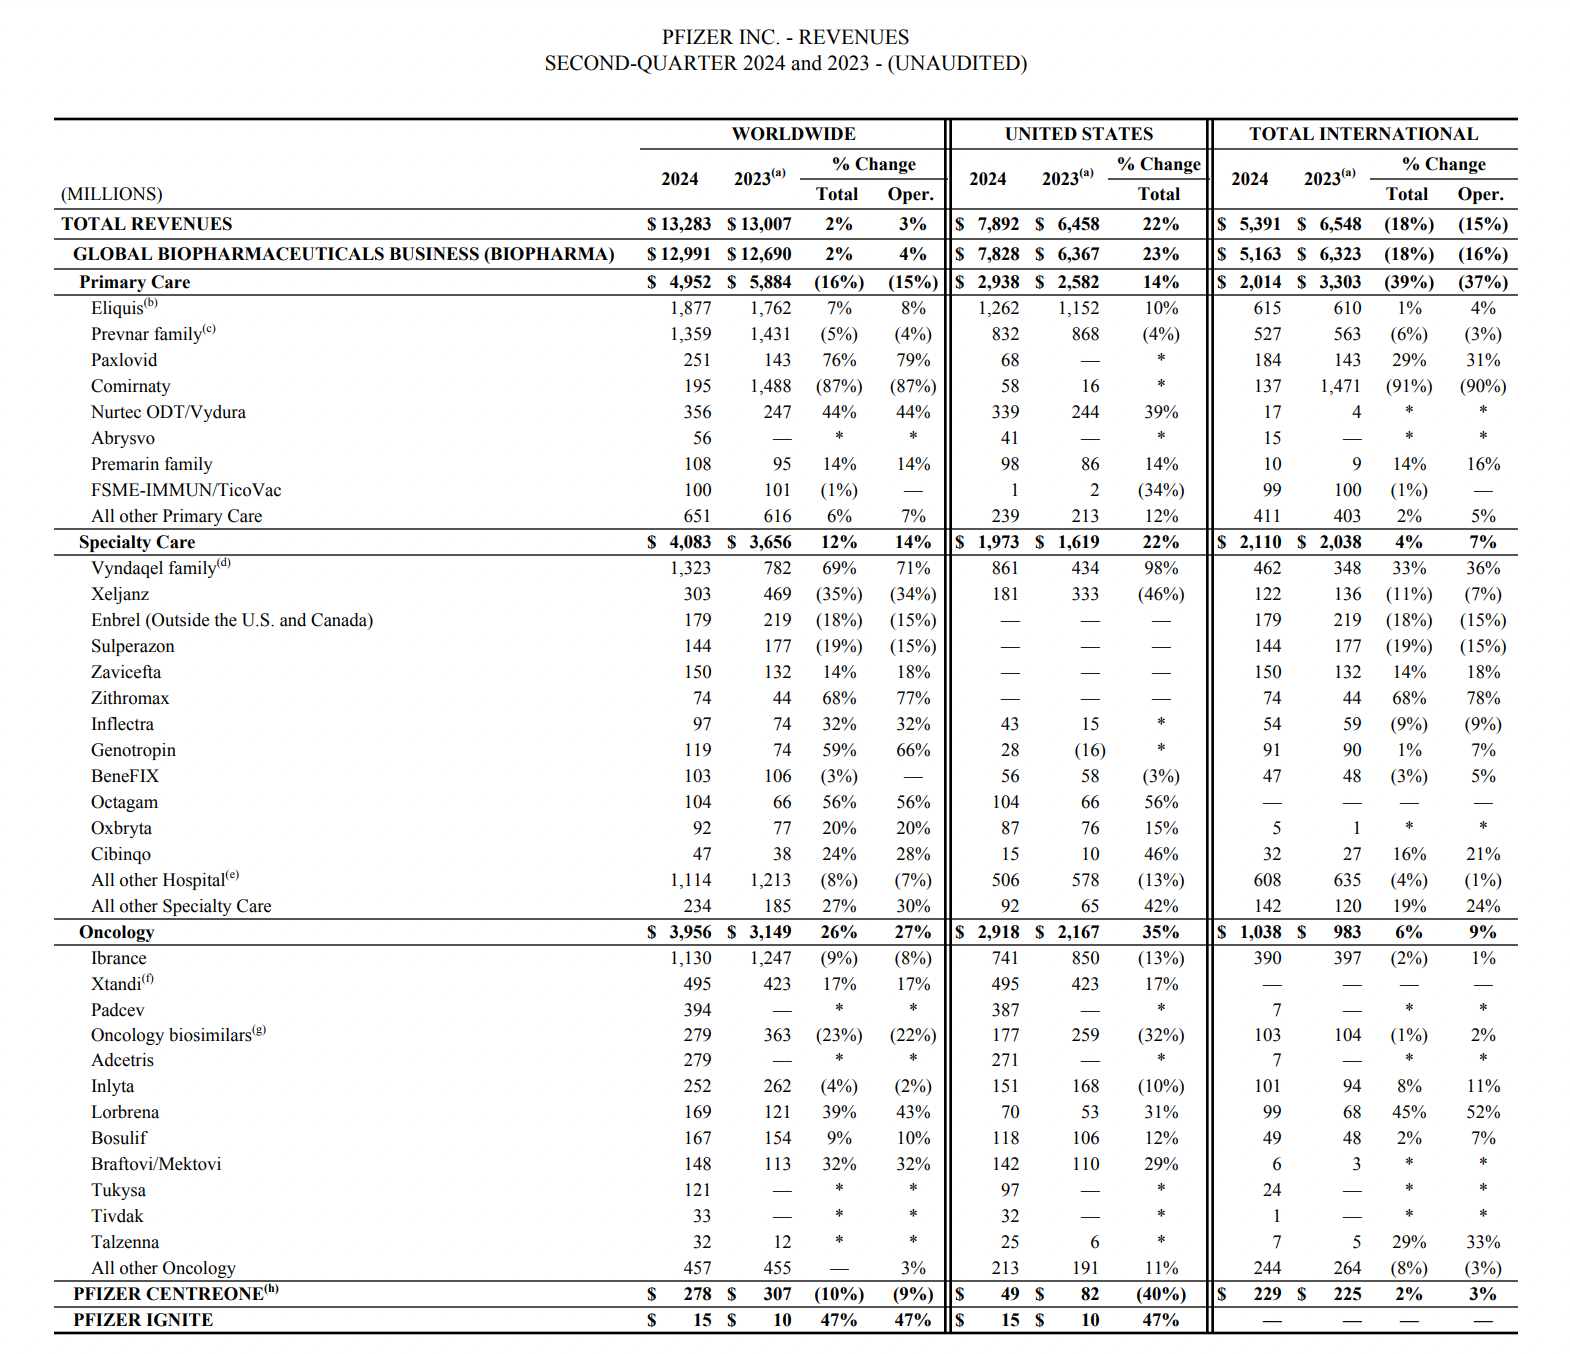
Supplementary Financial Data
The document will conclude with a detailed income statement, which also includes data on product sales. Typically, companies will list data for individual product types by quarter and year-to-date. The tables are categorized by disease area, allowing visibility into the entire segment's revenue and growth rate. Additionally, the tables are divided by region. Most companies segment the regions into the United States, Europe, Asia, and other emerging markets.
After reading the Press Release, one will generally have a good understanding of the company's quarterly performance. If you're not looking to delve into more detailed information, there's no need to review the SEC Filing.
What differences will there be in the financial information presented in a PowerPoint?
The core purpose of the PowerPoint presentation is to visualize the company's data highlights and incorporate some historical data for comparison. The content is relatively not very comprehensive, for instance, financial data and product sales figures. The use of images in the PowerPoint helps everyone better understand additional information such as product efficacy and industry market trends, making the presentation clearer and more visually appealing.
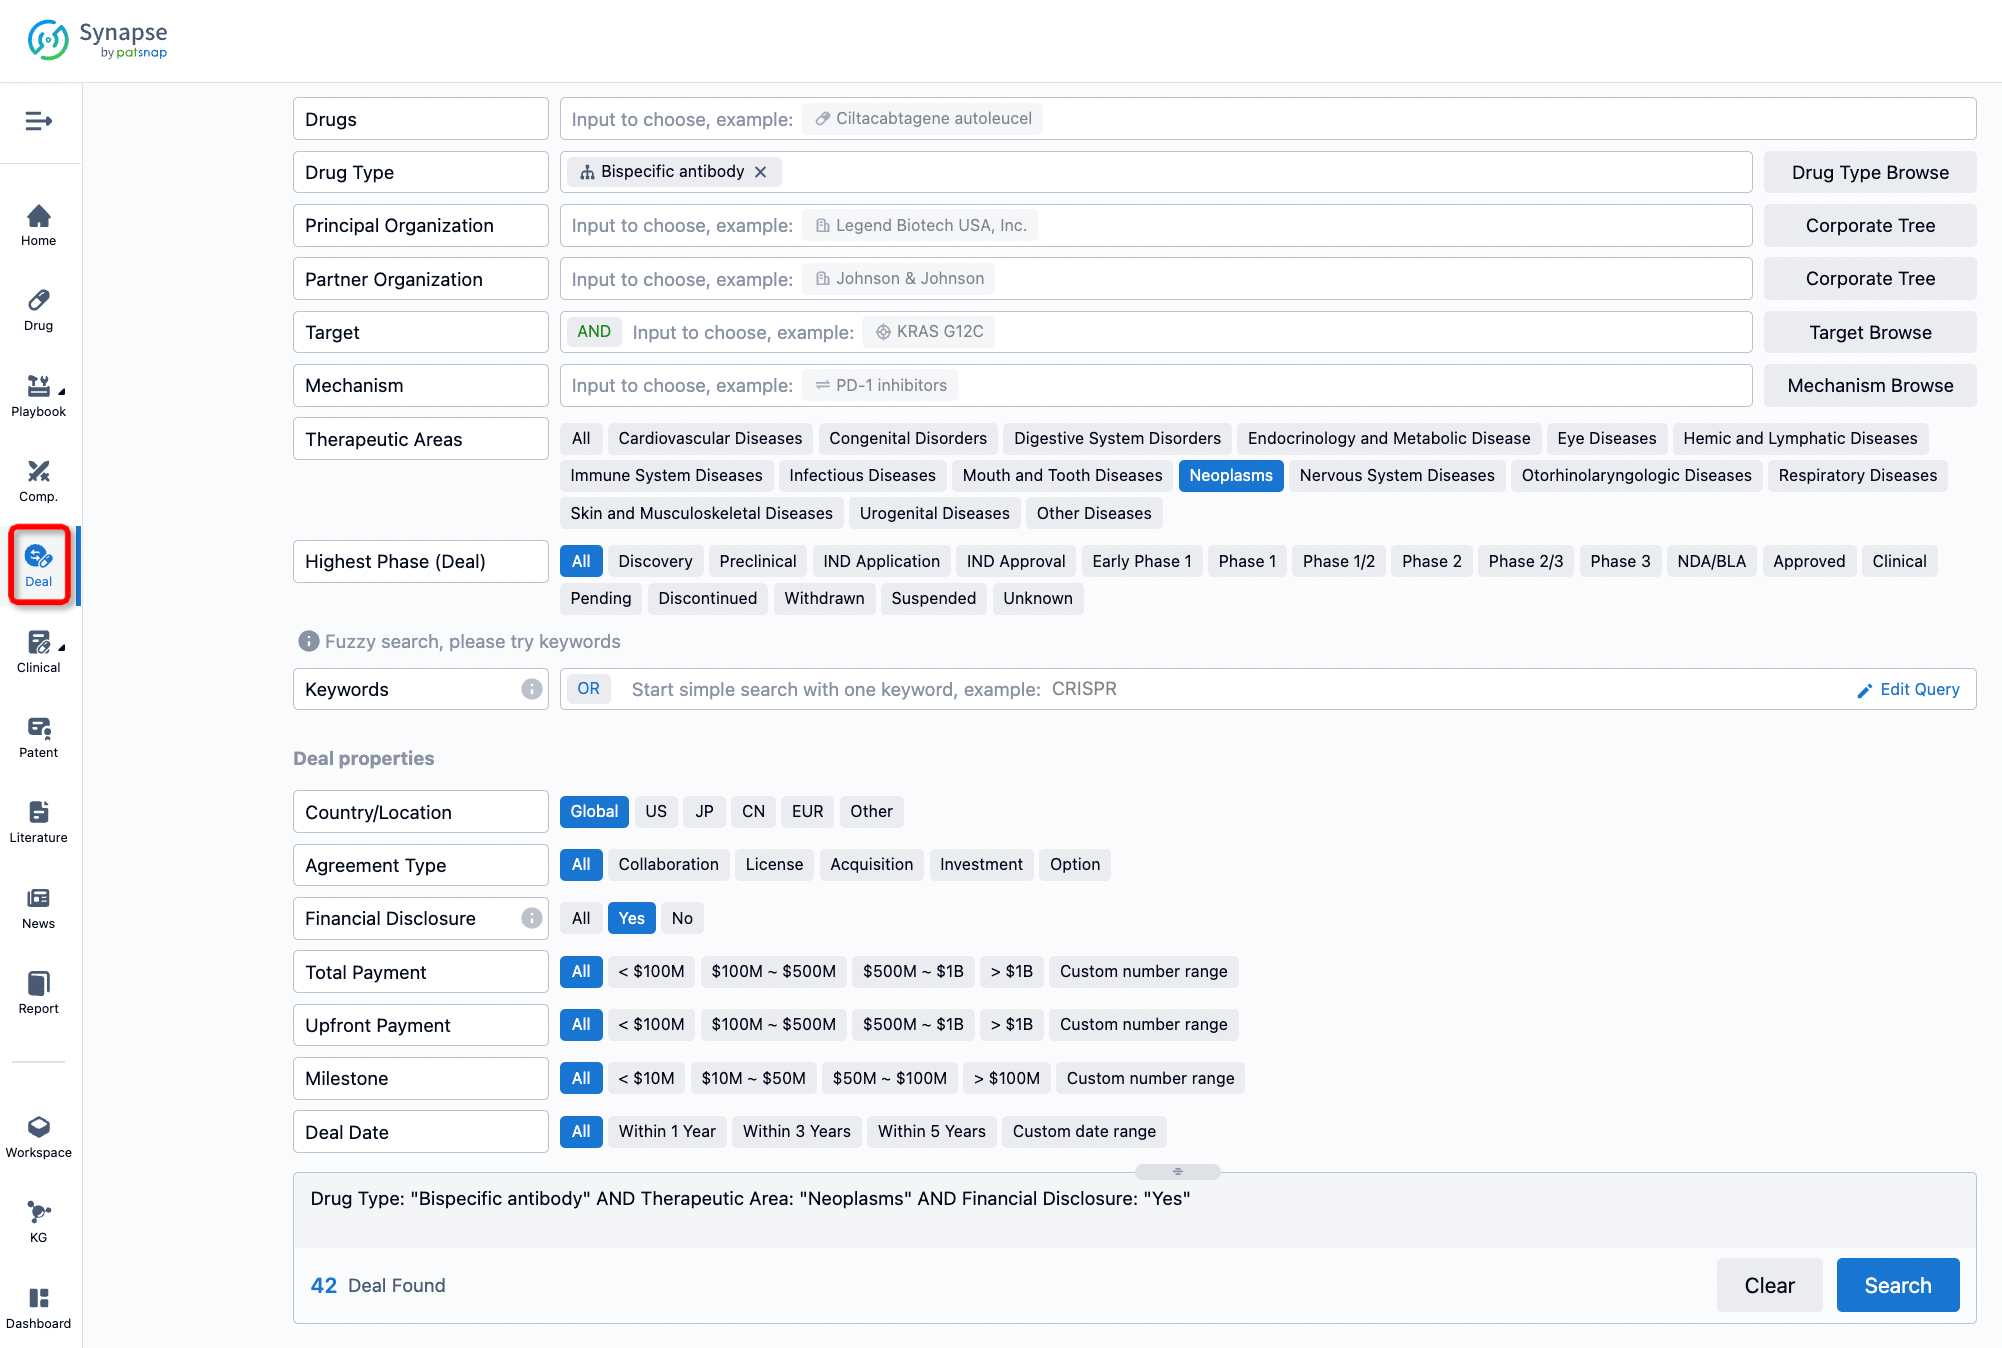
How to get the latest progress on drug deals?
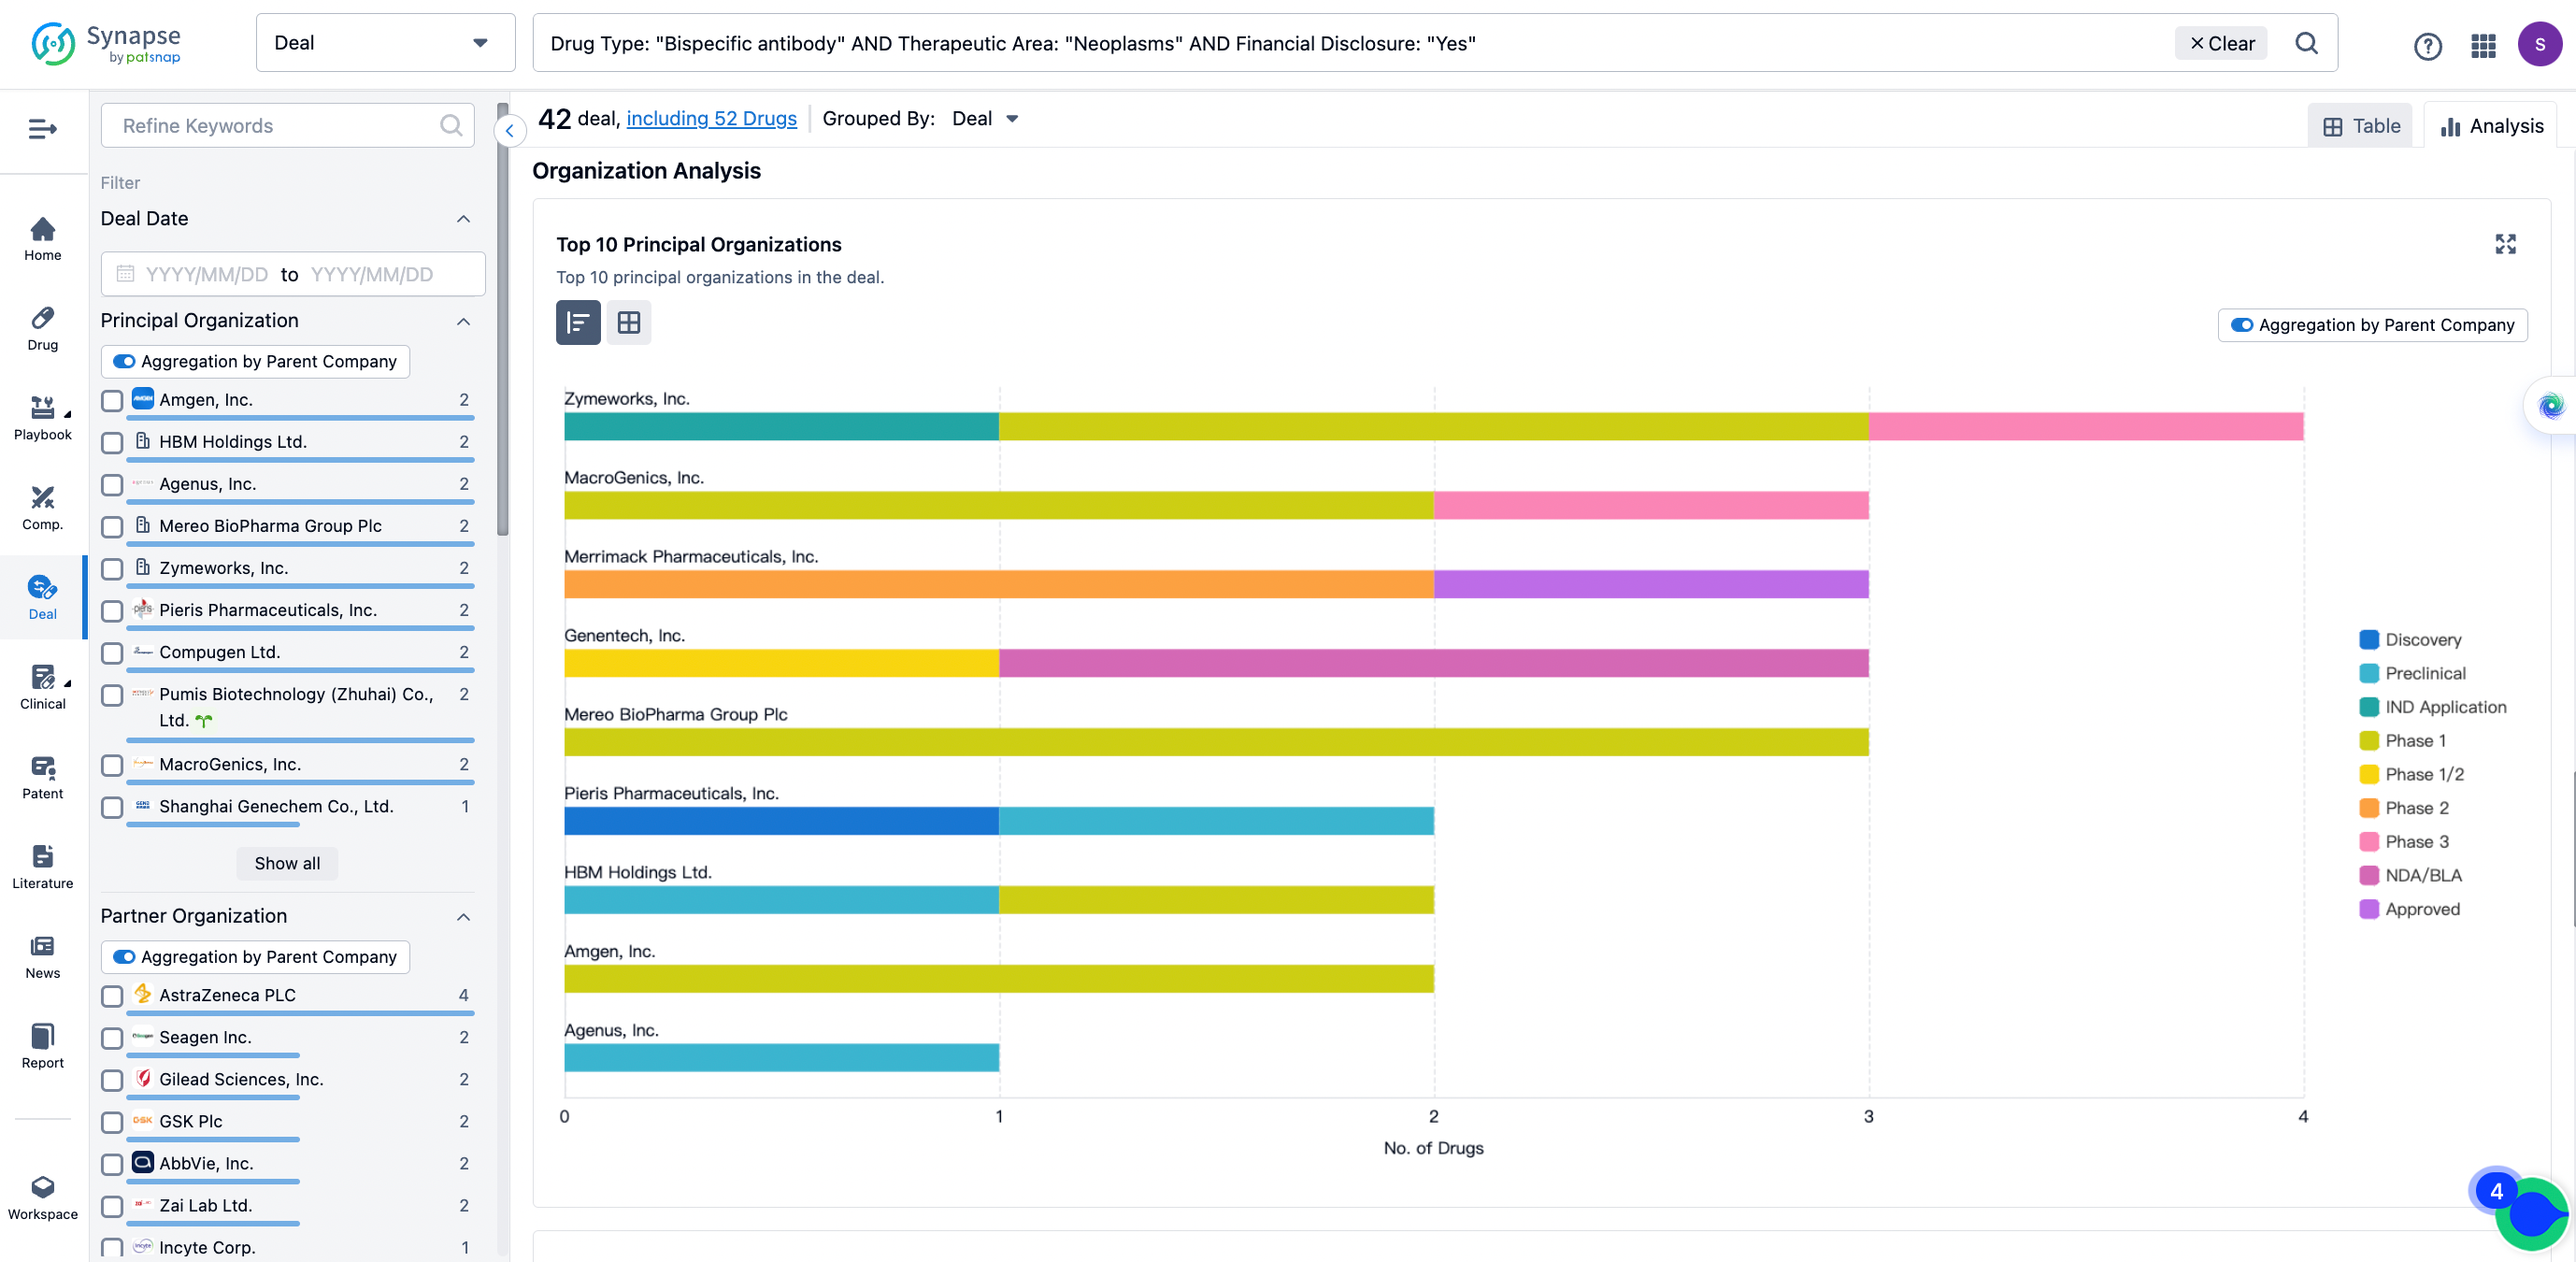
If you would like to access the latest transaction event information, you can click on the 'Deal' module from the homepage of the Synapse database. Within the Deal module, you can search for global pharmaceutical transaction information using labels such as Drugs, Organization, Target, Drug Type, Deal Date.
Furthermore, you can obtain the original link to the transaction coverage by clicking on the "Deal Name."
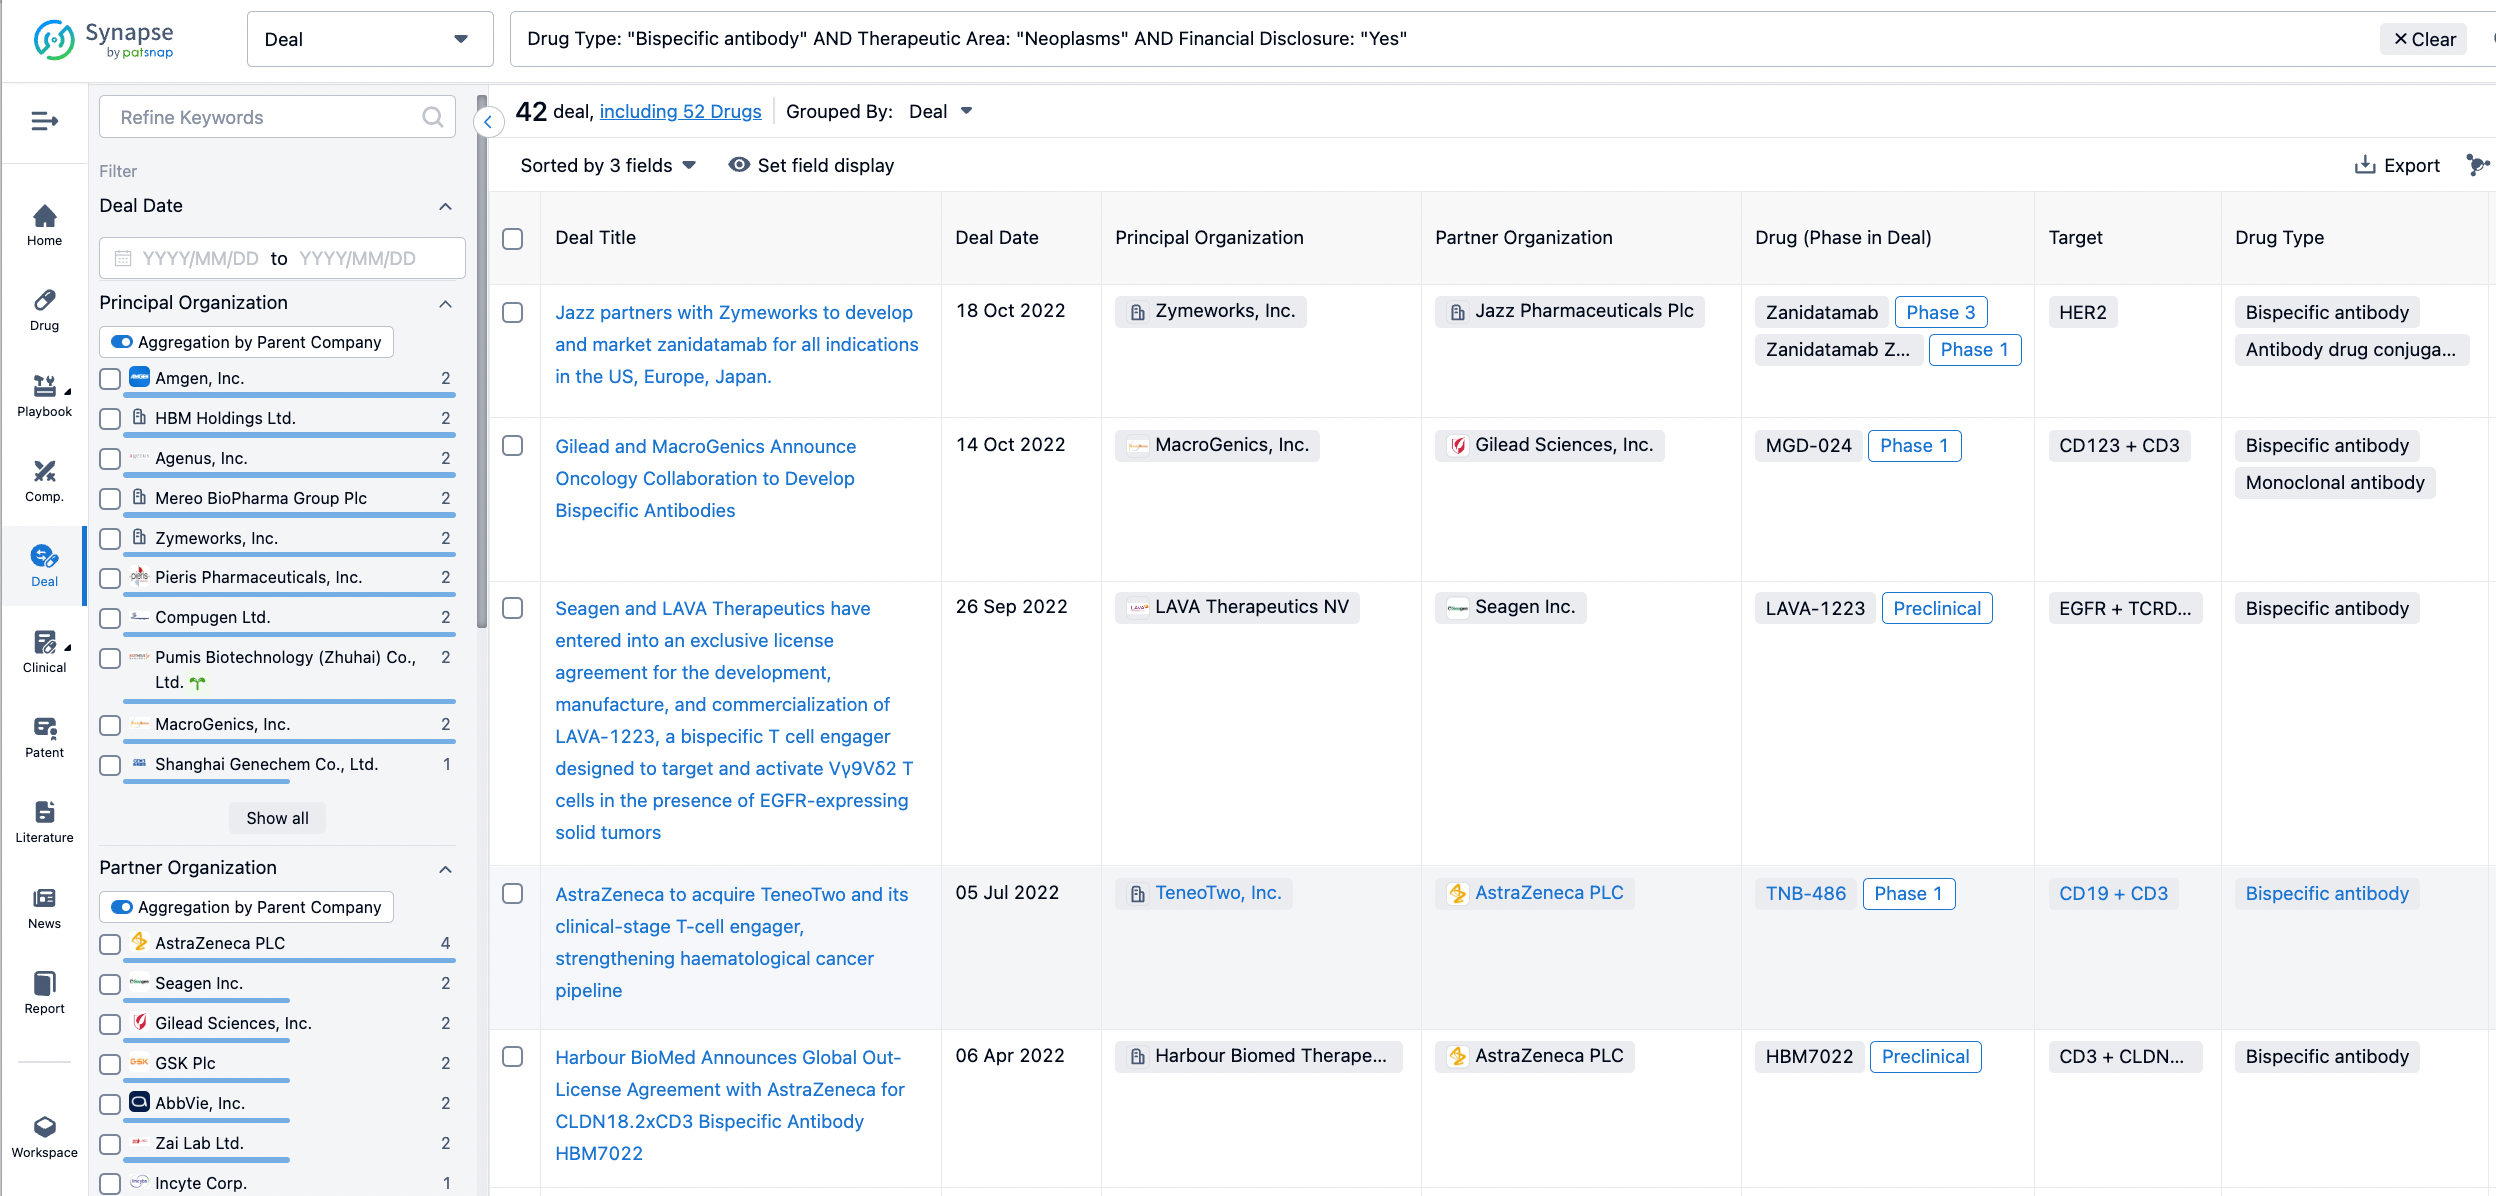
In the analysis view, you can see the most active assignors, assignees, popular targets, and other dimensions of analysis, as well as the distribution of research and development statuses at the time of the transaction, to help you better understand the search results.
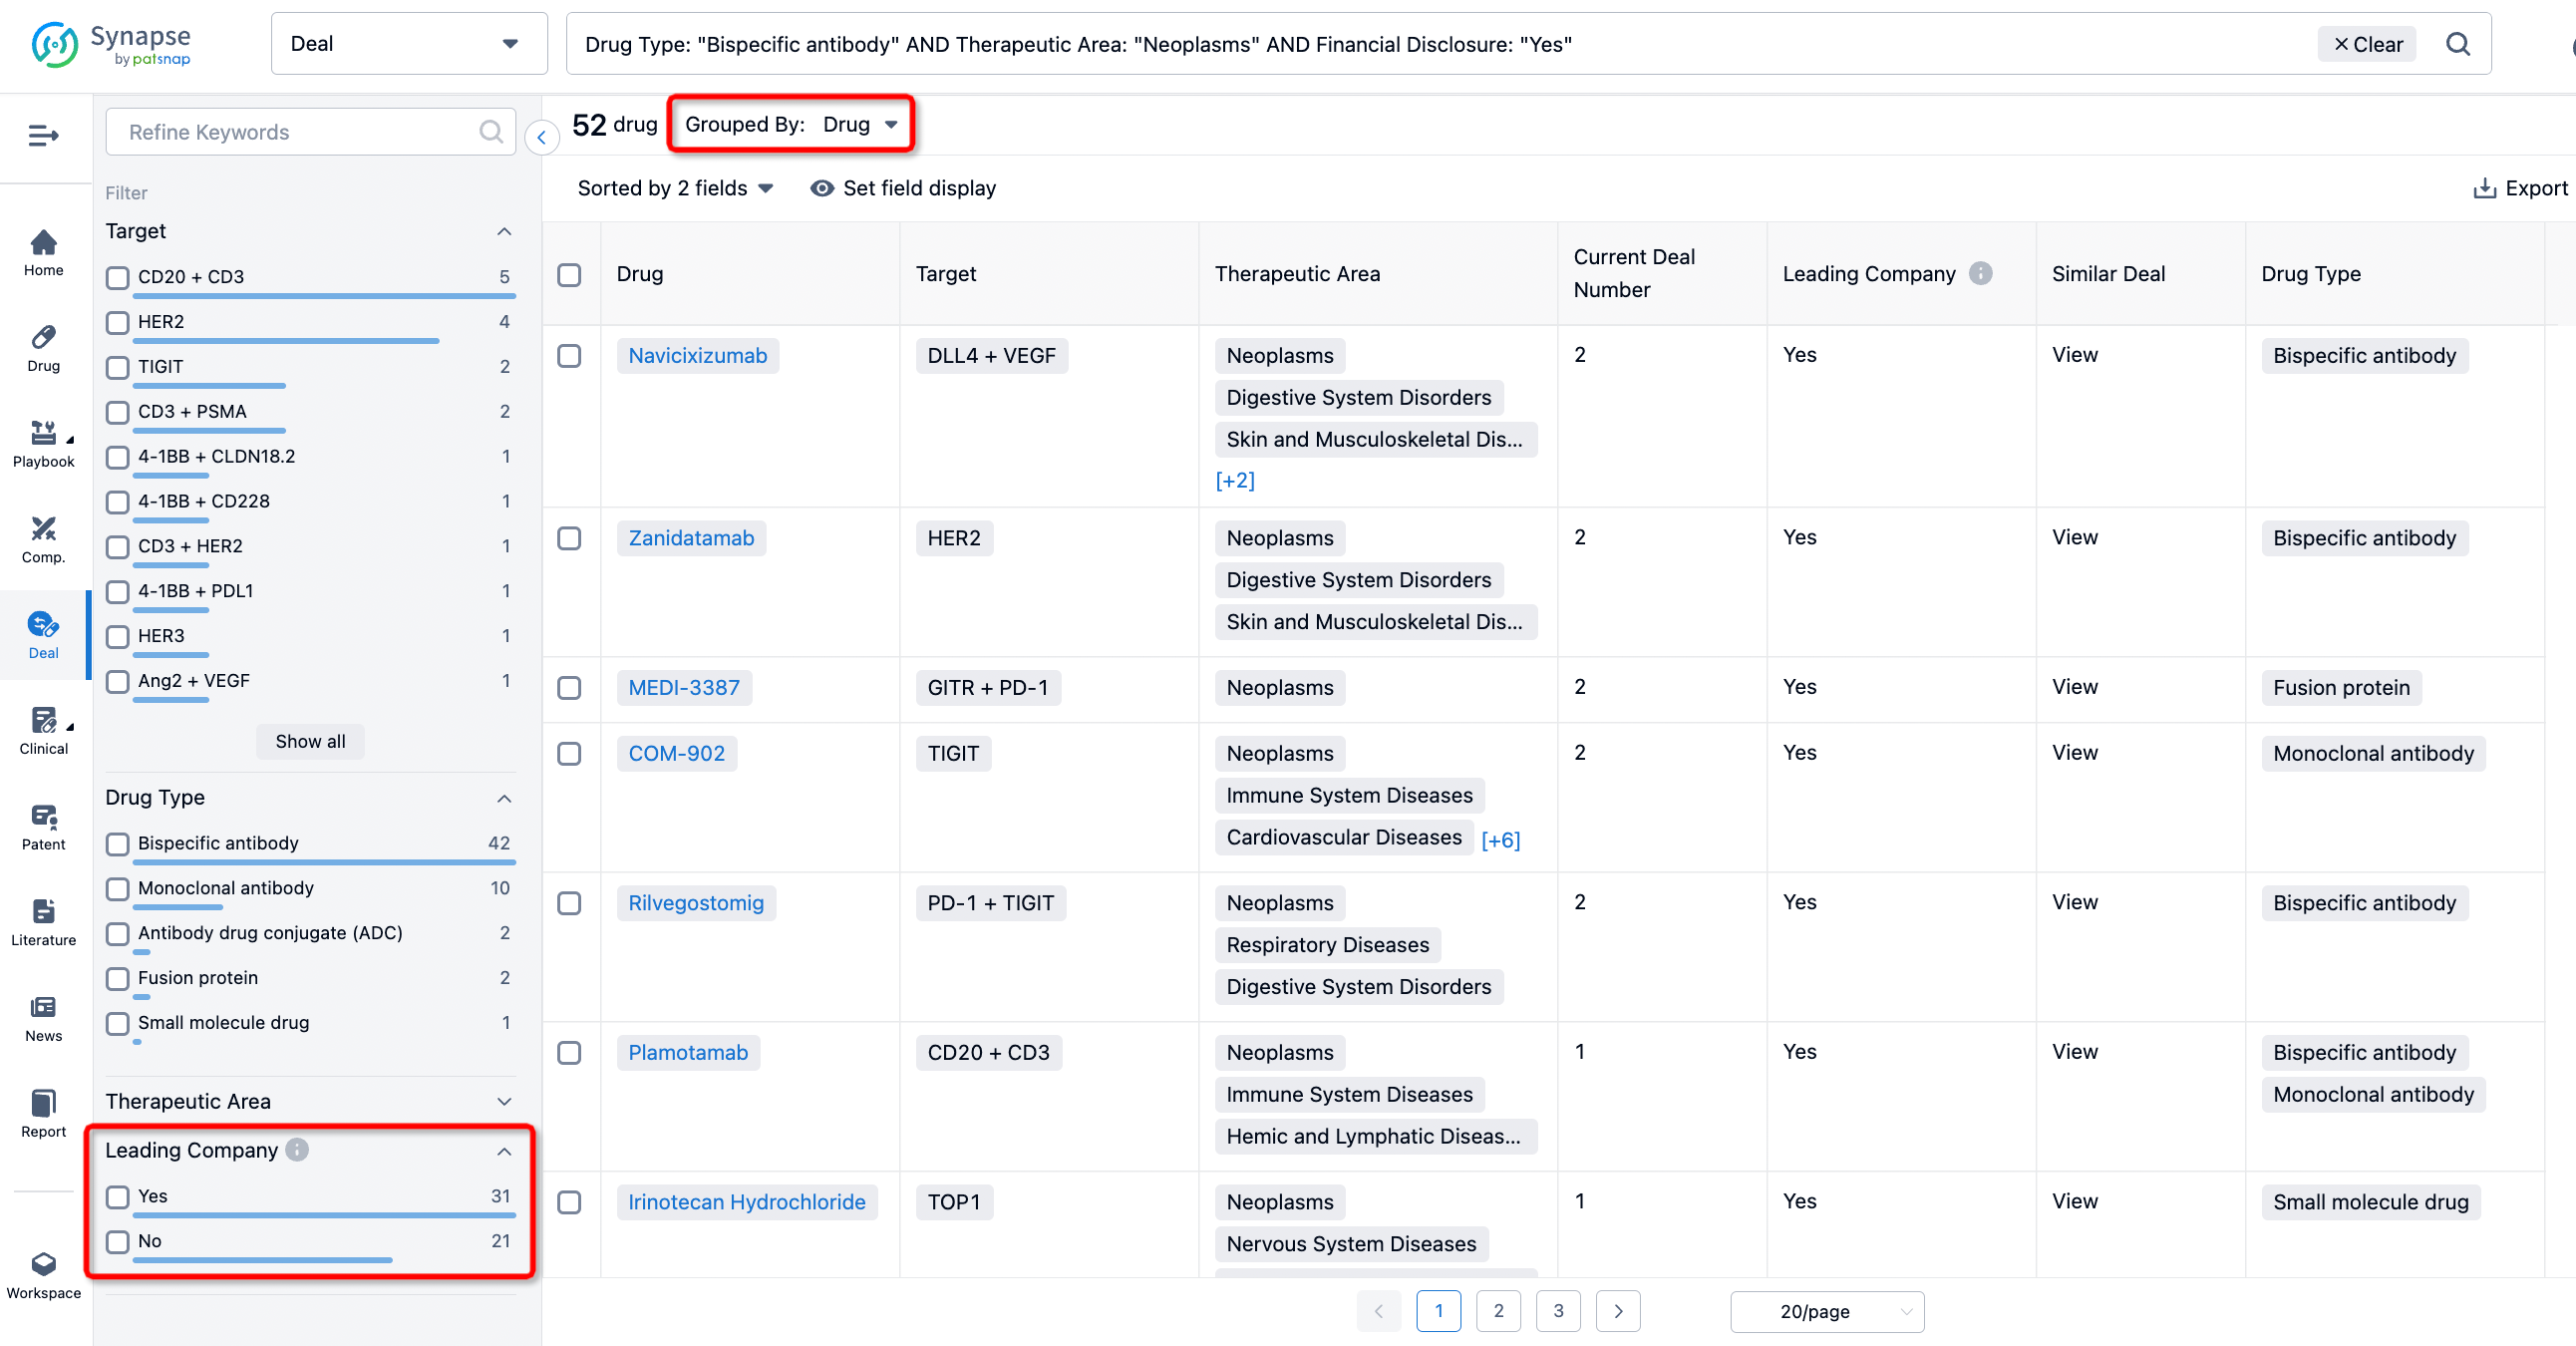
The Synapse database also supports the ability to view current transactions from the dimension of "drugs" (by selecting "drugs" from the "Adjust Dimension" dropdown menu above). Targeting transactions involving renowned pharmaceutical companies that are of interest to the industry, such as Merck, Roche, etc., Synapse has identified a group of "leading companies" through drugs that have achieved global sales exceeding 1 billion US dollars in 2022. Transactions involving drugs from these leading companies can be filtered by clicking on the "Leading Company" tag on the left-hand side.
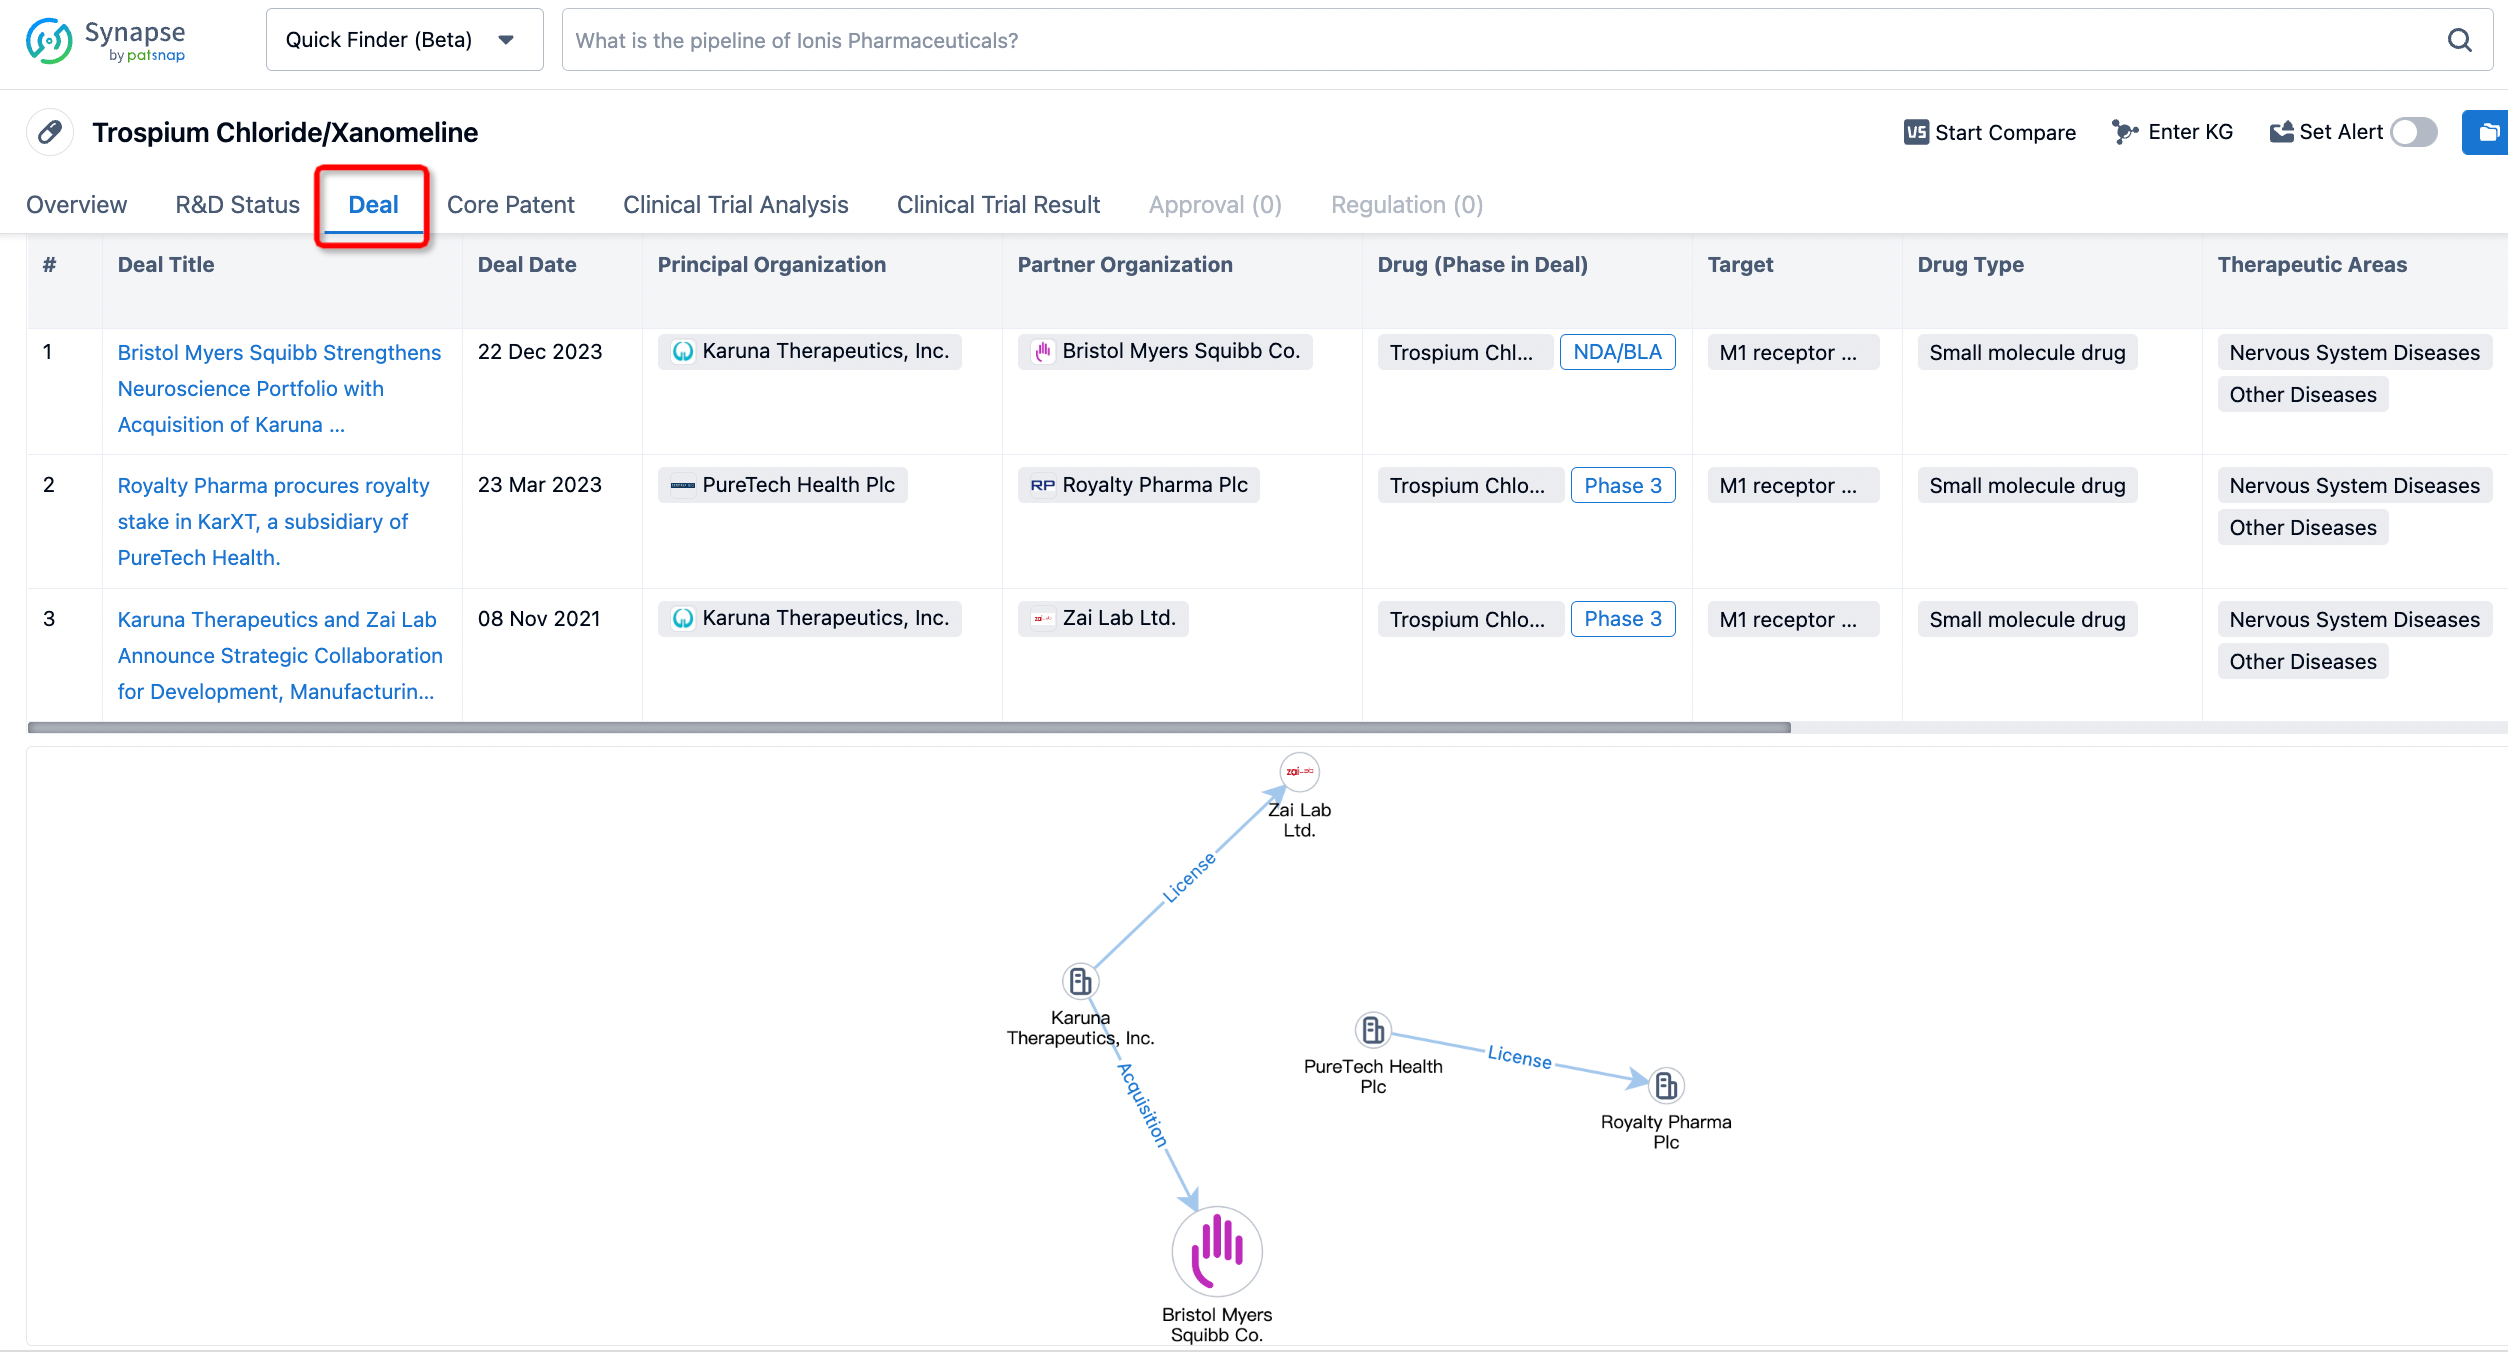
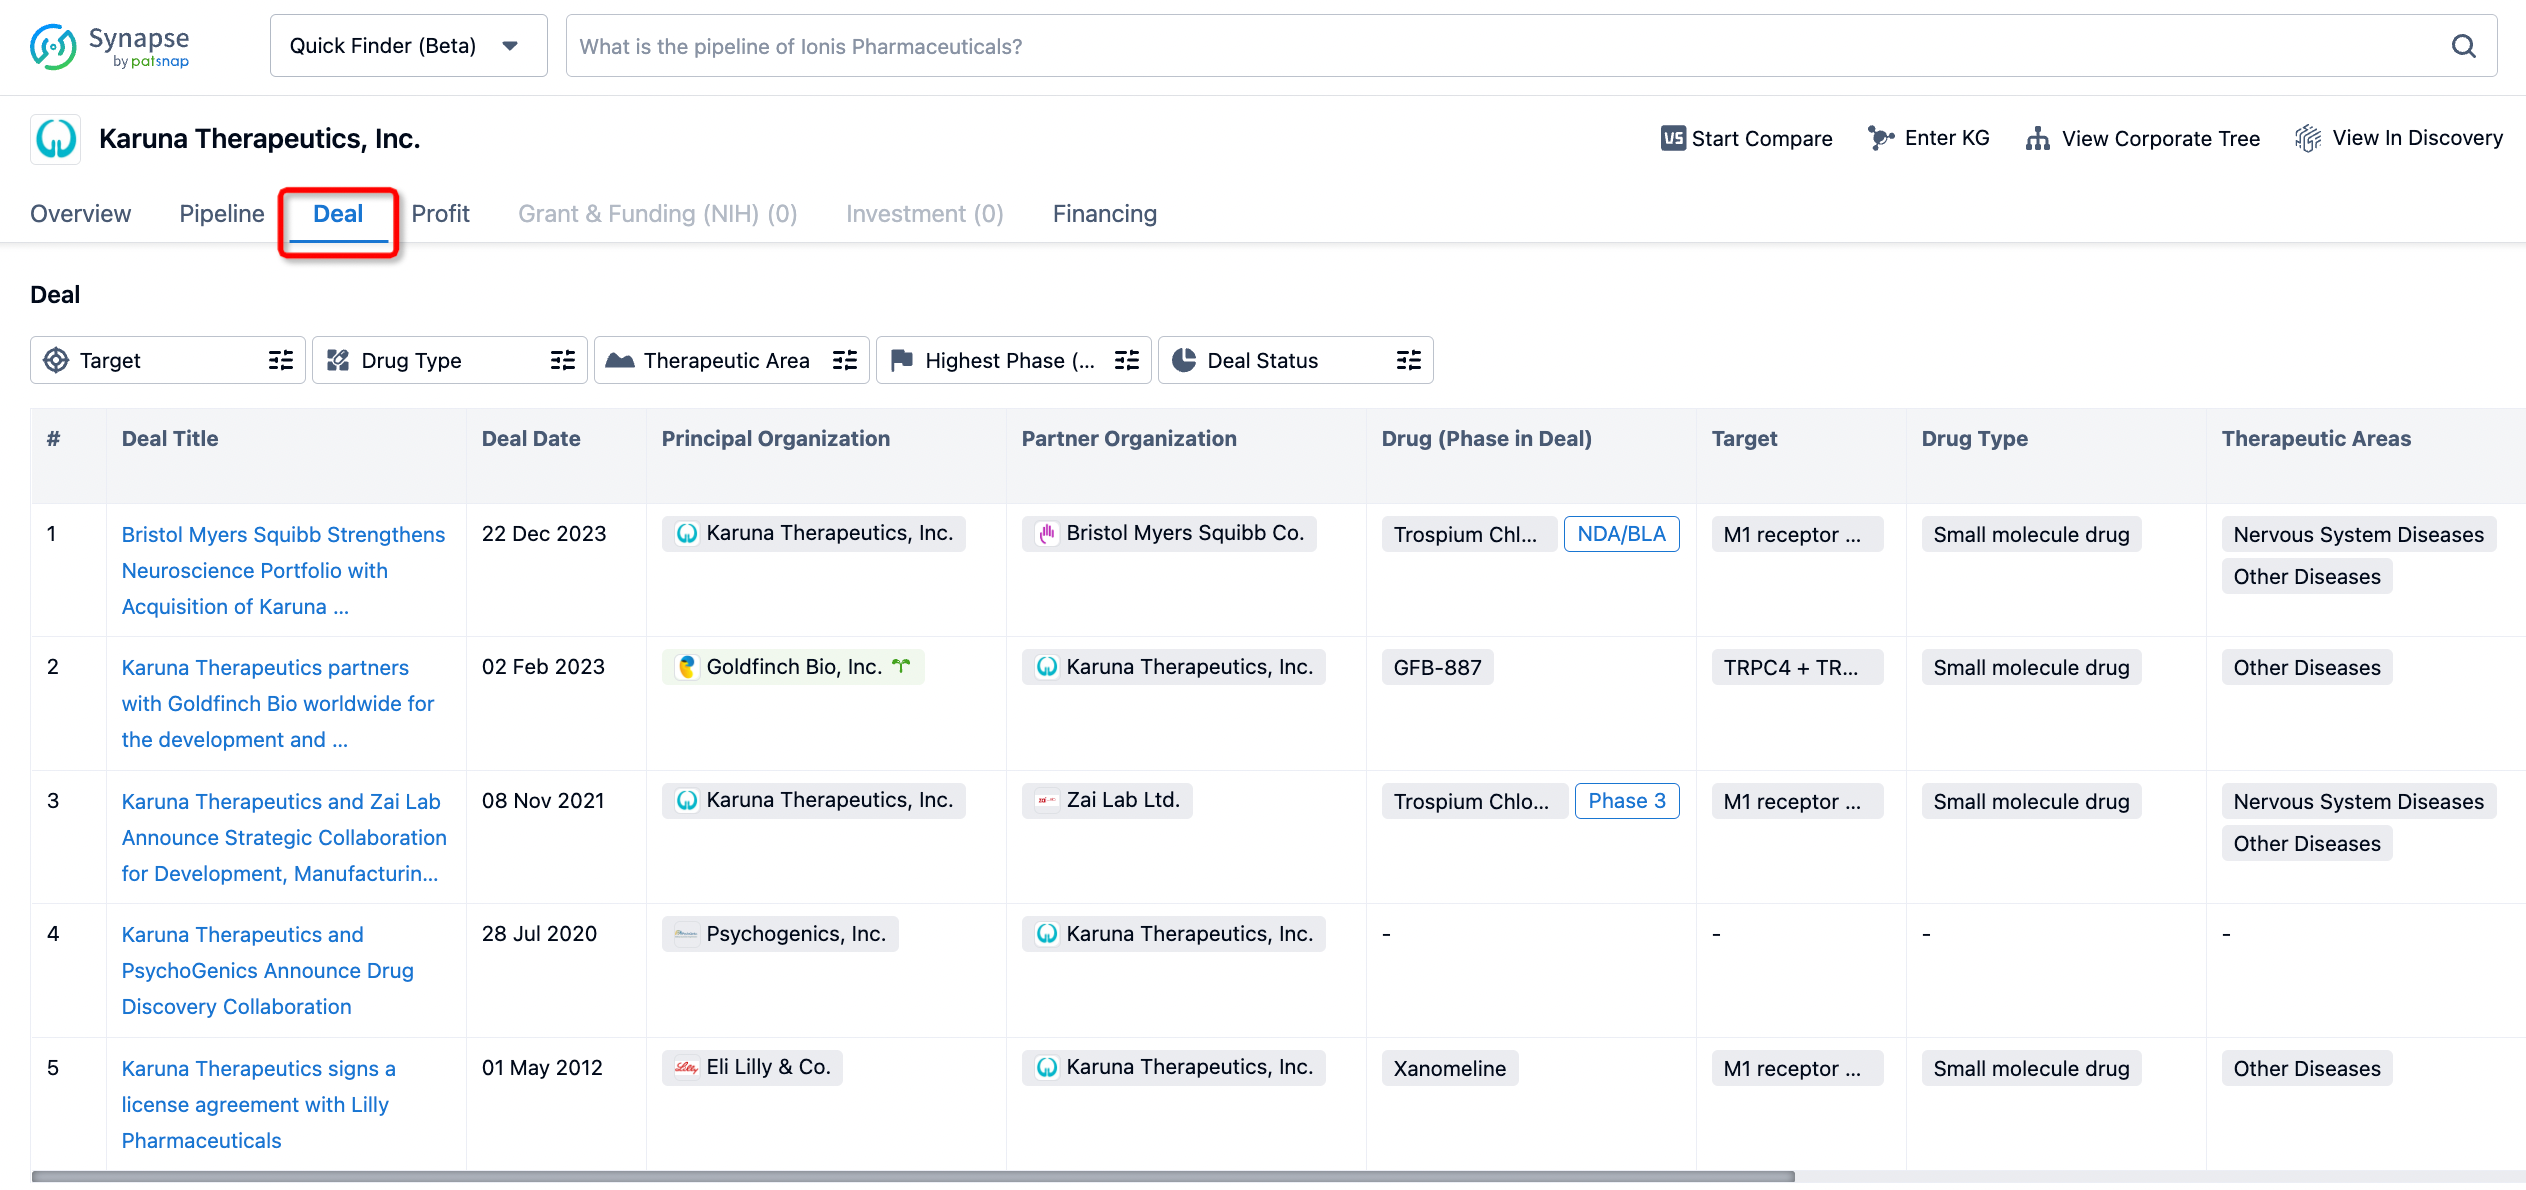
In addition to the drug transaction module, you can also view related transaction history on the drug detail page and the institution detail page.
Click on the image below to embark on a brand new journey of drug discovery!