IVF Devices and Consumables Market: 37% of Growth to Originate from North America, Culture Media & Reagents Segment to be Significant for Revenue Generation - Technavio
06 Sep 2022
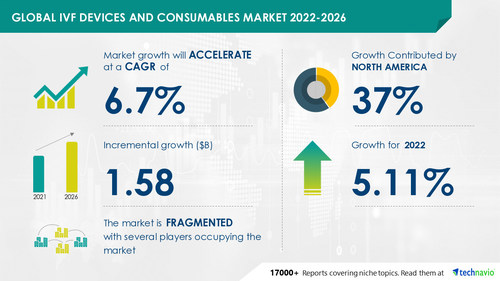
NEW YORK, Sept. 6, 2022 /PRNewswire/ -- The "IVF Devices And Consumables Market - Forecast and Analysis 2022-2026" report has been added to Technavio's offering. With ISO 9001:2015 certification, Technavio is proudly partnering with more than 100 Fortune 500 companies for over 16 years. The IVF devices and consumables market share is expected to increase to
USD 1.58 billion from 2021 to 2026, and the market's growth momentum will accelerate at a
CAGR of 6.7%. Technavio categorizes the IVF devices and consumables market as a part of the
global healthcare equipment market. Our research report has extensively covered external factors influencing the parent market growth potential in the coming years, which will determine the levels of growth of the IVF devices and consumables market during the forecast period.
To know more about the parent market analysis - Grab a FREE Sample Now!
Continue Reading
Preview
Source: PRNewswire
IVF Devices and Consumables Market by Product and Geography - Forecast and Analysis 2022-2026
IVF Devices And Consumables Market - Vendor Landscape
The global IVF devices and consumables market is
fragmented, with the presence of several global and regional vendors. Global vendors have established a strong foothold in diversified geographies across the globe.
The established vendors present in the global IVF devices and consumables market mainly focus on developing high-quality and advanced products for IVF. Prominent vendors are trying to establish a strong customer base by distributing their products across the world through strong distribution channels. This will also help them remain competitive in the market and garner significant market revenue. They mainly compete in terms of quality, price, and brand. Most manufacturers of IVF devices and consumables are based in North America and Europe.
BIOPSYBELL S.R.L., Cook Group Inc., Esco Micro Pvt. Ltd., FUJIFILM Holdings Corp., Hamilton Thorne, Inc., The Merck Group, Sysmex Corp, The Cooper Companies, Inc., Thermo Fisher Scientific Inc., and Vitrolife Sweden AB are some of the major vendors.
To know about the vendor offerings -
IVF Devices And Consumables Market - Segmentation Analysis
The IVF devices and consumables market report is segmented by Product (culture media and reagents, accessories and disposables, and instruments) and Geography (North America, Europe, Asia, and the Rest of the World (ROW)).
Regional Highlights - 37% of the market's growth will originate from
North America during the forecast period. US and Canada are the key markets for IVF devices and consumables in North America. Market growth in this region will be faster than the growth of the market in Europe and ROW. The significant increase in demand for ART procedures and the rise in the infertility rate in the population will facilitate the IVF devices and consumables market growth in North America over the forecast period.
Revenue Generating Segment - The IVF devices and consumables market share growth by the
culture media and reagents segment will be significant during the forecast period. The major factors contributing to the growth of the segment include the increasing incidence of infertility among both men and women, the growing focus and awareness of ART procedures among more people, and the introduction of a variety of cultural media and reagents, which are suitable to grow and store the cells at various stages of IVF procedures.
Request a sample report
for additional insights into the contribution of all the segments
IVF Devices And Consumables Market - Key Market Dynamics
Market Driver - The key factor driving the global in vitro fertilization devices and consumables market growth is the rise in the number of infertility cases. According to a CDC report of 2020, about 6% of married women aged 15-49 years in the US are unable to get pregnant after a year of trying to conceive. Also, about 14% of married women aged 15-49 years in the US have difficulty in carrying a pregnancy to term, which is termed impaired fecundity. As per a CDC report of 2021, both male and female factors contributed equally to about 35% of infertility cases.
Market Challenges - The key challenge to the global IVF devices and consumables market growth is the high cost of the procedure as it includes the cost of ultrasound, blood tests, counseling, and cycle management planning.
To learn about additional key drivers, trends, and challenges - Request a FREE Sample Report right now!
The competitive scenario provided in the
IVF Devices and Consumables Market report analyzes, evaluates, and positions companies based on various performance indicators. Some of the factors considered for this analysis include the financial performance of companies over the past few years, growth strategies, product innovations, new product launches, investments, growth in market share, etc. Don't wait, Make a strategic approach & boost your business goals with our IVF Devices And Consumables Market Forecast Report -
Related Reports:
The
portable ultrasound bladder scanners market share is expected to increase by USD 11.78 million from 2021 to 2026, and the market's growth momentum will accelerate at a CAGR of 6%.
The
blood warmer devices market share is expected to increase by USD 366.99 million from 2021 to 2026, and the market's growth momentum will accelerate at a CAGR of 7.54%.
Browse for Technavio "Healthcare Market" Research Reports
Key Topics Covered:
1 Executive Summary
1.1 Market Overview
Exhibit 01: Executive Summary – Chart on Market Overview
Exhibit 02: Executive Summary – Data Table on Market Overview
Exhibit 03: Executive Summary – Chart on Global Market Characteristics
Exhibit 04: Executive Summary – Chart on Market by Geography
Exhibit 05: Executive Summary – Chart on Market Segmentation by Product
Exhibit 06: Executive Summary – Chart on Incremental Growth
Exhibit 07: Executive Summary – Data Table on Incremental Growth
Exhibit 08: Executive Summary – Chart on Vendor Market Positioning
2 Market Landscape
2.1 Market ecosystem
Exhibit 09: Parent market
Exhibit 10: Market Characteristics
3 Market Sizing
3.1 Market definition
Exhibit 11: Offerings of vendors included in the market definition
3.2 Market segment analysis
Exhibit 12: Market segments
3.3 Market size 2021
3.4 Market outlook: Forecast for 2021-2026
Exhibit 13: Chart on Global - Market size and forecast 2021-2026 ($ million)
Exhibit 14: Data Table on Global - Market size and forecast 2021-2026 ($ million)
Exhibit 15: Chart on Global Market: Year-over-year growth 2021-2026 (%)
Exhibit 16: Data Table on Global Market: Year-over-year growth 2021-2026 (%)
4 Five Forces Analysis
4.1 Five forces summary
Exhibit 17: Five forces analysis - Comparison between 2021 and 2026
4.2 Bargaining power of buyers
Exhibit 18: Chart on Bargaining power of buyers – Impact of key factors 2021 and 2026
4.3 Bargaining power of suppliers
Exhibit 19: Bargaining power of suppliers – Impact of key factors in 2021 and 2026
4.4 Threat of new entrants
Exhibit 20: Threat of new entrants – Impact of key factors in 2021 and 2026
4.5 Threat of substitutes
Exhibit 21: Threat of substitutes – Impact of key factors in 2021 and 2026
4.6 Threat of rivalry
Exhibit 22: Threat of rivalry – Impact of key factors in 2021 and 2026
4.7 Market condition
Exhibit 23: Chart on Market condition - Five forces 2021 and 2026
5 Market Segmentation by Product
5.1 Market segments
Exhibit 24: Chart on Product - Market share 2021-2026 (%)
Exhibit 25: Data Table on Product - Market share 2021-2026 (%)
5.2 Comparison by Product
Exhibit 26: Chart on Comparison by Product
Exhibit 27: Data Table on Comparison by Product
5.3 Culture media and reagents - Market size and forecast 2021-2026
Exhibit 28: Chart on Culture media and reagents - Market size and forecast 2021-2026 ($ million)
Exhibit 29: Data Table on Culture media and reagents - Market size and forecast 2021-2026 ($ million)
Exhibit 30: Chart on Culture media and reagents - Year-over-year growth 2021-2026 (%)
Exhibit 31: Data Table on Culture media and reagents - Year-over-year growth 2021-2026 (%)
5.4 Accessories and disposables - Market size and forecast 2021-2026
Exhibit 32: Chart on Accessories and disposables - Market size and forecast 2021-2026 ($ million)
Exhibit 33: Data Table on Accessories and disposables - Market size and forecast 2021-2026 ($ million)
Exhibit 34: Chart on Accessories and disposables - Year-over-year growth 2021-2026 (%)
Exhibit 35: Data Table on Accessories and disposables - Year-over-year growth 2021-2026 (%)
5.5 Instruments - Market size and forecast 2021-2026
Exhibit 36: Chart on Instruments - Market size and forecast 2021-2026 ($ million)
Exhibit 37: Data Table on Instruments - Market size and forecast 2021-2026 ($ million)
Exhibit 38: Chart on Instruments - Year-over-year growth 2021-2026 (%)
Exhibit 39: Data Table on Instruments - Year-over-year growth 2021-2026 (%)
5.6 Market opportunity by Product
Exhibit 40: Market opportunity by Product ($ million)
6 Customer Landscape
6.1 Customer landscape overview
Exhibit 41: Analysis of price sensitivity, lifecycle, customer purchase basket, adoption rates, and purchase criteria
7 Geographic Landscape
7.1 Geographic segmentation
Exhibit 42: Chart on Market share by geography 2021-2026 (%)
Exhibit 43: Data Table on Market share by geography 2021-2026 (%)
7.2 Geographic comparison
Exhibit 44: Chart on Geographic comparison
Exhibit 45: Data Table on Geographic comparison
7.3 North America - Market size and forecast 2021-2026
Exhibit 46: Chart on North America - Market size and forecast 2021-2026 ($ million)
Exhibit 47: Data Table on North America - Market size and forecast 2021-2026 ($ million)
Exhibit 48: Chart on North America - Year-over-year growth 2021-2026 (%)
Exhibit 49: Data Table on North America - Year-over-year growth 2021-2026 (%)
7.4 Europe - Market size and forecast 2021-2026
Exhibit 50: Chart on Europe - Market size and forecast 2021-2026 ($ million)
Exhibit 51: Data Table on Europe - Market size and forecast 2021-2026 ($ million)
Exhibit 52: Chart on Europe - Year-over-year growth 2021-2026 (%)
Exhibit 53: Data Table on Europe - Year-over-year growth 2021-2026 (%)
7.5 Asia - Market size and forecast 2021-2026
Exhibit 54: Chart on Asia - Market size and forecast 2021-2026 ($ million)
Exhibit 55: Data Table on Asia - Market size and forecast 2021-2026 ($ million)
Exhibit 56: Chart on Asia - Year-over-year growth 2021-2026 (%)
Exhibit 57: Data Table on Asia - Year-over-year growth 2021-2026 (%)
7.6 Rest of World (ROW) - Market size and forecast 2021-2026
Exhibit 58: Chart on Rest of World (ROW) - Market size and forecast 2021-2026 ($ million)
Exhibit 59: Data Table on Rest of World (ROW) - Market size and forecast 2021-2026 ($ million)
Exhibit 60: Chart on Rest of World (ROW) - Year-over-year growth 2021-2026 (%)
Exhibit 61: Data Table on Rest of World (ROW) - Year-over-year growth 2021-2026 (%)
7.7 US - Market size and forecast 2021-2026
Exhibit 62: Chart on US - Market size and forecast 2021-2026 ($ million)
Exhibit 63: Data Table on US - Market size and forecast 2021-2026 ($ million)
Exhibit 64: Chart on US - Year-over-year growth 2021-2026 (%)
Exhibit 65: Data Table on US - Year-over-year growth 2021-2026 (%)
7.8 Germany - Market size and forecast 2021-2026
Exhibit 66: Chart on Germany - Market size and forecast 2021-2026 ($ million)
Exhibit 67: Data Table on Germany - Market size and forecast 2021-2026 ($ million)
Exhibit 68: Chart on Germany - Year-over-year growth 2021-2026 (%)
Exhibit 69: Data Table on Germany - Year-over-year growth 2021-2026 (%)
7.9 India - Market size and forecast 2021-2026
Exhibit 70: Chart on India - Market size and forecast 2021-2026 ($ million)
Exhibit 71: Data Table on India - Market size and forecast 2021-2026 ($ million)
Exhibit 72: Chart on India - Year-over-year growth 2021-2026 (%)
Exhibit 73: Data Table on India - Year-over-year growth 2021-2026 (%)
7.10 Spain - Market size and forecast 2021-2026
Exhibit 74: Chart on Spain - Market size and forecast 2021-2026 ($ million)
Exhibit 75: Data Table on Spain - Market size and forecast 2021-2026 ($ million)
Exhibit 76: Chart on Spain - Year-over-year growth 2021-2026 (%)
Exhibit 77: Data Table on Spain - Year-over-year growth 2021-2026 (%)
7.11 Canada - Market size and forecast 2021-2026
Exhibit 78: Chart on Canada - Market size and forecast 2021-2026 ($ million)
Exhibit 79: Data Table on Canada - Market size and forecast 2021-2026 ($ million)
Exhibit 80: Chart on Canada - Year-over-year growth 2021-2026 (%)
Exhibit 81: Data Table on Canada - Year-over-year growth 2021-2026 (%)
7.12 Market opportunity by geography
Exhibit 82: Market opportunity by geography ($ million)
8 Drivers, Challenges, and Trends
8.1 Market drivers
8.2 Market challenges
8.3 Impact of drivers and challenges
Exhibit 83: Impact of drivers and challenges in 2021 and 2026
8.4 Market trends
9 Vendor Landscape
9.1 Overview
9.2 Vendor landscape
Exhibit 84: Overview on Criticality of inputs and Factors of differentiation
9.3 Landscape disruption
Exhibit 85: Overview on factors of disruption
9.4 Industry risks
Exhibit 86: Impact of key risks on business
10 Vendor Analysis
10.1 Vendors covered
Exhibit 87: Vendors covered
10.2 Market positioning of vendors
Exhibit 88: Matrix on vendor position and classification
10.3 BIOPSYBELL Srl
Exhibit 89: BIOPSYBELL Srl - Overview
Exhibit 90: BIOPSYBELL Srl - Product / Service
Exhibit 91: BIOPSYBELL Srl - Key offerings
10.4 Cook Medical LLC
Exhibit 92: Cook Medical LLC - Overview
Exhibit 93: Cook Medical LLC - Product / Service
Exhibit 94: Cook Medical LLC - Key offerings
10.5 Esco Medical
Exhibit 95: Esco Medical - Overview
Exhibit 96: Esco Medical - Product / Service
Exhibit 97: Esco Medical - Key offerings
Exhibit 98: FUJIFILM Irvine Scientific Inc. - Overview
Exhibit 99: FUJIFILM Irvine Scientific Inc. - Product / Service
Exhibit 100: FUJIFILM Irvine Scientific Inc. - Key offerings
10.7 Hamilton Thorne Ltd.
Exhibit 101: Hamilton Thorne Ltd. - Overview
Exhibit 102: Hamilton Thorne Ltd. - Product / Service
Exhibit 103: Hamilton Thorne Ltd. - Key offerings
10.8 INVO Bioscience Inc.
Exhibit 104: INVO Bioscience Inc. - Overview
Exhibit 105: INVO Bioscience Inc. - Product / Service
Exhibit 106: INVO Bioscience Inc. - Key offerings
10.9 Merck KGaA
Exhibit 107: Merck KGaA - Overview
Exhibit 108: Merck KGaA - Business segments
Exhibit 109: Merck KGaA - Key news
Exhibit 110: Merck KGaA - Key offerings
Exhibit 111: Merck KGaA - Segment focus
10.10 The Cooper Companies Inc.
Exhibit 112: The Cooper Companies Inc. - Overview
Exhibit 113: The Cooper Companies Inc. - Business segments
Exhibit 114: The Cooper Companies Inc. - Key offerings
Exhibit 115: The Cooper Companies Inc. - Segment focus
Exhibit 116: Thermo Fisher Scientific Inc. - Overview
Exhibit 117: Thermo Fisher Scientific Inc. - Business segments
Exhibit 118: Thermo Fisher Scientific Inc. - Key news
Exhibit 119: Thermo Fisher Scientific Inc. - Key offerings
Exhibit 120: Thermo Fisher Scientific Inc. - Segment focus
10.12 Vitrolife AB
Exhibit 121: Vitrolife AB - Overview
Exhibit 122: Vitrolife AB - Business segments
Exhibit 123: Vitrolife AB - Key offerings
Exhibit 124: Vitrolife AB - Segment focus
11.1 Scope of the report
11.2 Inclusions and exclusions checklist
Exhibit 125: Inclusions checklist
Exhibit 126: Exclusions checklist
11.3 Currency conversion rates for US$
Exhibit 127: Currency conversion rates for US$
11.4 Research methodology
Exhibit 128: Research methodology
Exhibit 129: Validation techniques employed for market sizing
Exhibit 130: Information sources
11.5 List of abbreviations
Exhibit 131: List of abbreviations
About Us
Technavio is a leading global technology research and advisory company. Their research and analysis focuses on emerging market trends and provides actionable insights to help businesses identify market opportunities and develop effective strategies to optimize their market positions.
With over 500 specialized analysts, Technavio's report library consists of more than 17,000 reports and counting, covering 800 technologies, spanning 50 countries. Their client base consists of enterprises of all sizes, including more than 100 Fortune 500 companies. This growing client base relies on Technavio's comprehensive coverage, extensive research, and actionable market insights to identify opportunities in existing and potential markets and assess their competitive positions within changing market scenarios.
Contact
Technavio Research
Jesse Maida
US: +1 844 364 1100
UK: +44 203 893 3200
Email:[email protected]
Website: www.technavio.com/
SOURCE Technavio
For more details,please visit the original website
The content of the article does not represent any opinions of Synapse and its affiliated companies. If there is any copyright infringement or error, please contact us, and we will deal with it within 24 hours.
Organizations
Indications
Targets
-Drugs
-Hot reports


Get started for free today!
Accelerate Strategic R&D decision making with Synapse, PatSnap’s AI-powered Connected Innovation Intelligence Platform Built for Life Sciences Professionals.
Start your data trial now!
Synapse data is also accessible to external entities via APIs or data packages. Leverages most recent intelligence information, enabling fullest potential.