Liver Cancer Drugs Market size to grow by USD 5.29 billion | Market Research Insights highlight the increasing incidence of liver cancer as Key Driver | Technavio
21 Jun 2022
Immunotherapy
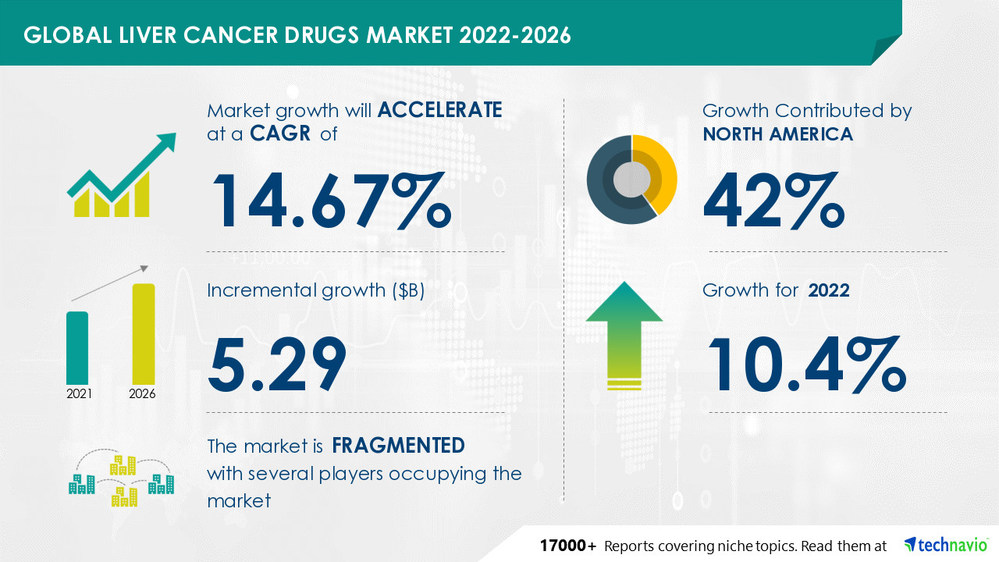
NEW YORK, June 20, 2022 /PRNewswire/ -- According to the research report "Liver Cancer Drugs Market by Type and Geography - Forecast and Analysis 2022-2026", the market will witness a YOY growth of 10.4% at a CAGR of 14.67% during the forecast period. The report is segmented by
type (immunotherapy and targeted therapy) and geography (North America, Europe, Asia, and Rest of World (ROW)).
For more insights on YOY and CAGR, Read Sample Report
Preview
Source: PRNewswire
Technavio has announced its latest market research report titled Liver Cancer Drugs Market by Type and Geography - Forecast and Analysis 2022-2026
Global LiverLiver Cancer Drugs Market is fragmented and the vendors are deploying various organic and inorganic growth strategies to compete in the market.
The growing competition in the market is compelling vendors to adopt various growth strategies such as promotional activities and spending on advertisements to improve the visibility of their services. Some vendors are also adopting inorganic growth strategies such as M&As to remain competitive in the market.
The report analyzes the market's competitive landscape and offers information on several market vendors, including:
Eli Lilly and Co.
Lion TCR Pte. Ltd
Merck and Co. Inc.
Find additional highlights on the growth strategies adopted by vendors and their product offerings, Read Sample Report
.
Geographical Market Analysis
North America will account for 42% of market growth. US and Canada are the key markets for liver cancer drugs in North America. Compared to the markets in Europe and Asia, this region's market will grow more slowly.
Over the forecast period, the expansion of the liver cancer medications market in North America would be aided by the development and introduction of treatment regimens for the disease.
Furthermore, countries such as the US, Canada, Germany, UK, and China are expected to emerge as prominent markets for Liver Cancer Drugs Market during the forecast period.
Know more about this market's geographical distribution along with a detailed analysis of the top regions. Click Here for Sample Report.
Competitive Analysis
The competitive scenario provided in the liver cancer drugs market report analyzes, evaluates, and positions companies based on various performance indicators. Some of the factors considered for this analysis include the financial performance of companies over the past few years, growth strategies, product innovations, new product launches, investments, growth in market share, etc.
Market Segmentation
By
Type, the market is classified as immunotherapy and targeted therapy.
By
Geography, the market is classified as North America, Europe, Asia, and the Rest of the World (ROW).
To know about the market contribution of each segment –
Get the latest sample report now!
Key Market Drivers & Challenges:
Factors such as the
increasing incidence of liver cancer, and advancements in diagnostic methods will be crucial in driving the growth of the market. But factors such as the
only curative option available is surgical resection and transplantation will restrict the market growth. The holistic analysis of the drivers & challenges will help in deducing end goals and refining marketing strategies to gain a competitive edge.
Get a Sample
for highlights
on market Drivers & Challenges affecting Liver Cancer Drugs Market.
Customize Your Report
Don't miss out on the opportunity to speak to our analyst and know more insights about this market report. Our analysts can also help you customize this report according to your needs. Our analysts and industry experts will work directly with you to understand your requirements and provide you with customized data in a short amount of time.
Do reach out to our analysts for more customized reports as per your requirements.
Speak to an Analyst now!
Related Reports:
Rare Hemophilia Factors Market by Method and Geography - Forecast and Analysis 2022-2026
Obsessive-Compulsive Disorder Drugs Market by Product and Geography - Forecast and Analysis 2022-2026
Table of Contents
1 Executive Summary
1.1 Market overview
Exhibit 01: Executive Summary – Chart on Market Overview
Exhibit 02: Executive Summary – Data Table on Market Overview
Exhibit 03: Executive Summary – Chart on Global Market Characteristics
Exhibit 04: Executive Summary – Chart on Market by Geography
Exhibit 05: Executive Summary – Chart on Market Segmentation by Type
Exhibit 06: Executive Summary – Chart on Incremental Growth
Exhibit 07: Executive Summary – Data Table on Incremental Growth
Exhibit 08: Executive Summary – Chart on Vendor Market Positioning
2 Market Landscape
2.1 Market ecosystem
Exhibit 09: Parent market
Exhibit 10: Market Characteristics
3 Market Sizing
3.1 Market definition
Exhibit 11: Offerings of vendors included in the market definition
3.2 Market segment analysis
Exhibit 12: Market segments
3.3 Market size 2021
3.4 Market outlook: Forecast for 2021-2026
Exhibit 13: Chart on Global - Market size and forecast 2021-2026 ($ million)
Exhibit 14: Data Table on Global - Market size and forecast 2021-2026 ($ million)
Exhibit 15: Chart on Global Market: Year-over-year growth 2021-2026 (%)
Exhibit 16: Data Table on Global Market: Year-over-year growth 2021-2026 (%)
4 Five Forces Analysis
4.1 Five forces summary
Exhibit 17: Five forces analysis - Comparison between 2021 and 2026
4.2 Bargaining power of buyers
Exhibit 18: Bargaining power of buyers – Impact of key factors in 2021 and 2026
4.3 Bargaining power of suppliers
Exhibit 19: Bargaining power of suppliers – Impact of key factors in 2021 and 2026
4.4 Threat of new entrants
Exhibit 20: Threat of new entrants – Impact of key factors in 2021 and 2026
4.5 Threat of substitutes
Exhibit 21: Threat of substitutes – Impact of key factors in 2021 and 2026
4.6 Threat of rivalry
Exhibit 22: Threat of rivalry – Impact of key factors in 2021 and 2026
4.7 Market condition
Exhibit 23: Chart on Market condition - Five forces 2021 and 2026
5 Market Segmentation by Type
5.1 Market segments
Exhibit 24: Chart on Type - Market share 2021-2026 (%)
Exhibit 25: Data Table on Type - Market share 2021-2026 (%)
5.2 Comparison by Type
Exhibit 26: Chart on Comparison by Type
Exhibit 27: Data Table on Comparison by Type
5.3 Immunotherapy - Market size and forecast 2021-2026
Exhibit 28: Chart on Immunotherapy - Market size and forecast 2021-2026 ($ million)
Exhibit 29: Data Table on Immunotherapy - Market size and forecast 2021-2026 ($ million)
Exhibit 30: Chart on Immunotherapy - Year-over-year growth 2021-2026 (%)
Exhibit 31: Data Table on Immunotherapy - Year-over-year growth 2021-2026 (%)
5.4 Targeted therapy - Market size and forecast 2021-2026
Exhibit 32: Chart on Targeted therapy - Market size and forecast 2021-2026 ($ million)
Exhibit 33: Data Table on Targeted therapy - Market size and forecast 2021-2026 ($ million)
Exhibit 34: Chart on Targeted therapy - Year-over-year growth 2021-2026 (%)
Exhibit 35: Data Table on Targeted therapy - Year-over-year growth 2021-2026 (%)
5.5 Market opportunity by Type
Exhibit 36: Market opportunity by Type ($ million)
6 Customer Landscape
6.1 Customer landscape overview
Exhibit 37: Analysis of price sensitivity, lifecycle, customer purchase basket, adoption rates, and purchase criteria
7 Geographic Landscape
7.1 Geographic segmentation
Exhibit 38: Chart on Market share by geography 2021-2026 (%)
Exhibit 39: Data Table on Market share by geography 2021-2026 (%)
7.2 Geographic comparison
Exhibit 40: Chart on Geographic comparison
Exhibit 41: Data Table on Geographic comparison
7.3 North America - Market size and forecast 2021-2026
Exhibit 42: Chart on North America - Market size and forecast 2021-2026 ($ million)
Exhibit 43: Data Table on North America - Market size and forecast 2021-2026 ($ million)
Exhibit 44: Chart on North America - Year-over-year growth 2021-2026 (%)
Exhibit 45: Data Table on North America - Year-over-year growth 2021-2026 (%)
7.4 Europe - Market size and forecast 2021-2026
Exhibit 46: Chart on Europe - Market size and forecast 2021-2026 ($ million)
Exhibit 47: Data Table on Europe - Market size and forecast 2021-2026 ($ million)
Exhibit 48: Chart on Europe - Year-over-year growth 2021-2026 (%)
Exhibit 49: Data Table on Europe - Year-over-year growth 2021-2026 (%)
7.5 Asia - Market size and forecast 2021-2026
Exhibit 50: Chart on Asia - Market size and forecast 2021-2026 ($ million)
Exhibit 51: Data Table on Asia - Market size and forecast 2021-2026 ($ million)
Exhibit 52: Chart on Asia - Year-over-year growth 2021-2026 (%)
Exhibit 53: Data Table on Asia - Year-over-year growth 2021-2026 (%)
7.6 Rest of World (ROW) - Market size and forecast 2021-2026
Exhibit 54: Chart on Rest of World (ROW) - Market size and forecast 2021-2026 ($ million)
Exhibit 55: Data Table on Rest of World (ROW) - Market size and forecast 2021-2026 ($ million)
Exhibit 56: Chart on Rest of World (ROW) - Year-over-year growth 2021-2026 (%)
Exhibit 57: Data Table on Rest of World (ROW) - Year-over-year growth 2021-2026 (%)
7.7 US - Market size and forecast 2021-2026
Exhibit 58: Chart on US - Market size and forecast 2021-2026 ($ million)
Exhibit 59: Data Table on US - Market size and forecast 2021-2026 ($ million)
Exhibit 60: Chart on US - Year-over-year growth 2021-2026 (%)
Exhibit 61: Data Table on US - Year-over-year growth 2021-2026 (%)
7.8 Germany - Market size and forecast 2021-2026
Exhibit 62: Chart on Germany - Market size and forecast 2021-2026 ($ million)
Exhibit 63: Data Table on Germany - Market size and forecast 2021-2026 ($ million)
Exhibit 64: Chart on Germany - Year-over-year growth 2021-2026 (%)
Exhibit 65: Data Table on Germany - Year-over-year growth 2021-2026 (%)
7.9 China - Market size and forecast 2021-2026
Exhibit 66: Chart on China - Market size and forecast 2021-2026 ($ million)
Exhibit 67: Data Table on China - Market size and forecast 2021-2026 ($ million)
Exhibit 68: Chart on China - Year-over-year growth 2021-2026 (%)
Exhibit 69: Data Table on China - Year-over-year growth 2021-2026 (%)
7.10 Canada - Market size and forecast 2021-2026
Exhibit 70: Chart on Canada - Market size and forecast 2021-2026 ($ million)
Exhibit 71: Data Table on Canada - Market size and forecast 2021-2026 ($ million)
Exhibit 72: Chart on Canada - Year-over-year growth 2021-2026 (%)
Exhibit 73: Data Table on Canada - Year-over-year growth 2021-2026 (%)
7.11 UK - Market size and forecast 2021-2026
Exhibit 74: Chart on UK - Market size and forecast 2021-2026 ($ million)
Exhibit 75: Data Table on UK - Market size and forecast 2021-2026 ($ million)
Exhibit 76: Chart on UK - Year-over-year growth 2021-2026 (%)
Exhibit 77: Data Table on UK - Year-over-year growth 2021-2026 (%)
7.12 Market opportunity by geography
Exhibit 78: Market opportunity by geography ($ million)
8 Drivers, Challenges, and Trends
8.1 Market drivers
8.2 Market challenges
8.3 Impact of drivers and challenges
Exhibit 79: Impact of drivers and challenges in 2021 and 2026
8.4 Market trends
9 Vendor Landscape
9.1 Overview
9.2 Vendor landscape
Exhibit 80: Overview on Criticality of inputs and Factors of differentiation
9.3 Landscape disruption
Exhibit 81: Overview on factors of disruption
9.4 Industry risks
Exhibit 82: Impact of key risks on business
10 Vendor Analysis
10.1 Vendors covered
Exhibit 83: Vendors covered
10.2 Market positioning of vendors
Exhibit 84: Matrix on vendor position and classification
10.3 AstraZeneca Plc
Exhibit 85: AstraZeneca Plc - Overview
Exhibit 86: AstraZeneca Plc - Product / Service
Exhibit 87: AstraZeneca Plc - Key news
Exhibit 88: AstraZeneca Plc - Key offerings
10.4 Bayer AG
Exhibit 89: Bayer AG - Overview
Exhibit 90: Bayer AG - Business segments
Exhibit 91: Bayer AG - Key news
Exhibit 92: Bayer AG - Key offerings
Exhibit 93: Bayer AG - Segment focus
Exhibit 94: Bristol-Myers Squibb Co. - Overview
Exhibit 95: Bristol-Myers Squibb Co. - Product / Service
Exhibit 96: Bristol-Myers Squibb Co. - Key offerings
10.6 Eisai Co. Ltd.
Exhibit 97: Eisai Co. Ltd. - Overview
Exhibit 98: Eisai Co. Ltd. - Business segments
Exhibit 99: Eisai Co. Ltd. - Key offerings
Exhibit 100: Eisai Co. Ltd. - Segment focus
10.7 Eli Lilly and Co.
Exhibit 101: Eli Lilly and Co. - Overview
Exhibit 102: Eli Lilly and Co. - Business segments
Exhibit 103: Eli Lilly and Co. - Key offerings
Exhibit 104: Eli Lilly and Co. - Segment focus
10.8 Eureka Therapeutics
Exhibit 105: Eureka Therapeutics - Overview
Exhibit 106: Eureka Therapeutics - Product / Service
Exhibit 107: Eureka Therapeutics - Key offerings
10.9 Gilead Sciences Inc.
Exhibit 108: Gilead Sciences Inc. - Overview
Exhibit 109: Gilead Sciences Inc. - Business segments
Exhibit 110: Gilead Sciences Inc. - Key news
Exhibit 111: Gilead Sciences Inc. - Key offerings
Exhibit 112: Gilead Sciences Inc. - Segment focus
Exhibit 113: Jiangsu Hengrui Pharmaceuticals Co. Ltd. - Overview
Exhibit 114: Jiangsu Hengrui Pharmaceuticals Co. Ltd. - Product / Service
Exhibit 115: Jiangsu Hengrui Pharmaceuticals Co. Ltd. - Key offerings
10.11 Lion TCR Pte. Ltd
Exhibit 116: Lion TCR Pte. Ltd - Overview
Exhibit 117: Lion TCR Pte. Ltd - Product / Service
Exhibit 118: Lion TCR Pte. Ltd - Key offerings
10.12 Merck and Co. Inc.
Exhibit 119: Merck and Co. Inc. - Overview
Exhibit 120: Merck and Co. Inc. - Business segments
Exhibit 121: Merck and Co. Inc. - Key news
Exhibit 122: Merck and Co. Inc. - Key offerings
Exhibit 123: Merck and Co. Inc. - Segment focus
11.1 Scope of the report
11.2 Inclusions and exclusions checklist
Exhibit 124: Inclusions checklist
Exhibit 125: Exclusions checklist
11.3 Currency conversion rates for US$
Exhibit 126: Currency conversion rates for US$
11.4 Research methodology
Exhibit 127: Research methodology
Exhibit 128: Validation techniques employed for market sizing
Exhibit 129: Information sources
11.5 List of abbreviations
Exhibit 130: List of abbreviations
About Us:
Technavio is a leading global technology research and advisory company. Their research and analysis focus on emerging market trends and provides actionable insights to help businesses identify market opportunities and develop effective strategies to optimize their market positions. With over 500 specialized analysts, Technavio's report library consists of more than 17,000 reports and counting, covering 800 technologies, spanning across 50 countries. Their client base consists of enterprises of all sizes, including more than 100 Fortune 500 companies. This growing client base relies on Technavio's comprehensive coverage, extensive research, and actionable market insights to identify opportunities in existing and potential markets and assess their competitive positions within changing market scenarios.
Contact
Technavio Research
Jesse Maida
US: +1 844 364 1100
UK: +44 203 893 3200
Email: [email protected]
Website: www.technavio.com/
SOURCE Technavio
For more details,please visit the original website
The content of the article does not represent any opinions of Synapse and its affiliated companies. If there is any copyright infringement or error, please contact us, and we will deal with it within 24 hours.
Indications
Targets
-Drugs
-Hot reports


Get started for free today!
Accelerate Strategic R&D decision making with Synapse, PatSnap’s AI-powered Connected Innovation Intelligence Platform Built for Life Sciences Professionals.
Start your data trial now!
Synapse data is also accessible to external entities via APIs or data packages. Leverages most recent intelligence information, enabling fullest potential.