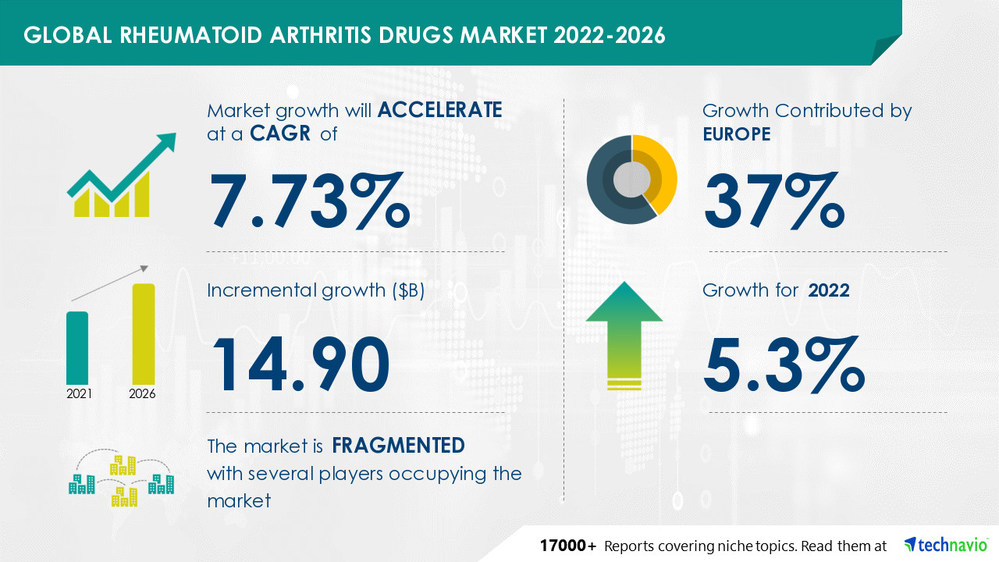
Rheumatoid Arthritis Drugs Market Size to Grow by USD 14.90 Billion | 37% of the growth will originate from Europe | Technavio
24 Jun 2022
Small molecular drugAcquisitionCollaborate
NEW YORK, June 24, 2022 /PRNewswire/ -- The latest market analysis report titled
Rheumatoid Arthritis Drugs Market by Type and Geography - Forecast and Analysis 2022-2026 has been added to Technavio's catalog. The report predicts the market to grow at a potential growth difference of USD 14.90 billion from 2021 to 2026. The market is anticipated to witness an accelerating growth momentum at a CAGR of 7.73% during the forecast period. The
unmet needs for safer biologics for RA is notably driving the rheumatoid arthritis drugs market growth. In addition,
the high cost of RA drugs is a rheumatoid arthritis drugs market trend that is expected to have a positive impact in the coming years. Furthermore,
the patient non-adherence to treatment will emerge as a major challenge for the rheumatoid arthritis drugs market during the forecast period.
Preview
Source: PRNewswire
Technavio has announced its latest market research report titled Rheumatoid Arthritis Drugs Market by Type and Geography - Forecast and Analysis 2022-2026
View Market Report Sample
to Get CAGR and YOY growth variance analysis
Vendor Landscape
The market is fragmented, and the degree of fragmentation will accelerate during the forecast period. Competitors have to focus on differentiating their product offerings with unique value propositions to strengthen their foothold in the market.
Market vendors also have to leverage the existing growth prospects in the fast-growing segments, while maintaining their positions in the slow-growing segments.
AbbVie Inc., Amgen Inc., Astellas Pharma Inc., Bristol Myers Squibb Co., Cyxone AB, Eli Lilly and Co., F. Hoffmann La Roche Ltd., Galmed Pharmaceuticals Ltd., Genor BioPharma Holding Ltd., Gilead Sciences Inc., GlaxoSmithKline Plc, Johnson and Johnson, Kangstem Biotech Co. Ltd., Novartis AG, Oryn Therapeutics, Pfizer Inc., Sanofi, Sorrento Therapeutics Inc., Taisho Pharmaceutical Holdings Co. Ltd., and UCB SA are among some of the major market participants.
Vendors are deploying growth strategies such as aiming at strategic collaborations and acquisitions with other manufacturers to expand their product manufacturing and address the demand of an expanding patient pool to compete in the market.
To make the most of the opportunities and recover from post pandemic impact, market vendors should focus more on the growth prospects in the fast-growing segments, while maintaining their positions in the slow-growing segments.
The rheumatoid arthritis drugs market forecast report offers in-depth insights into key vendor profiles. The profiles include information on the production, sustainability, and prospects of the leading companies. Companies such as AbbVie Inc. offers rheumatoid arthritis drug namely Rinvoq.
Buy this report sample now
and get strategic insights on the vendors and their product offerings
Rheumatoid Arthritis Drugs Market Segment Highlights
Type
Biologics: The biologics segment held the largest rheumatoid arthritis drugs market share in 2021. The segment will continue to account for the highest revenue throughout the forecast period. The growth of the segment is attributed to the promising results of biologics for the complete treatment of RA compared with conventional DMARDs. The patents for some biologics are expected to expire during the forecast period.
Geography
Europe: 37% of the market's growth will originate from Europe during the forecast period. Germany, UK, and France are the key markets for rheumatoid arthritis drugs in Europe. Market growth in this region will be slower than the growth of the market in the North American and Asian regions. The presence of vendors in the EU, such as Novartis and UCB Pharma will facilitate the rheumatoid arthritis drugs market growth in Europe over the forecast period.
North America
Asia
Rest Of World (ROW)
Get Segment-based Contribution of Each Segment as you Download Report Sample
Rheumatoid Arthritis Drugs Market Scope
Technavio presents a detailed picture of the market by the way of study, synthesis, and summation of data from multiple sources. The rheumatoid arthritis drugs market report covers the following areas:
Rheumatoid Arthritis Drugs Market Size
Rheumatoid Arthritis Drugs Market Trends
Rheumatoid Arthritis Drugs Market Industry Analysis
Rheumatoid Arthritis Drugs Market Takeaways
CAGR of the market during the forecast period 2022-2026
Detailed information on factors that will assist rheumatoid arthritis drugs market growth during the next five years
Estimation of the rheumatoid arthritis drugs market size and its contribution to the parent market
Predictions on upcoming trends and changes in consumer behavior
The growth of the rheumatoid arthritis drugs market
Analysis of the market's competitive landscape and detailed information on vendors
Comprehensive details of factors that will challenge the growth of rheumatoid arthritis drugs market, vendors
Related Reports:
POC Molecular Diagnostics Market by Product, Application, and Geography - Forecast and Analysis 2022-2026
Animal Health Diagnostics Market by Type and Geography - Forecast and Analysis 2021-2025
Table of Contents:
1 Executive Summary
1.1 Market overview
Exhibit 01: Executive Summary – Chart on Market Overview
Exhibit 02: Executive Summary – Data Table on Market Overview
Exhibit 03: Executive Summary – Chart on Global Market Characteristics
Exhibit 04: Executive Summary – Chart on Market by Geography
Exhibit 05: Executive Summary – Chart on Market Segmentation by Type
Exhibit 06: Executive Summary – Chart on Incremental Growth
Exhibit 07: Executive Summary – Data Table on Incremental Growth
Exhibit 08: Executive Summary – Chart on Vendor Market Positioning
2 Market Landscape
2.1 Market ecosystem
Exhibit 09: Parent market
Exhibit 10: Market Characteristics
3 Market Sizing
3.1 Market definition
Exhibit 11: Offerings of vendors included in the market definition
3.2 Market segment analysis
Exhibit 12: Market segments
3.3 Market size 2021
3.4 Market outlook: Forecast for 2021-2026
Exhibit 13: Chart on Global - Market size and forecast 2021-2026 ($ million)
Exhibit 14: Data Table on Global - Market size and forecast 2021-2026 ($ million)
Exhibit 15: Chart on Global Market: Year-over-year growth 2021-2026 (%)
Exhibit 16: Data Table on Global Market: Year-over-year growth 2021-2026 (%)
4 Five Forces Analysis
4.1 Five forces summary
Exhibit 17: Five forces analysis - Comparison between2021 and 2026
4.2 Bargaining power of buyers
Exhibit 18: Chart on Bargaining power of buyers – Impact of key factors 2021 and 2026
4.3 Bargaining power of suppliers
Exhibit 19: Bargaining power of suppliers – Impact of key factors in 2021 and 2026
4.4 Threat of new entrants
Exhibit 20: Threat of new entrants – Impact of key factors in 2021 and 2026
4.5 Threat of substitutes
Exhibit 21: Threat of substitutes – Impact of key factors in 2021 and 2026
4.6 Threat of rivalry
Exhibit 22: Threat of rivalry – Impact of key factors in 2021 and 2026
4.7 Market condition
Exhibit 23: Chart on Market condition - Five forces 2021 and 2026
5 Market Segmentation by Type
5.1 Market segments
Exhibit 24: Chart on Type - Market share 2021-2026 (%)
Exhibit 25: Data Table on Type - Market share 2021-2026 (%)
5.2 Comparison by Type
Exhibit 26: Chart on Comparison by Type
Exhibit 27: Data Table on Comparison by Type
5.3 Biologics - Market size and forecast 2021-2026
Exhibit 28: Chart on Biologics - Market size and forecast 2021-2026 ($ million)
Exhibit 29: Data Table on Biologics - Market size and forecast 2021-2026 ($ million)
Exhibit 30: Chart on Biologics - Year-over-year growth 2021-2026 (%)
Exhibit 31: Data Table on Biologics - Year-over-year growth 2021-2026 (%)
5.4 Small molecules - Market size and forecast 2021-2026
Exhibit 32: Chart on Small molecules - Market size and forecast 2021-2026 ($ million)
Exhibit 33: Data Table on Small molecules - Market size and forecast 2021-2026 ($ million)
Exhibit 34: Chart on Small molecules - Year-over-year growth 2021-2026 (%)
Exhibit 35: Data Table on Small molecules - Year-over-year growth 2021-2026 (%)
5.5 Market opportunity by Type
Exhibit 36: Market opportunity by Type ($ million)
6 Customer Landscape
6.1 Customer landscape overview
Exhibit 37: Analysis of price sensitivity, lifecycle, customer purchase basket, adoption rates, and purchase criteria
7 Geographic Landscape
7.1 Geographic segmentation
Exhibit 38: Chart on Market share by geography 2021-2026 (%)
Exhibit 39: Data Table on Market share by geography 2021-2026 (%)
7.2 Geographic comparison
Exhibit 40: Chart on Geographic comparison
Exhibit 41: Data Table on Geographic comparison
7.3 Europe - Market size and forecast 2021-2026
Exhibit 42: Chart on Europe - Market size and forecast 2021-2026 ($ million)
Exhibit 43: Data Table on Europe - Market size and forecast 2021-2026 ($ million)
Exhibit 44: Chart on Europe - Year-over-year growth 2021-2026 (%)
Exhibit 45: Data Table on Europe - Year-over-year growth 2021-2026 (%)
7.4 North America - Market size and forecast 2021-2026
Exhibit 46: Chart on North America - Market size and forecast 2021-2026 ($ million)
Exhibit 47: Data Table on North America - Market size and forecast 2021-2026 ($ million)
Exhibit 48: Chart on North America - Year-over-year growth 2021-2026 (%)
Exhibit 49: Data Table on North America - Year-over-year growth 2021-2026 (%)
7.5 Asia - Market size and forecast 2021-2026
Exhibit 50: Chart on Asia - Market size and forecast 2021-2026 ($ million)
Exhibit 51: Data Table on Asia - Market size and forecast 2021-2026 ($ million)
Exhibit 52: Chart on Asia - Year-over-year growth 2021-2026 (%)
Exhibit 53: Data Table on Asia - Year-over-year growth 2021-2026 (%)
7.6 Rest of World (ROW) - Market size and forecast 2021-2026
Exhibit 54: Chart on Rest of World (ROW) - Market size and forecast 2021-2026 ($ million)
Exhibit 55: Data Table on Rest of World (ROW) - Market size and forecast 2021-2026 ($ million)
Exhibit 56: Chart on Rest of World (ROW) - Year-over-year growth 2021-2026 (%)
Exhibit 57: Data Table on Rest of World (ROW) - Year-over-year growth 2021-2026 (%)
7.7 US - Market size and forecast 2021-2026
Exhibit 58: Chart on US - Market size and forecast 2021-2026 ($ million)
Exhibit 59: Data Table on US - Market size and forecast 2021-2026 ($ million)
Exhibit 60: Chart on US - Year-over-year growth 2021-2026 (%)
Exhibit 61: Data Table on US - Year-over-year growth 2021-2026 (%)
7.8 Germany - Market size and forecast 2021-2026
Exhibit 62: Chart on Germany - Market size and forecast 2021-2026 ($ million)
Exhibit 63: Data Table on Germany - Market size and forecast 2021-2026 ($ million)
Exhibit 64: Chart on Germany - Year-over-year growth 2021-2026 (%)
Exhibit 65: Data Table on Germany - Year-over-year growth 2021-2026 (%)
7.9 UK - Market size and forecast 2021-2026
Exhibit 66: Chart on UK - Market size and forecast 2021-2026 ($ million)
Exhibit 67: Data Table on UK - Market size and forecast 2021-2026 ($ million)
Exhibit 68: Chart on UK - Year-over-year growth 2021-2026 (%)
Exhibit 69: Data Table on UK - Year-over-year growth 2021-2026 (%)
7.10 France - Market size and forecast 2021-2026
Exhibit 70: Chart on France - Market size and forecast 2021-2026 ($ million)
Exhibit 71: Data Table on France - Market size and forecast 2021-2026 ($ million)
Exhibit 72: Chart on France - Year-over-year growth 2021-2026 (%)
Exhibit 73: Data Table on France - Year-over-year growth 2021-2026 (%)
7.11 China - Market size and forecast 2021-2026
Exhibit 74: Chart on China - Market size and forecast 2021-2026 ($ million)
Exhibit 75: Data Table on China - Market size and forecast 2021-2026 ($ million)
Exhibit 76: Chart on China - Year-over-year growth 2021-2026 (%)
Exhibit 77: Data Table on China - Year-over-year growth 2021-2026 (%)
7.12 Market opportunity by geography
Exhibit 78: Market opportunity by geography ($ million)
8 Drivers, Challenges, and Trends
8.1 Market drivers
8.2 Market challenges
8.3 Impact of drivers and challenges
Exhibit 79: Impact of drivers and challenges in 2021 and 2026
8.4 Market trends
9 Vendor Landscape
9.1 Overview
9.2 Vendor landscape
Exhibit 80: Overview on Criticality of inputs and Factors of differentiation
9.3 Landscape disruption
Exhibit 81: Overview on factors of disruption
9.4 Industry risks
Exhibit 82: Impact of key risks on business
10 Vendor Analysis
10.1 Vendors covered
Exhibit 83: Vendors covered
10.2 Market positioning of vendors
Exhibit 84: Matrix on vendor position and classification
10.3 AbbVie Inc.
Exhibit 85: AbbVie Inc. - Overview
Exhibit 86: AbbVie Inc. - Product / Service
Exhibit 87: AbbVie Inc. - Key offerings
10.4 Amgen Inc.
Exhibit 88: Amgen Inc. - Overview
Exhibit 89: Amgen Inc. - Product / Service
Exhibit 90: Amgen Inc. - Key offerings
Exhibit 91: Bristol Myers Squibb Co. - Overview
Exhibit 92: Bristol Myers Squibb Co. - Product / Service
Exhibit 93: Bristol Myers Squibb Co. - Key offerings
10.6 Eli Lilly and Co.
Exhibit 94: Eli Lilly and Co. - Overview
Exhibit 95: Eli Lilly and Co. - Product / Service
Exhibit 96: Eli Lilly and Co. - Key offerings
Exhibit 97: F. Hoffmann La Roche Ltd. - Overview
Exhibit 98: F. Hoffmann La Roche Ltd. - Business segments
Exhibit 99: F. Hoffmann La Roche Ltd. - Key news
Exhibit 100: F. Hoffmann La Roche Ltd. - Key offerings
Exhibit 101: F. Hoffmann La Roche Ltd. - Segment focus
10.8 Johnson and Johnson
Exhibit 102: Johnson and Johnson - Overview
Exhibit 103: Johnson and Johnson - Business segments
Exhibit 104: Johnson and Johnson - Key news
Exhibit 105: Johnson and Johnson - Key offerings
Exhibit 106: Johnson and Johnson - Segment focus
10.9 Novartis AG
Exhibit 107: Novartis AG - Overview
Exhibit 108: Novartis AG - Business segments
Exhibit 109: Novartis AG - Key offerings
Exhibit 110: Novartis AG - Segment focus
10.10 Pfizer Inc.
Exhibit 111: Pfizer Inc. - Overview
Exhibit 112: Pfizer Inc. - Product / Service
Exhibit 113: Pfizer Inc. - Key news
Exhibit 114: Pfizer Inc. - Key offerings
10.11 Sanofi
Exhibit 115: Sanofi - Overview
Exhibit 116: Sanofi - Business segments
Exhibit 117: Sanofi - Key news
Exhibit 118: Sanofi - Key offerings
Exhibit 119: Sanofi - Segment focus
10.12 UCB SA
Exhibit 120: UCB SA - Overview
Exhibit 121: UCB SA - Product / Service
Exhibit 122: UCB SA - Key offerings
11.1 Scope of the report
11.2 Inclusions and exclusions checklist
Exhibit 123: Inclusions checklist
Exhibit 124: Exclusions checklist
11.3 Currency conversion rates for US$
Exhibit 125: Currency conversion rates for US$
11.4 Research methodology
Exhibit 126: Research methodology
Exhibit 127: Validation techniques employed for market sizing
Exhibit 128: Information sources
11.5 List of abbreviations
Exhibit 129: List of abbreviations
About Us
Technavio is a leading global technology research and advisory company. Their research and analysis focus on emerging market trends and provides actionable insights to help businesses identify market opportunities and develop effective strategies to optimize their market positions. With over 500 specialized analysts, Technavio's report library consists of more than 17,000 reports and counting, covering 800 technologies, spanning across 50 countries. Their client base consists of enterprises of all sizes, including more than 100 Fortune 500 companies. This growing client base relies on Technavio's comprehensive coverage, extensive research, and actionable market insights to identify opportunities in existing and potential markets and assess their competitive positions within changing market scenarios.
Contact
Technavio Research
Jesse Maida
US: +1 844 364 1100
UK: +44 203 893 3200
Email: [email protected]
Website: www.technavio.com/
SOURCE Technavio
For more details,please visit the original website
The content of the article does not represent any opinions of Synapse and its affiliated companies. If there is any copyright infringement or error, please contact us, and we will deal with it within 24 hours.
Organizations
Indications
Targets
-Drugs
Hot reports


Get started for free today!
Accelerate Strategic R&D decision making with Synapse, PatSnap’s AI-powered Connected Innovation Intelligence Platform Built for Life Sciences Professionals.
Start your data trial now!
Synapse data is also accessible to external entities via APIs or data packages. Leverages most recent intelligence information, enabling fullest potential.