Anaplastic Thyroid Cancer Drugs Market to record USD 230.53 Mn growth; Akorn Inc., Amneal Pharmaceuticals Inc., Bayer AG identified as key vendors - Technavio
09 Nov 2022
Generic Drug
NEW YORK, Nov. 9, 2022 /PRNewswire/ -- The "
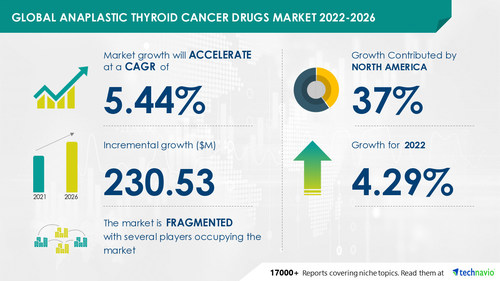
Anaplastic Thyroid Cancer Drugs Market by Product and Geography - Forecast and Analysis 2022-2026" report has been added to Technavio's offering. The report expects the market size to grow by USD 230.53 million, accelerating at a CAGR of 5.44% during the forecast period. The global anaplastic thyroid cancer drugs market is fragmented with more than 20 companies and various types of branded drugs and generics of some chemotherapeutics. The competition is high among vendors owing to the introduction of novel therapies in the market. Also, the presence of a strong pipeline of drugs used for treating anaplastic thyroid cancer will further intensify the competition during the forecast period. Furthermore, the market will witness the approvals of some drugs during the forecast period, which will intensify the competition among vendors.
Get deeper insights into the vendor landscape and make informed decisions. Buy Report Now!
Continue Reading
Preview
Source: PRNewswire
Technavio has announced its latest market research report titled Global Anaplastic Thyroid Cancer Drugs Market 2022-2026
Anaplastic Thyroid Cancer Drugs Market 2022-2026: Segmentation
With a focus on identifying dominant industry influencers, Technavio's reports present a detailed study by the way of synthesis, and summation of data from multiple sources. This report offers an up-to-date analysis of the current market scenario, the latest trends and drivers, and the overall market environment.
The report also covers the following areas
:
Anaplastic Thyroid Cancer Drugs Market Size
Anaplastic Thyroid Cancer Drugs Market Trends
Anaplastic Thyroid Cancer Drugs Market Industry Analysis
Anaplastic Thyroid Cancer Drugs Market 2022-2026: Segmentation
Product
Chemotherapy
The market growth will be significant in the chemotherapy segment during the forecast period. The growth of the chemotherapy segment can be mainly attributed to the high prevalence of thyroid cancer and chemotherapy being the second-line treatment for anaplastic thyroid cancer after surgery. The incidence rate of thyroid cancer is increasing at a significant rate, almost increasing threefold every ten years. Although the majority of thyroid tumors are curable, about 2%-3% of thyroid cancers are refractory to standard treatments. These types include undifferentiated, highly aggressive, and mostly chemo-resistant tumors and are known as anaplastic thyroid cancer.
Geography
North America
Europe
Asia
Rest Of World (ROW)
37% of the market growth will come from North America during the forecast period. The market growth in North America is primarily attributed to the increased cases of thyroid cancer in the region. The increasing geriatric population in the region is another factor propelling the growth of the anaplastic thyroid cancer drugs market in North America.
Identify other potential segments and regions in the market. Download Free Sample Report
Anaplastic Thyroid Cancer Drugs Market 2022-2026: Vendor Analysis and Scope
Some of the major vendors of the anaplastic thyroid cancer drugs market in l4 industry include Akorn Inc., Amneal Pharmaceuticals Inc., Bayer AG, Bristol Myers Squibb Co., Cipla Ltd., Daiichi Sankyo Co. Ltd., Dr. Reddys Laboratories Ltd., Eisai Co. Ltd., Exelixis Inc., Hikma Pharmaceuticals Plc, Intas Pharmaceuticals Ltd., Johnson and Johnson, Medtronic Plc, Merck KGaA, Novartis AG, Pfizer Inc., Sanofi, Sun Pharmaceutical Industries Ltd., Takeda Pharmaceutical Co. Ltd., and Viatris Inc.
To help businesses improve their market position, Technavio's report provides a detailed analysis of around 25 vendors operating in the market. Backed with competitive intelligence and benchmarking, our research report on the anaplastic thyroid cancer drugs market is designed to provide entry support, customer profile, & M&As as well as go-to-market strategy support.
The High prevalence of thyroid cancer, the introduction of targeted therapies, and the rising geriatric population will offer immense growth opportunities. To leverage the current opportunities, market vendors must strengthen their foothold in the fast-growing segments while maintaining their positions in the slow-growing segments.
Technavio's library includes over 17,000+ reports covering more than 2,000 emerging technologies. Subscribe to our "Basic Plan" at just USD 5,000 and get lifetime access to our Technavio Insights
Anaplastic Thyroid Cancer Drugs Market 2022-2026: Key Highlights
CAGR of the market during the forecast period 2022-2026
Detailed information on factors that will assist anaplastic thyroid cancer drugs market growth during the next five years
Estimation of the anaplastic thyroid cancer drugs market size and its contribution to the parent market
Predictions on upcoming trends and changes in consumer behavior
The growth of the anaplastic thyroid cancer drugs market
Analysis of the market's competitive landscape and detailed information on vendors
Comprehensive details of factors that will challenge the growth of anaplastic thyroid cancer drugs market vendors
Related Reports:
The
BRAF kinase inhibitorsBRAF kinase inhibitors market share is expected to accelerate at a CAGR of 7.73%, and reach an estimated value of USD 1.19 billion by 2026. The high target affinity and specificity of BRAF kinase inhibitorsBRAF kinase inhibitors is notably driving the BRAF kinase inhibitorsBRAF kinase inhibitors market growth, although factors such as the availability of substitute therapies may impede the market growth.
The
cancer biologics market share is expected to increase by USD 34.97 billion from 2021 to 2026, and the market's growth momentum will accelerate at a CAGR of 8.91%. The rising global incidence of cancer is notably driving the cancer biologics market growth, although factors such as the high cost of cancer biologics may impede market growth.
Table of contents:
1 Executive Summary
1.1 Market overview
Exhibit 01: Executive Summary – Chart on Market Overview
Exhibit 02: Executive Summary – Data Table on Market Overview
Exhibit 03: Executive Summary – Chart on Global Market Characteristics
Exhibit 04: Executive Summary – Chart on Market by Geography
Exhibit 05: Executive Summary – Chart on Market Segmentation by Product
Exhibit 06: Executive Summary – Chart on Incremental Growth
Exhibit 07: Executive Summary – Data Table on Incremental Growth
Exhibit 08: Executive Summary – Chart on Vendor Market Positioning
2 Market Landscape
2.1 Market ecosystem
Exhibit 09: Parent market
Exhibit 10: Market Characteristics
3 Market Sizing
3.1 Market definition
Exhibit 11: Offerings of vendors included in the market definition
3.2 Market segment analysis
Exhibit 12: Market segments
3.3 Market size 2021
3.4 Market outlook: Forecast for 2021-2026
Exhibit 13: Chart on Global - Market size and forecast 2021-2026 ($ million)
Exhibit 14: Data Table on Global - Market size and forecast 2021-2026 ($ million)
Exhibit 15: Chart on Global Market: Year-over-year growth 2021-2026 (%)
Exhibit 16: Data Table on Global Market: Year-over-year growth 2021-2026 (%)
4 Five Forces Analysis
4.1 Five forces summary
Exhibit 17: Five forces analysis - Comparison between 2021 and 2026
4.2 Bargaining power of buyers
Exhibit 18: Chart on Bargaining power of buyers – Impact of key factors 2021 and 2026
4.3 Bargaining power of suppliers
Exhibit 19: Bargaining power of suppliers – Impact of key factors in 2021 and 2026
4.4 Threat of new entrants
Exhibit 20: Threat of new entrants – Impact of key factors in 2021 and 2026
4.5 Threat of substitutes
Exhibit 21: Threat of substitutes – Impact of key factors in 2021 and 2026
4.6 Threat of rivalry
Exhibit 22: Threat of rivalry – Impact of key factors in 2021 and 2026
4.7 Market condition
Exhibit 23: Chart on Market condition - Five forces 2021 and 2026
5 Market Segmentation by Product
5.1 Market segments
Exhibit 24: Chart on Product - Market share 2021-2026 (%)
Exhibit 25: Data Table on Product - Market share 2021-2026 (%)
5.2 Comparison by Product
Exhibit 26: Chart on Comparison by Product
Exhibit 27: Data Table on Comparison by Product
5.3 Chemotherapy - Market size and forecast 2021-2026
Exhibit 28: Chart on Chemotherapy - Market size and forecast 2021-2026 ($ million)
Exhibit 29: Data Table on Chemotherapy - Market size and forecast 2021-2026 ($ million)
Exhibit 30: Chart on Chemotherapy - Year-over-year growth 2021-2026 (%)
Exhibit 31: Data Table on Chemotherapy - Year-over-year growth 2021-2026 (%)
5.4 Novel therapy - Market size and forecast 2021-2026
Exhibit 32: Chart on Novel therapy - Market size and forecast 2021-2026 ($ million)
Exhibit 33: Data Table on Novel therapy - Market size and forecast 2021-2026 ($ million)
Exhibit 34: Chart on Novel therapy - Year-over-year growth 2021-2026 (%)
Exhibit 35: Data Table on Novel therapy - Year-over-year growth 2021-2026 (%)
5.5 Market opportunity by Product
Exhibit 36: Market opportunity by Product ($ million)
6 Customer Landscape
6.1 Customer landscape overview
Exhibit 37: Analysis of price sensitivity, lifecycle, customer purchase basket, adoption rates, and purchase criteria
7 Geographic Landscape
7.1 Geographic segmentation
Exhibit 38: Chart on Market share by geography 2021-2026 (%)
Exhibit 39: Data Table on Market share by geography 2021-2026 (%)
7.2 Geographic comparison
Exhibit 40: Chart on Geographic comparison
Exhibit 41: Data Table on Geographic comparison
7.3 North America - Market size and forecast 2021-2026
Exhibit 42: Chart on North America - Market size and forecast 2021-2026 ($ million)
Exhibit 43: Data Table on North America - Market size and forecast 2021-2026 ($ million)
Exhibit 44: Chart on North America - Year-over-year growth 2021-2026 (%)
Exhibit 45: Data Table on North America - Year-over-year growth 2021-2026 (%)
7.4 Europe - Market size and forecast 2021-2026
Exhibit 46: Chart on Europe - Market size and forecast 2021-2026 ($ million)
Exhibit 47: Data Table on Europe - Market size and forecast 2021-2026 ($ million)
Exhibit 48: Chart on Europe - Year-over-year growth 2021-2026 (%)
Exhibit 49: Data Table on Europe - Year-over-year growth 2021-2026 (%)
7.5 Asia - Market size and forecast 2021-2026
Exhibit 50: Chart on Asia - Market size and forecast 2021-2026 ($ million)
Exhibit 51: Data Table on Asia - Market size and forecast 2021-2026 ($ million)
Exhibit 52: Chart on Asia - Year-over-year growth 2021-2026 (%)
Exhibit 53: Data Table on Asia - Year-over-year growth 2021-2026 (%)
7.6 Rest of World (ROW) - Market size and forecast 2021-2026
Exhibit 54: Chart on Rest of World (ROW) - Market size and forecast 2021-2026 ($ million)
Exhibit 55: Data Table on Rest of World (ROW) - Market size and forecast 2021-2026 ($ million)
Exhibit 56: Chart on Rest of World (ROW) - Year-over-year growth 2021-2026 (%)
Exhibit 57: Data Table on Rest of World (ROW) - Year-over-year growth 2021-2026 (%)
7.7 US - Market size and forecast 2021-2026
Exhibit 58: Chart on US - Market size and forecast 2021-2026 ($ million)
Exhibit 59: Data Table on US - Market size and forecast 2021-2026 ($ million)
Exhibit 60: Chart on US - Year-over-year growth 2021-2026 (%)
Exhibit 61: Data Table on US - Year-over-year growth 2021-2026 (%)
7.8 Italy - Market size and forecast 2021-2026
Exhibit 62: Chart on Italy - Market size and forecast 2021-2026 ($ million)
Exhibit 63: Data Table on Italy - Market size and forecast 2021-2026 ($ million)
Exhibit 64: Chart on Italy - Year-over-year growth 2021-2026 (%)
Exhibit 65: Data Table on Italy - Year-over-year growth 2021-2026 (%)
7.9 China - Market size and forecast 2021-2026
Exhibit 66: Chart on China - Market size and forecast 2021-2026 ($ million)
Exhibit 67: Data Table on China - Market size and forecast 2021-2026 ($ million)
Exhibit 68: Chart on China - Year-over-year growth 2021-2026 (%)
Exhibit 69: Data Table on China - Year-over-year growth 2021-2026 (%)
7.10 Canada - Market size and forecast 2021-2026
Exhibit 70: Chart on Canada - Market size and forecast 2021-2026 ($ million)
Exhibit 71: Data Table on Canada - Market size and forecast 2021-2026 ($ million)
Exhibit 72: Chart on Canada - Year-over-year growth 2021-2026 (%)
Exhibit 73: Data Table on Canada - Year-over-year growth 2021-2026 (%)
7.11 India - Market size and forecast 2021-2026
Exhibit 74: Chart on India - Market size and forecast 2021-2026 ($ million)
Exhibit 75: Data Table on India - Market size and forecast 2021-2026 ($ million)
Exhibit 76: Chart on India - Year-over-year growth 2021-2026 (%)
Exhibit 77: Data Table on India - Year-over-year growth 2021-2026 (%)
7.12 Market opportunity by geography
Exhibit 78: Market opportunity by geography ($ million)
8 Drivers, Challenges, and Trends
8.1 Market drivers
8.2 Market challenges
8.3 Impact of drivers and challenges
Exhibit 79: Impact of drivers and challenges in 2021 and 2026
8.4 Market trends
9 Vendor Landscape
9.1 Overview
9.2 Vendor landscape
Exhibit 80: Overview on Criticality of inputs and Factors of differentiation
9.3 Landscape disruption
Exhibit 81: Overview on factors of disruption
9.4 Industry risks
Exhibit 82: Impact of key risks on business
10 Vendor Analysis
10.1 Vendors covered
Exhibit 83: Vendors covered
10.2 Market positioning of vendors
Exhibit 84: Matrix on vendor position and classification
10.3 Bayer AG
Exhibit 85: Bayer AG - Overview
Exhibit 86: Bayer AG - Business segments
Exhibit 87: Bayer AG - Key offerings
Exhibit 88: Bayer AG - Segment focus
Exhibit 89: Bristol Myers Squibb Co. - Overview
Exhibit 90: Bristol Myers Squibb Co. - Product / Service
Exhibit 91: Bristol Myers Squibb Co. - Key offerings
10.5 Eisai Co. Ltd.
Exhibit 92: Eisai Co. Ltd. - Overview
Exhibit 93: Eisai Co. Ltd. - Business segments
Exhibit 94: Eisai Co. Ltd. - Key offerings
Exhibit 95: Eisai Co. Ltd. - Segment focus
10.6 Johnson and Johnson
Exhibit 96: Johnson and Johnson - Overview
Exhibit 97: Johnson and Johnson - Business segments
Exhibit 98: Johnson and Johnson - Key news
Exhibit 99: Johnson and Johnson - Key offerings
Exhibit 100: Johnson and Johnson - Segment focus
10.7 Medtronic Plc
Exhibit 101: Medtronic Plc - Overview
Exhibit 102: Medtronic Plc - Business segments
Exhibit 103: Medtronic Plc - Key news
Exhibit 104: Medtronic Plc - Key offerings
Exhibit 105: Medtronic Plc - Segment focus
10.8 Merck KGaA
Exhibit 106: Merck KGaA - Overview
Exhibit 107: Merck KGaA - Business segments
Exhibit 108: Merck KGaA - Key news
Exhibit 109: Merck KGaA - Key offerings
Exhibit 110: Merck KGaA - Segment focus
10.9 Novartis AG
Exhibit 111: Novartis AG - Overview
Exhibit 112: Novartis AG - Business segments
Exhibit 113: Novartis AG - Key offerings
Exhibit 114: Novartis AG - Segment focus
10.10 Pfizer Inc.
Exhibit 115: Pfizer Inc. - Overview
Exhibit 116: Pfizer Inc. - Product / Service
Exhibit 117: Pfizer Inc. - Key news
Exhibit 118: Pfizer Inc. - Key offerings
Exhibit 119: Takeda Pharmaceutical Co. Ltd. - Overview
Exhibit 120: Takeda Pharmaceutical Co. Ltd. - Product / Service
Exhibit 121: Takeda Pharmaceutical Co. Ltd. - Key news
Exhibit 122: Takeda Pharmaceutical Co. Ltd. - Key offerings
10.12 Viatris Inc.
Exhibit 123: Viatris Inc. - Overview
Exhibit 124: Viatris Inc. - Business segments
Exhibit 125: Viatris Inc. - Key offerings
Exhibit 126: Viatris Inc. - Segment focus
11.1 Scope of the report
11.2 Inclusions and exclusions checklist
Exhibit 127: Inclusions checklist
Exhibit 128: Exclusions checklist
11.3 Currency conversion rates for US$
Exhibit 129: Currency conversion rates for US$
11.4 Research methodology
Exhibit 130: Research methodology
Exhibit 131: Validation techniques employed for market sizing
Exhibit 132: Information sources
11.5 List of abbreviations
Exhibit 133: List of abbreviations
About Us
Technavio is a leading global technology research and advisory company. Their research and analysis focus on emerging market trends and provides actionable insights to help businesses identify market opportunities and develop effective strategies to optimize their market positions. With over 500 specialized analysts, Technavio's report library consists of more than 17,000 reports and counting, covering 800 technologies, spanning across 50 countries. Their client base consists of enterprises of all sizes, including more than 100 Fortune 500 companies. This growing client base relies on Technavio's comprehensive coverage, extensive research, and actionable market insights to identify opportunities in existing and potential markets and assess their competitive positions within changing market scenarios.
Contact
Technavio Research
Jesse Maida
US: +1 844 364 1100
UK: +44 203 893 3200
Email: [email protected]
Website: www.technavio.com/
SOURCE Technavio
For more details,please visit the original website
The content of the article does not represent any opinions of Synapse and its affiliated companies. If there is any copyright infringement or error, please contact us, and we will deal with it within 24 hours.
Organizations
Targets
Drugs
Chat with Hiro
Hot reports


Get started for free today!
Accelerate Strategic R&D decision making with Synapse, PatSnap’s AI-powered Connected Innovation Intelligence Platform Built for Life Sciences Professionals.
Start your data trial now!
Synapse data is also accessible to external entities via APIs or data packages. Empower better decisions with the latest in pharmaceutical intelligence.