AlzheimerAlzheimer's Disease Therapeutics Market to record USD 3.99 Bn growth -- Driven by the availability, research, and development of novel biomarkers
28 Sep 2022
Vaccine
NEW YORK, Sept. 28, 2022 /PRNewswire/ -- The
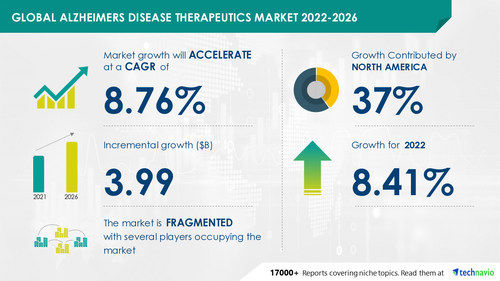
global Alzheimer's disease therapeutics market size is expected to grow by USD 3.99 billion, accelerating at a CAGR of 8.76% between 2021 and 2026, according to the latest research report by Technavio. The report has considered various factors including the patient population, prevalence rate of AlzheimerAlzheimer's disease, revenue generated by vendors, and disposable income among others to estimate the size of the market.
Download PDF Report Sample
Continue Reading
Preview
Source: PRNewswire
Technavio has announced its latest market research report titled Global Alzheimers Disease Therapeutics Market 2022-2026
The Alzheimer's disease therapeutics market is fragmented. The market has several approved therapeutics for the symptomatic treatment of AlzheimerAlzheimer's disease. The strong prevalence of the disease and the need for highly efficacious therapeutics are compelling several vendors to develop new vaccines. Besides, the strong pipeline of novel therapeutics is expected to pave the way for new entrants. Hence, the market is expected to witness the launch of various novel therapeutics and the entry of a few new players during the forecast period. This will intensify the competition in the market and encourage vendors to form strategic alliances to increase their product offerings and geographical reach.
Some of the key vendors operating in the market include the following:
AbbVie Inc.: The company offers Alzheimer's disease therapeutics products such as NAMENDA XR.
Aurobindo Pharma Ltd.: The company offers Alzheimer's disease therapeutics products such as Galantamine Tablets USP 4mg, 8mg, and 12mg.
Biogen Inc.: The company operates through one business segment and is involved in discovering, developing, and delivering worldwide innovative therapies for people living with serious neurological and neurodegenerative diseases.
Eisai Co. Ltd.: The company offers AlzheimerAlzheimer's disease therapeutics products such as ADUHELM.
Eli Lilly and Co.: The company offers Alzheimer's disease therapeutics products such as TRAILBLAZER-ALZ.
Although the availability, research, and development of novel biomarkers will offer immense growth opportunities, the high cost of therapeutics development will challenge the growth of the market participants. To make the most of the opportunities, market vendors should focus more on the growth prospects in the fast-growing segments, while maintaining their positions in the slow-growing segments. Get detailed insights into market behavior.
Buy Report Now
Alzheimer's Disease Therapeutics Market 2022-2026: Segmentation Analysis
Alzheimer'sAlzheimer's Disease Therapeutics Market is segmented as below:
Drug Class
Cholinesterase InhibitorsCholinesterase Inhibitors
N-methyl-D-aspartate Receptor Antagonists
Other Drug Class
The market observed high demand for cholinesterase inhibitorscholinesterase inhibitors from end-users in 2021. Factors such as substantial progress in understanding the basic neurobiology of Alzheimer's disease and the increased availability of new drugs such as cholinesterase inhibitorscholinesterase inhibitors are driving the growth of the segment.
Geography
North America
Europe
Asia
Rest Of World (ROW)
North America will dominate the growth of the market, occupying 37% of the global market share. The increasing awareness and the strong prevalence of Alzheimer's disease are driving the growth of the regional market. Technavio presents a detailed picture of the market by the way of study, synthesis, and summation of data from multiple sources. Our Alzheimer's disease therapeutics market report covers the following areas:
Alzheimer'sAlzheimer's Disease Therapeutics Market size
AlzheimerAlzheimer's Disease Therapeutics Market trends
Alzheimer's Disease Therapeutics Market industry analysis
Alzheimer's Disease Therapeutics Market 2022-2026: Vendor Analysis
We provide a detailed analysis of around 25 vendors operating in the Alzheimer's disease therapeutics market, including some of the dominant vendors. Backed with competitive intelligence and benchmarking, our research report on the Alzheimer's disease therapeutics market is designed to provide entry support, customer profile, and M&As as well as go-to-market strategy support.
Alzheimer's Disease Therapeutics Market 2022-2026: Key Highlights
CAGR of the market during the forecast period 2022-2026
Detailed information on factors that will assist AlzheimerAlzheimer's disease therapeutics market growth during the next five years
Estimation of the Alzheimer's disease therapeutics market size and its contribution to the parent market
Predictions on upcoming trends and changes in consumer behavior
The growth of the AlzheimerAlzheimer's disease therapeutics market
Analysis of the market's competitive landscape and detailed information on vendors
Comprehensive details of factors that will challenge the growth of AlzheimerAlzheimer's disease therapeutics market vendors
Related Reports:
Neurovascular Devices Market by Product and Geography - Forecast and Analysis 2022-2026
Neurological Biomarkers Market by Indication, End-user, and Geography - Forecast and Analysis 2022-2026
Table Of Contents:
1 Executive Summary
1.1 Market overview
Exhibit 01: Executive Summary – Chart on Market Overview
Exhibit 02: Executive Summary – Data Table on Market Overview
Exhibit 03: Executive Summary – Chart on Global Market Characteristics
Exhibit 04: Executive Summary – Chart on Market by Geography
Exhibit 05: Executive Summary – Chart on Market Segmentation by Drug Class
Exhibit 06: Executive Summary – Chart on Incremental Growth
Exhibit 07: Executive Summary – Data Table on Incremental Growth
Exhibit 08: Executive Summary – Chart on Vendor Market Positioning
2 Market Landscape
2.1 Market ecosystem
Exhibit 09: Parent market
Exhibit 10: Market Characteristics
3 Market Sizing
3.1 Market definition
Exhibit 11: Offerings of vendors included in the market definition
3.2 Market segment analysis
Exhibit 12: Market segments
3.3 Market size 2021
3.4 Market outlook: Forecast for 2021-2026
Exhibit 13: Chart on Global - Market size and forecast 2021-2026 ($ million)
Exhibit 14: Data Table on Global - Market size and forecast 2021-2026 ($ million)
Exhibit 15: Chart on Global Market: Year-over-year growth 2021-2026 (%)
Exhibit 16: Data Table on Global Market: Year-over-year growth 2021-2026 (%)
4 Five Forces Analysis
4.1 Five forces summary
Exhibit 17: Five forces analysis - Comparison between2021 and 2026
4.2 Bargaining power of buyers
Exhibit 18: Chart on Bargaining power of buyers – Impact of key factors 2021 and 2026
4.3 Bargaining power of suppliers
Exhibit 19: Bargaining power of suppliers – Impact of key factors in 2021 and 2026
4.4 Threat of new entrants
Exhibit 20: Threat of new entrants – Impact of key factors in 2021 and 2026
4.5 Threat of substitutes
Exhibit 21: Threat of substitutes – Impact of key factors in 2021 and 2026
4.6 Threat of rivalry
Exhibit 22: Threat of rivalry – Impact of key factors in 2021 and 2026
4.7 Market condition
Exhibit 23: Chart on Market condition - Five forces 2021 and 2026
5 Market Segmentation by Drug Class
5.1 Market segments
Exhibit 24: Chart on Drug Class - Market share 2021-2026 (%)
Exhibit 25: Data Table on Drug Class - Market share 2021-2026 (%)
5.2 Comparison by Drug Class
Exhibit 26: Chart on Comparison by Drug Class
Exhibit 27: Data Table on Comparison by Drug Class
5.3 Cholinesterase inhibitorsCholinesterase inhibitors - Market size and forecast 2021-2026
Exhibit 28: Chart on Cholinesterase inhibitorsCholinesterase inhibitors - Market size and forecast 2021-2026 ($ million)
Exhibit 29: Data Table on Cholinesterase inhibitorsCholinesterase inhibitors - Market size and forecast 2021-2026 ($ million)
Exhibit 30: Chart on Cholinesterase inhibitorsCholinesterase inhibitors - Year-over-year growth 2021-2026 (%)
Exhibit 31: Data Table on Cholinesterase inhibitorsCholinesterase inhibitors - Year-over-year growth 2021-2026 (%)
5.4 N-methyl-D-aspartate receptor antagonist - Market size and forecast 2021-2026
Exhibit 32: Chart on N-methyl-D-aspartate receptor antagonist - Market size and forecast 2021-2026 ($ million)
Exhibit 33: Data Table on N-methyl-D-aspartate receptor antagonist - Market size and forecast 2021-2026 ($ million)
Exhibit 34: Chart on N-methyl-D-aspartate receptor antagonist - Year-over-year growth 2021-2026 (%)
Exhibit 35: Data Table on N-methyl-D-aspartate receptor antagonist - Year-over-year growth 2021-2026 (%)
5.5 Other drug class - Market size and forecast 2021-2026
Exhibit 36: Chart on Other drug class - Market size and forecast 2021-2026 ($ million)
Exhibit 37: Data Table on Other drug class - Market size and forecast 2021-2026 ($ million)
Exhibit 38: Chart on Other drug class - Year-over-year growth 2021-2026 (%)
Exhibit 39: Data Table on Other drug class - Year-over-year growth 2021-2026 (%)
5.6 Market opportunity by Drug Class
Exhibit 40: Market opportunity by Drug Class ($ million)
6 Customer Landscape
6.1 Customer landscape overview
Exhibit 41: Analysis of price sensitivity, lifecycle, customer purchase basket, adoption rates, and purchase criteria
7 Geographic Landscape
7.1 Geographic segmentation
Exhibit 42: Chart on Market share by geography 2021-2026 (%)
Exhibit 43: Data Table on Market share by geography 2021-2026 (%)
7.2 Geographic comparison
Exhibit 44: Chart on Geographic comparison
Exhibit 45: Data Table on Geographic comparison
7.3 North America - Market size and forecast 2021-2026
Exhibit 46: Chart on North America - Market size and forecast 2021-2026 ($ million)
Exhibit 47: Data Table on North America - Market size and forecast 2021-2026 ($ million)
Exhibit 48: Chart on North America - Year-over-year growth 2021-2026 (%)
Exhibit 49: Data Table on North America - Year-over-year growth 2021-2026 (%)
7.4 Europe - Market size and forecast 2021-2026
Exhibit 50: Chart on Europe - Market size and forecast 2021-2026 ($ million)
Exhibit 51: Data Table on Europe - Market size and forecast 2021-2026 ($ million)
Exhibit 52: Chart on Europe - Year-over-year growth 2021-2026 (%)
Exhibit 53: Data Table on Europe - Year-over-year growth 2021-2026 (%)
7.5 Asia - Market size and forecast 2021-2026
Exhibit 54: Chart on Asia - Market size and forecast 2021-2026 ($ million)
Exhibit 55: Data Table on Asia - Market size and forecast 2021-2026 ($ million)
Exhibit 56: Chart on Asia - Year-over-year growth 2021-2026 (%)
Exhibit 57: Data Table on Asia - Year-over-year growth 2021-2026 (%)
7.6 Rest of World (ROW) - Market size and forecast 2021-2026
Exhibit 58: Chart on Rest of World (ROW) - Market size and forecast 2021-2026 ($ million)
Exhibit 59: Data Table on Rest of World (ROW) - Market size and forecast 2021-2026 ($ million)
Exhibit 60: Chart on Rest of World (ROW) - Year-over-year growth 2021-2026 (%)
Exhibit 61: Data Table on Rest of World (ROW) - Year-over-year growth 2021-2026 (%)
7.7 US - Market size and forecast 2021-2026
Exhibit 62: Chart on US - Market size and forecast 2021-2026 ($ million)
Exhibit 63: Data Table on US - Market size and forecast 2021-2026 ($ million)
Exhibit 64: Chart on US - Year-over-year growth 2021-2026 (%)
Exhibit 65: Data Table on US - Year-over-year growth 2021-2026 (%)
7.8 Canada - Market size and forecast 2021-2026
Exhibit 66: Chart on Canada - Market size and forecast 2021-2026 ($ million)
Exhibit 67: Data Table on Canada - Market size and forecast 2021-2026 ($ million)
Exhibit 68: Chart on Canada - Year-over-year growth 2021-2026 (%)
Exhibit 69: Data Table on Canada - Year-over-year growth 2021-2026 (%)
7.9 UK - Market size and forecast 2021-2026
Exhibit 70: Chart on UK - Market size and forecast 2021-2026 ($ million)
Exhibit 71: Data Table on UK - Market size and forecast 2021-2026 ($ million)
Exhibit 72: Chart on UK - Year-over-year growth 2021-2026 (%)
Exhibit 73: Data Table on UK - Year-over-year growth 2021-2026 (%)
7.10 Germany - Market size and forecast 2021-2026
Exhibit 74: Chart on Germany - Market size and forecast 2021-2026 ($ million)
Exhibit 75: Data Table on Germany - Market size and forecast 2021-2026 ($ million)
Exhibit 76: Chart on Germany - Year-over-year growth 2021-2026 (%)
Exhibit 77: Data Table on Germany - Year-over-year growth 2021-2026 (%)
7.11 Japan - Market size and forecast 2021-2026
Exhibit 78: Chart on Japan - Market size and forecast 2021-2026 ($ million)
Exhibit 79: Data Table on Japan - Market size and forecast 2021-2026 ($ million)
Exhibit 80: Chart on Japan - Year-over-year growth 2021-2026 (%)
Exhibit 81: Data Table on Japan - Year-over-year growth 2021-2026 (%)
7.12 China - Market size and forecast 2021-2026
Exhibit 82: Chart on China - Market size and forecast 2021-2026 ($ million)
Exhibit 83: Data Table on China - Market size and forecast 2021-2026 ($ million)
Exhibit 84: Chart on China - Year-over-year growth 2021-2026 (%)
Exhibit 85: Data Table on China - Year-over-year growth 2021-2026 (%)
7.13 Market opportunity by geography
Exhibit 86: Market opportunity by geography ($ million)
8 Drivers, Challenges, and Trends
8.1 Market drivers
8.2 Market challenges
8.3 Impact of drivers and challenges
Exhibit 87: Impact of drivers and challenges in 2021 and 2026
8.4 Market trends
9 Vendor Landscape
9.1 Overview
9.2 Vendor landscape
Exhibit 88: Overview on Criticality of inputs and Factors of differentiation
9.3 Landscape disruption
Exhibit 89: Overview on factors of disruption
9.4 Industry risks
Exhibit 90: Impact of key risks on business
10 Vendor Analysis
10.1 Vendors covered
Exhibit 91: Vendors covered
10.2 Market positioning of vendors
Exhibit 92: Matrix on vendor position and classification
10.3 AbbVie Inc.
Exhibit 93: AbbVie Inc. - Overview
Exhibit 94: AbbVie Inc. - Product / Service
Exhibit 95: AbbVie Inc. - Key offerings
Exhibit 96: Aurobindo Pharma Ltd. - Overview
Exhibit 97: Aurobindo Pharma Ltd. - Product / Service
Exhibit 98: Aurobindo Pharma Ltd. - Key offerings
10.5 Eisai Co. Ltd.
Exhibit 99: Eisai Co. Ltd. - Overview
Exhibit 100: Eisai Co. Ltd. - Business segments
Exhibit 101: Eisai Co. Ltd. - Key offerings
Exhibit 102: Eisai Co. Ltd. - Segment focus
10.6 Eli Lilly and Co.
Exhibit 103: Eli Lilly and Co. - Overview
Exhibit 104: Eli Lilly and Co. - Product / Service
Exhibit 105: Eli Lilly and Co. - Key offerings
10.7 H Lundbeck AS
Exhibit 106: H Lundbeck AS - Overview
Exhibit 107: H Lundbeck AS - Product / Service
Exhibit 108: H Lundbeck AS - Key offerings
10.8 Johnson and Johnson
Exhibit 109: Johnson and Johnson - Overview
Exhibit 110: Johnson and Johnson - Business segments
Exhibit 111: Johnson and Johnson - Key news
Exhibit 112: Johnson and Johnson - Key offerings
Exhibit 113: Johnson and Johnson - Segment focus
10.9 Lupin Ltd.
Exhibit 114: Lupin Ltd. - Overview
Exhibit 115: Lupin Ltd. - Product / Service
Exhibit 116: Lupin Ltd. - Key news
Exhibit 117: Lupin Ltd. - Key offerings
10.10 Novartis AG
Exhibit 118: Novartis AG - Overview
Exhibit 119: Novartis AG - Business segments
Exhibit 120: Novartis AG - Key offerings
Exhibit 121: Novartis AG - Segment focus
Exhibit 122: Teva Pharmaceutical Industries Ltd. - Overview
Exhibit 123: Teva Pharmaceutical Industries Ltd. - Business segments
Exhibit 124: Teva Pharmaceutical Industries Ltd. - Key news
Exhibit 125: Teva Pharmaceutical Industries Ltd. - Key offerings
Exhibit 126: Teva Pharmaceutical Industries Ltd. - Segment focus
10.12 Viatris Inc.
Exhibit 127: Viatris Inc. - Overview
Exhibit 128: Viatris Inc. - Business segments
Exhibit 129: Viatris Inc. - Key offerings
Exhibit 130: Viatris Inc. - Segment focus
11.1 Scope of the report
11.2 Inclusions and exclusions checklist
Exhibit 131: Inclusions checklist
Exhibit 132: Exclusions checklist
11.3 Currency conversion rates for US$
Exhibit 133: Currency conversion rates for US$
11.4 Research methodology
Exhibit 134: Research methodology
Exhibit 135: Validation techniques employed for market sizing
Exhibit 136: Information sources
11.5 List of abbreviations
Exhibit 137: List of abbreviations
About Us
Technavio is a leading global technology research and advisory company. Their research and analysis focus on emerging market trends and provides actionable insights to help businesses identify market opportunities and develop effective strategies to optimize their market positions. With over 500 specialized analysts, Technavio's report library consists of more than 17,000 reports and counting, covering 800 technologies, spanning across 50 countries. Their client base consists of enterprises of all sizes, including more than 100 Fortune 500 companies. This growing client base relies on Technavio's comprehensive coverage, extensive research, and actionable market insights to identify opportunities in existing and potential markets and assess their competitive positions within changing market scenarios.
Contact
Technavio Research
Jesse Maida
US: +1 844 364 1100
UK: +44 203 893 3200
Email: [email protected]
Website: www.technavio.com/
SOURCE Technavio
For more details,please visit the original website
The content of the article does not represent any opinions of Synapse and its affiliated companies. If there is any copyright infringement or error, please contact us, and we will deal with it within 24 hours.
Indications
Targets
Hot reports


Get started for free today!
Accelerate Strategic R&D decision making with Synapse, PatSnap’s AI-powered Connected Innovation Intelligence Platform Built for Life Sciences Professionals.
Start your data trial now!
Synapse data is also accessible to external entities via APIs or data packages. Leverages most recent intelligence information, enabling fullest potential.