Antibiotics market to grow by 5.11% Y-O-Y from 2022 to 2023: Rising prevalence of infectious diseases will drive growth - Technavio
09 Jan 2023
NEW YORK, Jan. 9, 2023 /PRNewswire/ --
Antibiotics market insights -
Continue Reading
Preview
Source: PRNewswire
Technavio has announced its latest market research report titled Global Antibiotics Market 2023-2027
Vendors: 15+, Including Abbott Laboratories, AbbVie Inc., Armata Pharmaceuticals Inc., Aspen Pharmacare Holdings Ltd, Astellas Pharma Inc., Aurobindo Pharma Ltd., Bayer AG, F. Hoffmann La Roche Ltd., Flynn Pharma Ltd., GlaxoSmithKline Plc, Incepta Pharmaceuticals Ltd., Johnson and Johnson, Lupin Ltd., Mayne Pharma Group Ltd., Melinta Therapeutics LLC, Merck KGaA, Pfizer Inc., Sanofi SA, Takeda Pharmaceutical Co. Ltd., and Teva Pharmaceutical Industries Ltd. among others
Coverage: Parent market analysis; key drivers, major trends, and challenges; customer and vendor landscape; vendor product insights and recent developments; key vendors; and market positioning of vendors
Segments: Product (broad-spectrum antibiotics and narrow-spectrum antibiotics), route of administration (intravenous, oral, and others), and geography (Asia, North America, Europe, and Rest of World).
To understand more about the antibiotics market, request a sample report
The antibiotics market report provides critical information and factual data, with a qualitative and quantitative study of the market based on market drivers and limitations as well as future prospects.
Why Buy?
Add credibility to strategy
Analyzes competitor's offerings
Get a holistic view of the market
Grow your profit margin with Technavio- Buy the Report
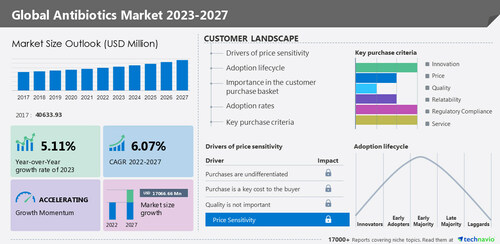
In 2017, the antibiotics market was valued at
USD 40,633.93 million. From a regional perspective,
Asia held the largest market share, valued at
USD 14,893.29
million. The
antibiotics market size is estimated to grow by
USD 17,066.66 million from 2022 to 2027 at a
CAGR of 6.07% according to Technavio.
Antibiotics market - Customer landscape
To help companies evaluate and develop growth strategies, the report outlines –
Key purchase criteria
Adoption rates
Adoption lifecycle
Drivers of price sensitivity
For highlights on customer landscape analysis, download a sample!
Global antibiotics market - Vendor insights
The growing competition in the market is compelling vendors to adopt various growth strategies such as promotional activities and spending on advertisements to improve the visibility of their services. Technavio report analyzes the market's competitive landscape and offers information on several market vendors including -
AbbVie Inc: The company offers HUMIRA antibiotics drug which is designed to reduce pain and swelling.
Astellas Pharma Inc: The company offers XTANDI which is designed as a prescription medicine to treat men with prostate cancer issues.
Aspen Pharmacare Holdings Ltd: The company offers Aggrastat antibiotic medicine which is designed to treat the symptoms of blood clots and heart attack issues.
Global antibiotics market –
Market dynamics
Major drivers-
Rising prevalence of infectious diseases
Growing awareness of various diseases and their treatment
Special regulatory designations
KEY challenges –
Development of antibiotic-resistant strains
Entry of generics
The limited interest of pharmaceutical companies in investing in antibiotic research activities
Drivers, & Challenges have an impact on market dynamics and can impact businesses. Find some insights from a sample report!
What are the key data covered in this antibiotics market report?
CAGR of the market during the forecast period
Detailed information on factors that will drive the growth of the antibiotics market between 2023 and 2027
Precise estimation of the size of the antibiotics market and its contribution to the parent market
Accurate predictions about upcoming trends and changes in consumer behavior
Growth of the antibiotics market across Asia, North America, Europe, and Rest of World (ROW)
A thorough analysis of the market's competitive landscape and detailed information about vendors
Comprehensive analysis of factors that will challenge the growth of antibiotics market vendors
Gain instant access to 17,000+ market research reports.
Technavio's SUBSCRIPTION platform
Related Reports:
Anti-inflammatory Therapeutics Market by Application, Drug Class, and Geography - Forecast and Analysis 2023-2027: The anti-inflammatory therapeutics market is estimated to
grow at a
CAGR of 6.7% between 2022 and 2027. The size of the market is forecast to increase by
USD 39.32 billion. The unmet need for safer biologics for RA is notably driving the market growth, although factors such as the loss of patents may impede market growth.
CAGR of 12.5% between 2022 and 2027. The size of the market is forecast to increase by
USD 13,693.43 million. The growing obese population is notably driving the market growth, although factors such as limited reimbursement for anti-obesity drugs may impede the market growth.
Browse for Technavio "Health Care" Research Reports
Table of Contents
1 Executive Summary
1.1 Market overview
Exhibit 01: Executive Summary – Chart on Market Overview
Exhibit 02: Executive Summary – Data Table on Market Overview
Exhibit 03: Executive Summary – Chart on Global Market Characteristics
Exhibit 04: Executive Summary – Chart on Market by Geography
Exhibit 05: Executive Summary – Chart on Market Segmentation by Product
Exhibit 06: Executive Summary – Chart on Market Segmentation by Route of Administration
Exhibit 07: Executive Summary – Chart on Incremental Growth
Exhibit 08: Executive Summary – Data Table on Incremental Growth
Exhibit 09: Executive Summary – Chart on Vendor Market Positioning
2 Market Landscape
2.1 Market ecosystem
Exhibit 10: Parent market
Exhibit 11: Market Characteristics
3 Market Sizing
3.1 Market definition
Exhibit 12: Offerings of vendors included in the market definition
3.2 Market segment analysis
Exhibit 13: Market segments
3.3 Market size 2022
3.4 Market outlook: Forecast for 2022-2027
Exhibit 14: Chart on Global - Market size and forecast 2022-2027 ($ million)
Exhibit 15: Data Table on Global - Market size and forecast 2022-2027 ($ million)
Exhibit 16: Chart on Global Market: Year-over-year growth 2022-2027 (%)
Exhibit 17: Data Table on Global Market: Year-over-year growth 2022-2027 (%)
4 Historic Market Size
4.1 Global antibiotics market 2022 - 2027
Exhibit 18: Historic Market Size – Data Table on Global antibiotics market 2022 - 2027 ($ million)
4.2 Product Segment Analysis 2022 - 2027
Exhibit 19: Historic Market Size – Product Segment 2022 - 2027 ($ million)
4.3 Route of administration Segment Analysis 2022 - 2027
Exhibit 20: Historic Market Size – Route of administration Segment 2022 - 2027 ($ million)
4.4 Geography Segment Analysis 2022 - 2027
Exhibit 21: Historic Market Size – Geography Segment 2022 - 2027 ($ million)
4.5 Country Segment Analysis 2022 - 2027
Exhibit 22: Historic Market Size – Country Segment 2022 - 2027 ($ million)
5 Five Forces Analysis
5.1 Five forces summary
Exhibit 23: Five forces analysis - Comparison between 2022 and 2027
5.2 Bargaining power of buyers
Exhibit 24: Chart on Bargaining power of buyers – Impact of key factors 2022 and 2027
5.3 Bargaining power of suppliers
Exhibit 25: Bargaining power of suppliers – Impact of key factors in 2022 and 2027
5.4 Threat of new entrants
Exhibit 26: Threat of new entrants – Impact of key factors in 2022 and 2027
5.5 Threat of substitutes
Exhibit 27: Threat of substitutes – Impact of key factors in 2022 and 2027
5.6 Threat of rivalry
Exhibit 28: Threat of rivalry – Impact of key factors in 2022 and 2027
5.7 Market condition
Exhibit 29: Chart on Market condition - Five forces 2022 and 2027
6 Market Segmentation by Product
6.1 Market segments
Exhibit 30: Chart on Product - Market share 2022-2027 (%)
Exhibit 31: Data Table on Product - Market share 2022-2027 (%)
6.2 Comparison by Product
Exhibit 32: Chart on Comparison by Product
Exhibit 33: Data Table on Comparison by Product
6.3 Broad-spectrum antibiotics - Market size and forecast 2022-2027
Exhibit 34: Chart on Broad-spectrum antibiotics - Market size and forecast 2022-2027 ($ million)
Exhibit 35: Data Table on Broad-spectrum antibiotics - Market size and forecast 2022-2027 ($ million)
Exhibit 36: Chart on Broad-spectrum antibiotics - Year-over-year growth 2022-2027 (%)
Exhibit 37: Data Table on Broad-spectrum antibiotics - Year-over-year growth 2022-2027 (%)
6.4 Narrow-spectrum antibiotics - Market size and forecast 2022-2027
Exhibit 38: Chart on Narrow-spectrum antibiotics - Market size and forecast 2022-2027 ($ million)
Exhibit 39: Data Table on Narrow-spectrum antibiotics - Market size and forecast 2022-2027 ($ million)
Exhibit 40: Chart on Narrow-spectrum antibiotics - Year-over-year growth 2022-2027 (%)
Exhibit 41: Data Table on Narrow-spectrum antibiotics - Year-over-year growth 2022-2027 (%)
6.5 Market opportunity by Product
Exhibit 42: Market opportunity by Product ($ million)
7 Market Segmentation by Route of Administration
7.1 Market segments
Exhibit 43: Chart on Route of Administration - Market share 2022-2027 (%)
Exhibit 44: Data Table on Route of Administration - Market share 2022-2027 (%)
7.2 Comparison by Route of Administration
Exhibit 45: Chart on Comparison by Route of Administration
Exhibit 46: Data Table on Comparison by Route of Administration
7.3 Intravenous - Market size and forecast 2022-2027
Exhibit 47: Chart on Intravenous - Market size and forecast 2022-2027 ($ million)
Exhibit 48: Data Table on Intravenous - Market size and forecast 2022-2027 ($ million)
Exhibit 49: Chart on Intravenous - Year-over-year growth 2022-2027 (%)
Exhibit 50: Data Table on Intravenous - Year-over-year growth 2022-2027 (%)
7.4 Oral - Market size and forecast 2022-2027
Exhibit 51: Chart on Oral - Market size and forecast 2022-2027 ($ million)
Exhibit 52: Data Table on Oral - Market size and forecast 2022-2027 ($ million)
Exhibit 53: Chart on Oral - Year-over-year growth 2022-2027 (%)
Exhibit 54: Data Table on Oral - Year-over-year growth 2022-2027 (%)
7.5 Others - Market size and forecast 2022-2027
Exhibit 55: Chart on Others - Market size and forecast 2022-2027 ($ million)
Exhibit 56: Data Table on Others - Market size and forecast 2022-2027 ($ million)
Exhibit 57: Chart on Others - Year-over-year growth 2022-2027 (%)
Exhibit 58: Data Table on Others - Year-over-year growth 2022-2027 (%)
7.6 Market opportunity by Route of Administration
Exhibit 59: Market opportunity by Route of Administration ($ million)
8 Customer Landscape
8.1 Customer landscape overview
Exhibit 60: Analysis of price sensitivity, lifecycle, customer purchase basket, adoption rates, and purchase criteria
9 Geographic Landscape
9.1 Geographic segmentation
Exhibit 61: Chart on Market share by geography 2022-2027 (%)
Exhibit 62: Data Table on Market share by geography 2022-2027 (%)
9.2 Geographic comparison
Exhibit 63: Chart on Geographic comparison
Exhibit 64: Data Table on Geographic comparison
9.3 Asia - Market size and forecast 2022-2027
Exhibit 65: Chart on Asia - Market size and forecast 2022-2027 ($ million)
Exhibit 66: Data Table on Asia - Market size and forecast 2022-2027 ($ million)
Exhibit 67: Chart on Asia - Year-over-year growth 2022-2027 (%)
Exhibit 68: Data Table on Asia - Year-over-year growth 2022-2027 (%)
9.4 North America - Market size and forecast 2022-2027
Exhibit 69: Chart on North America - Market size and forecast 2022-2027 ($ million)
Exhibit 70: Data Table on North America - Market size and forecast 2022-2027 ($ million)
Exhibit 71: Chart on North America - Year-over-year growth 2022-2027 (%)
Exhibit 72: Data Table on North America - Year-over-year growth 2022-2027 (%)
9.5 Europe - Market size and forecast 2022-2027
Exhibit 73: Chart on Europe - Market size and forecast 2022-2027 ($ million)
Exhibit 74: Data Table on Europe - Market size and forecast 2022-2027 ($ million)
Exhibit 75: Chart on Europe - Year-over-year growth 2022-2027 (%)
Exhibit 76: Data Table on Europe - Year-over-year growth 2022-2027 (%)
9.6 Rest of World (ROW) - Market size and forecast 2022-2027
Exhibit 77: Chart on Rest of World (ROW) - Market size and forecast 2022-2027 ($ million)
Exhibit 78: Data Table on Rest of World (ROW) - Market size and forecast 2022-2027 ($ million)
Exhibit 79: Chart on Rest of World (ROW) - Year-over-year growth 2022-2027 (%)
Exhibit 80: Data Table on Rest of World (ROW) - Year-over-year growth 2022-2027 (%)
9.7 US - Market size and forecast 2022-2027
Exhibit 81: Chart on US - Market size and forecast 2022-2027 ($ million)
Exhibit 82: Data Table on US - Market size and forecast 2022-2027 ($ million)
Exhibit 83: Chart on US - Year-over-year growth 2022-2027 (%)
Exhibit 84: Data Table on US - Year-over-year growth 2022-2027 (%)
9.8 China - Market size and forecast 2022-2027
Exhibit 85: Chart on China - Market size and forecast 2022-2027 ($ million)
Exhibit 86: Data Table on China - Market size and forecast 2022-2027 ($ million)
Exhibit 87: Chart on China - Year-over-year growth 2022-2027 (%)
Exhibit 88: Data Table on China - Year-over-year growth 2022-2027 (%)
9.9 India - Market size and forecast 2022-2027
Exhibit 89: Chart on India - Market size and forecast 2022-2027 ($ million)
Exhibit 90: Data Table on India - Market size and forecast 2022-2027 ($ million)
Exhibit 91: Chart on India - Year-over-year growth 2022-2027 (%)
Exhibit 92: Data Table on India - Year-over-year growth 2022-2027 (%)
9.10 UK - Market size and forecast 2022-2027
Exhibit 93: Chart on UK - Market size and forecast 2022-2027 ($ million)
Exhibit 94: Data Table on UK - Market size and forecast 2022-2027 ($ million)
Exhibit 95: Chart on UK - Year-over-year growth 2022-2027 (%)
Exhibit 96: Data Table on UK - Year-over-year growth 2022-2027 (%)
9.11 Japan - Market size and forecast 2022-2027
Exhibit 97: Chart on Japan - Market size and forecast 2022-2027 ($ million)
Exhibit 98: Data Table on Japan - Market size and forecast 2022-2027 ($ million)
Exhibit 99: Chart on Japan - Year-over-year growth 2022-2027 (%)
Exhibit 100: Data Table on Japan - Year-over-year growth 2022-2027 (%)
9.12 Market opportunity by geography
Exhibit 101: Market opportunity by geography ($ million)
10 Drivers, Challenges, and Trends
10.1 Market drivers
10.2 Market challenges
10.3 Impact of drivers and challenges
Exhibit 102: Impact of drivers and challenges in 2022 and 2027
10.4 Market trends
11 Vendor Landscape
11.1 Overview
11.2 Vendor landscape
Exhibit 103: Overview on Criticality of inputs and Factors of differentiation
11.3 Landscape disruption
Exhibit 104: Overview on factors of disruption
11.4 Industry risks
Exhibit 105: Impact of key risks on business
12 Vendor Analysis
12.1 Vendors covered
Exhibit 106: Vendors covered
12.2 Market positioning of vendors
Exhibit 107: Matrix on vendor position and classification
12.3 Abbott Laboratories
Exhibit 108: Abbott Laboratories - Overview
Exhibit 109: Abbott Laboratories - Business segments
Exhibit 110: Abbott Laboratories - Key news
Exhibit 111: Abbott Laboratories - Key offerings
Exhibit 112: Abbott Laboratories - Segment focus
12.4 AbbVie Inc.
Exhibit 113: AbbVie Inc. - Overview
Exhibit 114: AbbVie Inc. - Product / Service
Exhibit 115: AbbVie Inc. - Key news
Exhibit 116: AbbVie Inc. - Key offerings
Exhibit 117: Aspen Pharmacare Holdings Ltd - Overview
Exhibit 118: Aspen Pharmacare Holdings Ltd - Business segments
Exhibit 119: Aspen Pharmacare Holdings Ltd - Key offerings
Exhibit 120: Aspen Pharmacare Holdings Ltd - Segment focus
12.6 Astellas Pharma Inc.
Exhibit 121: Astellas Pharma Inc. - Overview
Exhibit 122: Astellas Pharma Inc. - Product / Service
Exhibit 123: Astellas Pharma Inc. - Key offerings
Exhibit 124: Aurobindo Pharma Ltd. - Overview
Exhibit 125: Aurobindo Pharma Ltd. - Product / Service
Exhibit 126: Aurobindo Pharma Ltd. - Key offerings
12.8 Bayer AG
Exhibit 127: Bayer AG - Overview
Exhibit 128: Bayer AG - Business segments
Exhibit 129: Bayer AG - Key offerings
Exhibit 130: Bayer AG - Segment focus
Exhibit 131: F. Hoffmann La Roche Ltd. - Overview
Exhibit 132: F. Hoffmann La Roche Ltd. - Business segments
Exhibit 133: F. Hoffmann La Roche Ltd. - Key news
Exhibit 134: F. Hoffmann La Roche Ltd. - Key offerings
Exhibit 135: F. Hoffmann La Roche Ltd. - Segment focus
12.10 GlaxoSmithKline Plc
Exhibit 136: GlaxoSmithKline Plc - Overview
Exhibit 137: GlaxoSmithKline Plc - Business segments
Exhibit 138: GlaxoSmithKline Plc - Key offerings
Exhibit 139: GlaxoSmithKline Plc - Segment focus
Exhibit 140: Incepta Pharmaceuticals Ltd. - Overview
Exhibit 141: Incepta Pharmaceuticals Ltd. - Product / Service
Exhibit 142: Incepta Pharmaceuticals Ltd. - Key offerings
12.12 Johnson and Johnson
Exhibit 143: Johnson and Johnson - Overview
Exhibit 144: Johnson and Johnson - Business segments
Exhibit 145: Johnson and Johnson - Key news
Exhibit 146: Johnson and Johnson - Key offerings
Exhibit 147: Johnson and Johnson - Segment focus
12.13 Lupin Ltd.
Exhibit 148: Lupin Ltd. - Overview
Exhibit 149: Lupin Ltd. - Product / Service
Exhibit 150: Lupin Ltd. - Key news
Exhibit 151: Lupin Ltd. - Key offerings
12.14 Mayne Pharma Group Ltd.
Exhibit 152: Mayne Pharma Group Ltd. - Overview
Exhibit 153: Mayne Pharma Group Ltd. - Business segments
Exhibit 154: Mayne Pharma Group Ltd. - Key offerings
Exhibit 155: Mayne Pharma Group Ltd. - Segment focus
12.15 Merck KGaA
Exhibit 156: Merck KGaA - Overview
Exhibit 157: Merck KGaA - Business segments
Exhibit 158: Merck KGaA - Key news
Exhibit 159: Merck KGaA - Key offerings
Exhibit 160: Merck KGaA - Segment focus
12.16 Pfizer Inc.
Exhibit 161: Pfizer Inc. - Overview
Exhibit 162: Pfizer Inc. - Product / Service
Exhibit 163: Pfizer Inc. - Key news
Exhibit 164: Pfizer Inc. - Key offerings
12.17 Sanofi SA
Exhibit 165: Sanofi SA - Overview
Exhibit 166: Sanofi SA - Business segments
Exhibit 167: Sanofi SA - Key news
Exhibit 168: Sanofi SA - Key offerings
Exhibit 169: Sanofi SA - Segment focus
13 Appendix
13.1 Scope of the report
13.2 Inclusions and exclusions checklist
Exhibit 170: Inclusions checklist
Exhibit 171: Exclusions checklist
13.3 Currency conversion rates for US$
Exhibit 172: Currency conversion rates for US$
13.4 Research methodology
Exhibit 173: Research methodology
Exhibit 174: Validation techniques employed for market sizing
Exhibit 175: Information sources
13.5 List of abbreviations
Exhibit 176: List of abbreviations
About Us
Technavio is a leading global technology research and advisory company. Their research and analysis focuses on emerging market trends and provides actionable insights to help businesses identify market opportunities and develop effective strategies to optimize their market positions. With over 500 specialized analysts, Technavio's report library consists of more than 17,000 reports and counting, covering 800 technologies, spanning across 50 countries. Their client base consists of enterprises of all sizes, including more than 100 Fortune 500 companies. This growing client base relies on Technavio's comprehensive coverage, extensive research, and actionable market insights to identify opportunities in existing and potential markets and assess their competitive positions within changing market scenarios.
Contact
Technavio Research
Jesse Maida
Media & Marketing Executive
US: +1 844 364 1100
UK: +44 203 893 3200
Email: [email protected]
Website: www.technavio.com/
SOURCE Technavio
For more details,please visit the original website
The content of the article does not represent any opinions of Synapse and its affiliated companies. If there is any copyright infringement or error, please contact us, and we will deal with it within 24 hours.
Organizations
Indications
Targets
-Hot reports


Get started for free today!
Accelerate Strategic R&D decision making with Synapse, PatSnap’s AI-powered Connected Innovation Intelligence Platform Built for Life Sciences Professionals.
Start your data trial now!
Synapse data is also accessible to external entities via APIs or data packages. Leverages most recent intelligence information, enabling fullest potential.