Mono Vaccine Market to Grow by USD 2.8 Bn, Meningococcal Vaccine to be Largest Revenue-generating Type Segment - Technavio
02 Nov 2022
Vaccine
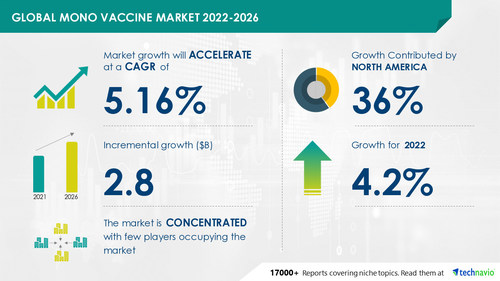
NEW YORK, Nov. 2, 2022 /PRNewswire/ -- The mono-vaccine market is expected to grow by USD 2.8 billion from 2021 to 2026. In addition, the growth momentum of the market will accelerate at a CAGR of 5.16% during the forecast period, according to Technavio. This growth can be attributed to the increase in the pediatric population. However, rising antimicrobial resistance can hamper the growth of the market during the next few years.
View a comprehensive report summary that describes the market size and forecast along with the research methodology. The
FREE sample report
is available in PDF format
Continue Reading
Preview
Source: PRNewswire
Technavio has announced its latest market research report titled Global Mono Vaccine Market 2022-2026
Mono Vaccine Market 2022-2026: Scope
The mono-vaccine market report covers the following areas:
Mono Vaccine Market size
Mono Vaccine Market trends
Mono Vaccine Market industry analysis
Subscribe to our
"Lite Plan" billed annually at USD 5000
enables you to download 5 reports and view 100 reports per month
Mono Vaccine Market 2022-2026: Segmentation
Type
Japanese Encephalitis Vaccine
Hepatitis Vaccine
Yellow Fever Vaccine
Others
The mono-vaccine market share growth in the Meningococcal Vaccine segment will be significant during the forecast period. Meningococcal meningitis is a type of meningitis caused by the Neisseria meningitides bacteria, which can be transmitted from an infected person through direct contact with droplets from the throat or respiratory secretions. Asymptomatic carriers are also capable of transmitting the infection. Such prevalence of meningococcal disease across the globe is expected to fuel the growth of the global mono-vaccine market during the forecast period.
Geography
North America
Europe
Asia
Rest Of World (ROW)
36% of the market's growth will originate from North America during the forecast period. The US is the key market for the mono-vaccine market in North America. The increase in the pediatric population will facilitate the mono-vaccine market growth in North America over the forecast period.
Learn about the contribution of each segment summarized in concise infographics and thorough descriptions.
View a FREE PDF Sample Report
Mono Vaccine Market 2022-2026: Vendor Analysis
We provide a detailed analysis of around 25 vendors operating in the Mono Vaccine Market, including AstraZeneca Plc, Aurobindo Pharma Ltd., Bavarian Nordic AS, China National Pharmaceutical Group Corp., Dynavax Technologies Corp., GlaxoSmithKline Plc, Johnson and Johnson, Merck and Co. Inc., Moderna Inc., Pfizer Inc., Sanofi SA, Serum Institute of India Pvt. Ltd., Shenzhen Kangtai Biological Products Co. Ltd., Valneva SE, and VBI Vaccines Inc. The key offerings of some of these vendors are listed below:
Shenzhen Kangtai Biological Products Co. Ltd. - The company, Shenzhen Kangtai Biological Products Co. Ltd. offers a mono vaccine, namely the SARS-COV 2 Vaccine.
AstraZeneca Plc - The company offers mono-vaccine namely COVAX.
Aurobindo Pharma Ltd. - Under this segment, the company manufactures generic pharmaceuticals and active pharmaceutical ingredients.
Sanofi SA - The company offers mono vaccine through its subsidiary China National Biotec Group.
Dynavax Technologies Corp. - The company offers mono-vaccine namely Heplisav B.
This report provides a full list of key vendors, their strategies, and latest developments.
Buy Now
to gain access to exclusive vendor information
Mono Vaccine Market 2022-2026: Key Highlights
CAGR of the market during the forecast period 2022-2026
Detailed information on factors that will assist mono-vaccine market growth during the next five years
Estimation of the mono vaccine market size and its contribution to the parent market
Predictions on upcoming trends and changes in consumer behavior
The growth of the mono-vaccine market
Analysis of the market's competitive landscape and detailed information on vendors
Comprehensive details of factors that will challenge the growth of mono-vaccine market vendors
Related Reports:
Travel Vaccines Market by Disease Type and Geography – Forecast and Analysis 2022-2026: The travel vaccines market share is expected to increase to USD 2.44 billion from 2021 to 2026.
Tetanus Toxoid Vaccine Market by Age Group and Geography – Forecast and Analysis 2022-2026: The tetanus toxoid vaccine market share is expected to increase by USD 1.17 billion from 2021 to 2026.
Table Of Contents :
1 Executive Summary
1.1 Market Overview
Exhibit 01: Executive Summary – Chart on Market Overview
Exhibit 02: Executive Summary – Data Table on Market Overview
Exhibit 03: Executive Summary – Chart on Global Market Characteristics
Exhibit 04: Executive Summary – Chart on Market by Geography
Exhibit 05: Executive Summary – Chart on Market Segmentation by Type
Exhibit 06: Executive Summary – Chart on Incremental Growth
Exhibit 07: Executive Summary – Data Table on Incremental Growth
Exhibit 08: Executive Summary – Chart on Vendor Market Positioning
2 Market Landscape
2.1 Market ecosystem
Exhibit 09: Parent market
Exhibit 10: Market Characteristics
3 Market Sizing
3.1 Market Definition
Exhibit 11: Offerings of vendors included in the market definition
3.2 Market segment analysis
Exhibit 12: Market segments
3.3 Market size 2021
3.4 Market outlook: Forecast for 2021-2026
Exhibit 13: Chart on Global - Market size and forecast 2021-2026 ($ million)
Exhibit 14: Data Table on Global - Market size and forecast 2021-2026 ($ million)
Exhibit 15: Chart on Global Market: Year-over-year growth 2021-2026 (%)
Exhibit 16: Data Table on Global Market: Year-over-year growth 2021-2026 (%)
4 Five Forces Analysis
4.1 Five forces summary
Exhibit 17: Five forces analysis - Comparison between 2021 and 2026
4.2 Bargaining power of buyers
Exhibit 18: Chart on Bargaining power of buyers – Impact of key factors 2021 and 2026
4.3 Bargaining power of suppliers
Exhibit 19: Bargaining power of suppliers – Impact of key factors in 2021 and 2026
4.4 Threat of new entrants
Exhibit 20: Threat of new entrants – Impact of key factors in 2021 and 2026
4.5 Threat of substitutes
Exhibit 21: Threat of substitutes – Impact of key factors in 2021 and 2026
4.6 Threat of rivalry
Exhibit 22: Threat of rivalry – Impact of key factors in 2021 and 2026
4.7 Market condition
Exhibit 23: Chart on Market condition - Five forces 2021 and 2026
5 Market Segmentation by Type
5.1 Market segments
Exhibit 24: Chart on Type - Market share 2021-2026 (%)
Exhibit 25: Data Table on Type - Market share 2021-2026 (%)
5.2 Comparison by Type
Exhibit 26: Chart on Comparison by Type
Exhibit 27: Data Table on Comparison by Type
5.3 Meningococcal Vaccine - Market size and forecast 2021-2026
Exhibit 28: Chart on Meningococcal Vaccine - Market size and forecast 2021-2026 ($ million)
Exhibit 29: Data Table on Meningococcal Vaccine - Market size and forecast 2021-2026 ($ million)
Exhibit 30: Chart on Meningococcal Vaccine - Year-over-year growth 2021-2026 (%)
Exhibit 31: Data Table on Meningococcal Vaccine - Year-over-year growth 2021-2026 (%)
5.4 Japanese Encephalitis Vaccine - Market size and forecast 2021-2026
Exhibit 32: Chart on Japanese Encephalitis Vaccine - Market size and forecast 2021-2026 ($ million)
Exhibit 33: Data Table on Japanese Encephalitis Vaccine - Market size and forecast 2021-2026 ($ million)
Exhibit 34: Chart on Japanese Encephalitis Vaccine - Year-over-year growth 2021-2026 (%)
Exhibit 35: Data Table on Japanese Encephalitis Vaccine - Year-over-year growth 2021-2026 (%)
5.5 Hepatitis Vaccine - Market size and forecast 2021-2026
Exhibit 36: Chart on Hepatitis Vaccine - Market size and forecast 2021-2026 ($ million)
Exhibit 37: Data Table on Hepatitis Vaccine - Market size and forecast 2021-2026 ($ million)
Exhibit 38: Chart on Hepatitis Vaccine - Year-over-year growth 2021-2026 (%)
Exhibit 39: Data Table on Hepatitis Vaccine - Year-over-year growth 2021-2026 (%)
5.6 Yellow Fever Vaccine - Market size and forecast 2021-2026
Exhibit 40: Chart on Yellow Fever Vaccine - Market size and forecast 2021-2026 ($ million)
Exhibit 41: Data Table on Yellow Fever Vaccine - Market size and forecast 2021-2026 ($ million)
Exhibit 42: Chart on Yellow Fever Vaccine - Year-over-year growth 2021-2026 (%)
Exhibit 43: Data Table on Yellow Fever Vaccine - Year-over-year growth 2021-2026 (%)
5.7 Others - Market size and forecast 2021-2026
Exhibit 44: Chart on Others - Market size and forecast 2021-2026 ($ million)
Exhibit 45: Data Table on Others - Market size and forecast 2021-2026 ($ million)
Exhibit 46: Chart on Others - Year-over-year growth 2021-2026 (%)
Exhibit 47: Data Table on Others - Year-over-year growth 2021-2026 (%)
5.8 Market opportunity by Type
Exhibit 48: Market opportunity by Type ($ million)
6 Customer Landscape
6.1 Customer landscape overview
Exhibit 49: Analysis of price sensitivity, lifecycle, customer purchase basket, adoption rates, and purchase criteria
7 Geographic Landscape
7.1 Geographic segmentation
Exhibit 50: Chart on Market share by geography 2021-2026 (%)
Exhibit 51: Data Table on Market share by geography 2021-2026 (%)
7.2 Geographic comparison
Exhibit 52: Chart on Geographic comparison
Exhibit 53: Data Table on Geographic comparison
7.3 North America - Market size and forecast 2021-2026
Exhibit 54: Chart on North America - Market size and forecast 2021-2026 ($ million)
Exhibit 55: Data Table on North America - Market size and forecast 2021-2026 ($ million)
Exhibit 56: Chart on North America - Year-over-year growth 2021-2026 (%)
Exhibit 57: Data Table on North America - Year-over-year growth 2021-2026 (%)
7.4 Europe - Market size and forecast 2021-2026
Exhibit 58: Chart on Europe - Market size and forecast 2021-2026 ($ million)
Exhibit 59: Data Table on Europe - Market size and forecast 2021-2026 ($ million)
Exhibit 60: Chart on Europe - Year-over-year growth 2021-2026 (%)
Exhibit 61: Data Table on Europe - Year-over-year growth 2021-2026 (%)
7.5 Asia - Market size and forecast 2021-2026
Exhibit 62: Chart on Asia - Market size and forecast 2021-2026 ($ million)
Exhibit 63: Data Table on Asia - Market size and forecast 2021-2026 ($ million)
Exhibit 64: Chart on Asia - Year-over-year growth 2021-2026 (%)
Exhibit 65: Data Table on Asia - Year-over-year growth 2021-2026 (%)
7.6 Rest of World (ROW) - Market size and forecast 2021-2026
Exhibit 66: Chart on Rest of World (ROW) - Market size and forecast 2021-2026 ($ million)
Exhibit 67: Data Table on Rest of World (ROW) - Market size and forecast 2021-2026 ($ million)
Exhibit 68: Chart on Rest of World (ROW) - Year-over-year growth 2021-2026 (%)
Exhibit 69: Data Table on Rest of World (ROW) - Year-over-year growth 2021-2026 (%)
7.7 US - Market size and forecast 2021-2026
Exhibit 70: Chart on US - Market size and forecast 2021-2026 ($ million)
Exhibit 71: Data Table on US - Market size and forecast 2021-2026 ($ million)
Exhibit 72: Chart on US - Year-over-year growth 2021-2026 (%)
Exhibit 73: Data Table on US - Year-over-year growth 2021-2026 (%)
7.8 Germany - Market size and forecast 2021-2026
Exhibit 74: Chart on Germany - Market size and forecast 2021-2026 ($ million)
Exhibit 75: Data Table on Germany - Market size and forecast 2021-2026 ($ million)
Exhibit 76: Chart on Germany - Year-over-year growth 2021-2026 (%)
Exhibit 77: Data Table on Germany - Year-over-year growth 2021-2026 (%)
7.9 UK - Market size and forecast 2021-2026
Exhibit 78: Chart on UK - Market size and forecast 2021-2026 ($ million)
Exhibit 79: Data Table on UK - Market size and forecast 2021-2026 ($ million)
Exhibit 80: Chart on UK - Year-over-year growth 2021-2026 (%)
Exhibit 81: Data Table on UK - Year-over-year growth 2021-2026 (%)
7.10 France - Market size and forecast 2021-2026
Exhibit 82: Chart on France - Market size and forecast 2021-2026 ($ million)
Exhibit 83: Data Table on France - Market size and forecast 2021-2026 ($ million)
Exhibit 84: Chart on France - Year-over-year growth 2021-2026 (%)
Exhibit 85: Data Table on France - Year-over-year growth 2021-2026 (%)
7.11 China - Market size and forecast 2021-2026
Exhibit 86: Chart on China - Market size and forecast 2021-2026 ($ million)
Exhibit 87: Data Table on China - Market size and forecast 2021-2026 ($ million)
Exhibit 88: Chart on China - Year-over-year growth 2021-2026 (%)
Exhibit 89: Data Table on China - Year-over-year growth 2021-2026 (%)
7.12 Market opportunity by geography
Exhibit 90: Market opportunity by geography ($ million)
8 Drivers, Challenges, and Trends
8.1 Market drivers
8.2 Market challenges
8.3 Impact of drivers and challenges
Exhibit 91: Impact of drivers and challenges in 2021 and 2026
8.4 Market trends
9 Vendor Landscape
9.1 Overview
9.2 Vendor landscape
Exhibit 92: Overview on Criticality of inputs and Factors of differentiation
9.3 Landscape disruption
Exhibit 93: Overview on factors of disruption
9.4 Industry risks
Exhibit 94: Impact of key risks on business
10 Vendor Analysis
10.1 Vendors covered
Exhibit 95: Vendors covered
10.2 Market positioning of vendors
Exhibit 96: Matrix on vendor position and classification
10.3 AstraZeneca Plc
Exhibit 97: AstraZeneca Plc - Overview
Exhibit 98: AstraZeneca Plc - Product / Service
Exhibit 99: AstraZeneca Plc - Key news
Exhibit 100: AstraZeneca Plc - Key offerings
Exhibit 101: China National Pharmaceutical Group Corp. - Overview
Exhibit 102: China National Pharmaceutical Group Corp. - Product / Service
Exhibit 103: China National Pharmaceutical Group Corp. - Key offerings
Exhibit 104: Dynavax Technologies Corp. - Overview
Exhibit 105: Dynavax Technologies Corp. - Product / Service
Exhibit 106: Dynavax Technologies Corp. - Key news
Exhibit 107: Dynavax Technologies Corp. - Key offerings
10.6 GlaxoSmithKline Plc
Exhibit 108: GlaxoSmithKline Plc - Overview
Exhibit 109: GlaxoSmithKline Plc - Business segments
Exhibit 110: GlaxoSmithKline Plc - Key offerings
Exhibit 111: GlaxoSmithKline Plc - Segment focus
10.7 Merck and Co. Inc.
Exhibit 112: Merck and Co. Inc. - Overview
Exhibit 113: Merck and Co. Inc. - Business segments
Exhibit 114: Merck and Co. Inc. - Key news
Exhibit 115: Merck and Co. Inc. - Key offerings
Exhibit 116: Merck and Co. Inc. - Segment focus
10.8 Moderna Inc.
Exhibit 117: Moderna Inc. - Overview
Exhibit 118: Moderna Inc. - Business segments
Exhibit 119: Moderna Inc. - Key offerings
Exhibit 120: Moderna Inc. - Segment focus
10.9 Pfizer Inc.
Exhibit 121: Pfizer Inc. - Overview
Exhibit 122: Pfizer Inc. - Product / Service
Exhibit 123: Pfizer Inc. - Key news
Exhibit 124: Pfizer Inc. - Key offerings
10.10 Sanofi SA
Exhibit 125: Sanofi SA - Overview
Exhibit 126: Sanofi SA - Business segments
Exhibit 127: Sanofi SA - Key news
Exhibit 128: Sanofi SA - Key offerings
Exhibit 129: Sanofi SA - Segment focus
Exhibit 130: Serum Institute of India Pvt. Ltd. - Overview
Exhibit 131: Serum Institute of India Pvt. Ltd. - Product / Service
Exhibit 132: Serum Institute of India Pvt. Ltd. - Key offerings
Exhibit 133: Shenzhen Kangtai Biological Products Co. Ltd. - Overview
Exhibit 134: Shenzhen Kangtai Biological Products Co. Ltd. - Product / Service
Exhibit 135: Shenzhen Kangtai Biological Products Co. Ltd. - Key offerings
11.1 Scope of the report
11.2 Inclusions and exclusions checklist
Exhibit 136: Inclusions checklist
Exhibit 137: Exclusions checklist
11.3 Currency conversion rates for US$
Exhibit 138: Currency conversion rates for US$
11.4 Research methodology
Exhibit 139: Research methodology
Exhibit 140: Validation techniques employed for market sizing
Exhibit 141: Information sources
11.5 List of abbreviations
Exhibit 142: List of abbreviations
About Us
Technavio is a leading global technology research and advisory company. Their research and analysis focus on emerging market trends and provide actionable insights to help businesses identify market opportunities and develop effective strategies to optimize their market positions. With over 500 specialized analysts, Technavio's report library consists of more than 17,000 reports and counting, covering 800 technologies, spanning 50 countries. Their client base consists of enterprises of all sizes, including more than 100 Fortune 500 companies. This growing client base relies on Technavio's comprehensive coverage, extensive research, and actionable market insights to identify opportunities in existing and potential markets and assess their competitive positions within changing market scenarios.
Contact
Technavio Research
Jesse Maida
US: +1 844 364 1100
UK: +44 203 893 3200
Email: [email protected]
Website: www.technavio.com/
SOURCE Technavio
For more details,please visit the original website
The content of the article does not represent any opinions of Synapse and its affiliated companies. If there is any copyright infringement or error, please contact us, and we will deal with it within 24 hours.
Organizations
Indications
Targets
-Drugs
Hot reports


Get started for free today!
Accelerate Strategic R&D decision making with Synapse, PatSnap’s AI-powered Connected Innovation Intelligence Platform Built for Life Sciences Professionals.
Start your data trial now!
Synapse data is also accessible to external entities via APIs or data packages. Leverages most recent intelligence information, enabling fullest potential.