Acute Ischemic Stroke Therapeutics Market to grow by USD 1,524.49 million from 2022 to 2027|Rising prevalence of disease boosts the market - Technavio
10 Jul 2023
NEW YORK, July 10, 2023 /PRNewswire/ -- The
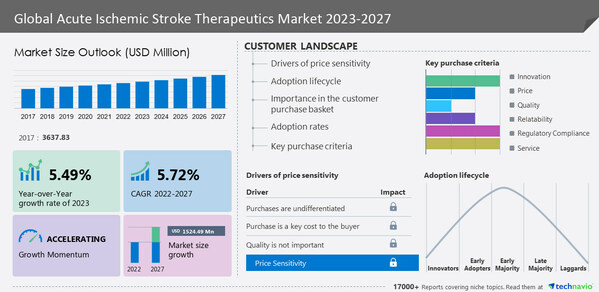
global acute ischemic stroke therapeutics market size is estimated to grow by
USD 1,524.49 million from 2022 to 2027, according to Technavio. The market is estimated to grow at a
CAGR of 5.72% during the forecast period.
North America will account for
38% of the global market growth. The growth of the market in this region is attributed to factors such as the expected approval of late-stage pipeline molecules, including BIIB093 (intravenous glibenclamide), BRILINTA, MultiStem, and NA-1. In addition, the region is expected to witness the availability of various diagnostics and drugs for the treatment of stroke, which will drive market growth.
For more insights on the historic period (2017 to 2021) and forecast market size (2023 to 2027) - Request a sample report
Continue Reading
Preview
Source: PRNewswire
Technavio has announced its latest market research report titled Global Acute Ischemic Stroke Therapeutics Market 2023-2027
What's New?
Special coverage on the Russia-Ukraine war; global inflation; recovery analysis from COVID-19; supply chain disruptions, global trade tensions; and risk of recession
Global competitiveness and key competitor positions
Market presence across multiple geographical footprints - Strong/Active/Niche/Trivial -
buy the report!
Acute Ischemic Stroke Therapeutics Market - Segmentation Assessment
Segment Overview
This report extensively covers market segmentation by type (thrombolytics, anticoagulants, antiplatelets, and antihypertensives), distribution channel (Hospital pharmacies, retail pharmacies, and online pharmacies), and geography (North America, Europe, Asia, and Rest of World (ROW)).
The
thrombolytics segment is estimated to be significant for the global market's growth during the forecast period. One of the factors behind the growth of this segment is the availability of US FDA-approved therapeutic treatments for AIS. For instance, the IV alteplase drug is sold under the brand name Activase. It is a tissue plasminogen activator and is used for multiple indications such as AIS, acute myocardial infarction (AMI), and acute massive pulmonary embolism (PE).
Insights on the market contribution of various segments, including country and region wise historic data (2017 to 2021), and forecast market size (2023 to 2027) - Download a Sample Report
Acute Ischemic Stroke Therapeutics Market –
Market Dynamics
Key factor driving market growth
High-risk factors, such as obesity, atherosclerosis, hypertension, and old age drive the acute ischemic stroke (AIS) therapeutics market growth.
It is estimated that one-third of people, who had an untreated transient ischemic attack, suffered a major stroke within a year.
Hence, high-risk factors, such as obesity, atherosclerosis, hypertension, and old age, are the major contributors to the growth of the segment during the forecast period.
Leading trends influencing the market
It is a complex cardiac disease that requires the integration of various heterogeneous features originating from genotypic, phenotypic, and environmental sources.
Also, TBI is a computational technology that focuses on integrating and analyzing data obtained from bioinformatics, biostatics, statistical genetics, and clinical informatics.
Major challenges hindering the market growth
Unmet needs for anticoagulant reversal agents challenge the market growth during the forecast period.
Even though anticoagulants play an important role in treating AIS, they are sometimes associated with side effects such as excessive bleeding.
Additionally, the antidotes available in the market include vitamin K, protamine, and prothrombin complex concentrates, which reverse the action of warfarin and heparin. Direct thrombin inhibitorsthrombin inhibitors or Factor Xa inhibitorsFactor Xa inhibitors, do not have any specific reversal agents.
Hence, such challenges impede market growth during the forecast period.
Insights on Market Drivers, trends, & Challenges, historic period(2017 to 2021), and forecast period(2023 to 2027)- Request a sample report!
What are the key data covered in this Acute Ischemic Stroke Therapeutics Market report?
CAGR of the market during the forecast period
Detailed information on factors that will drive the growth of the acute ischemic stroke therapeutics market between 2023 and 2027
Precise estimation of the size of the acute ischemic stroke therapeutics market and its contribution to the market with a focus on the parent market
Accurate predictions about upcoming trends and changes in consumer behavior
Growth of the acute ischemic stroke therapeutics market across North America, Europe, Asia, and Rest of World (ROW)
A thorough analysis of the market's competitive landscape and detailed information about vendors
Comprehensive analysis of factors that will challenge the growth of acute ischemic stroke therapeutics market vendors
Gain instant access to 17,000+ market research reports.
Technavio's SUBSCRIPTION platform
Related Reports:
The
gastrointestinal stromal tumors therapeutics market size is expected to increase by USD 1.08 billion from 2021 to 2026, and the market's growth momentum will accelerate at a CAGR of 5.97%. Furthermore, this report extensively covers the gastrointestinal stromal tumors therapeutics market segmentation by route of administration (oral and parenteral) and geography (North America, Europe, Asia, and the Rest of the World (ROW)). The growing geriatric population is one of the key factors driving the gastrointestinal stromal tumors therapeutics (GIST) market growth.
The
Alzheimer's disease therapeutics market is estimated to grow at a CAGR of 8.91% between 2022 and 2027. The size of the market is forecast to increase by USD 4,391.9 million. This report extensively covers market segmentation by drug class (cholinesterase inhibitorscholinesterase inhibitors, n-methyl-d-aspartate receptor antagonist, and others), distribution channel (hospital pharmacy, retail pharmacy, and e-commerce pharmacy), and geography (North America, Europe, Asia, and Rest of World). The increasing awareness of Alzheimer's disease is notably driving the market growth.
Table of Contents
1 Executive Summary
1.1 Market overview
Exhibit 01: Executive Summary – Chart on Market Overview
Exhibit 02: Executive Summary – Data Table on Market Overview
Exhibit 03: Executive Summary – Chart on Global Market Characteristics
Exhibit 04: Executive Summary – Chart on Market by Geography
Exhibit 05: Executive Summary – Chart on Market Segmentation by Type
Exhibit 06: Executive Summary – Chart on Market Segmentation by Distribution Channel
Exhibit 07: Executive Summary – Chart on Incremental Growth
Exhibit 08: Executive Summary – Data Table on Incremental Growth
Exhibit 09: Executive Summary – Chart on Vendor Market Positioning
2 Market Landscape
2.1 Market ecosystem
Exhibit 10: Parent market
Exhibit 11: Market Characteristics
3 Market Sizing
3.1 Market definition
Exhibit 12: Offerings of vendors included in the market definition
3.2 Market segment analysis
Exhibit 13: Market segments
3.3 Market size 2022
3.4 Market outlook: Forecast for 2022-2027
Exhibit 14: Chart on Global - Market size and forecast 2022-2027 ($ million)
Exhibit 15: Data Table on Global - Market size and forecast 2022-2027 ($ million)
Exhibit 16: Chart on Global Market: Year-over-year growth 2022-2027 (%)
Exhibit 17: Data Table on Global Market: Year-over-year growth 2022-2027 (%)
4 Five Forces Analysis
4.1 Five forces summary
Exhibit 18: Five forces analysis - Comparison between 2022 and 2027
4.2 Bargaining power of buyers
Exhibit 19: Chart on Bargaining power of buyers – Impact of key factors 2022 and 2027
4.3 Bargaining power of suppliers
Exhibit 20: Bargaining power of suppliers – Impact of key factors in 2022 and 2027
4.4 Threat of new entrants
Exhibit 21: Threat of new entrants – Impact of key factors in 2022 and 2027
4.5 Threat of substitutes
Exhibit 22: Threat of substitutes – Impact of key factors in 2022 and 2027
4.6 Threat of rivalry
Exhibit 23: Threat of rivalry – Impact of key factors in 2022 and 2027
4.7 Market condition
Exhibit 24: Chart on Market condition - Five forces 2022 and 2027
5 Market Segmentation by Type
5.1 Market segments
Exhibit 25: Chart on Type - Market share 2022-2027 (%)
Exhibit 26: Data Table on Type - Market share 2022-2027 (%)
5.2 Comparison by Type
Exhibit 27: Chart on Comparison by Type
Exhibit 28: Data Table on Comparison by Type
5.3 Thrombolytics - Market size and forecast 2022-2027
Exhibit 29: Chart on Thrombolytics - Market size and forecast 2022-2027 ($ million)
Exhibit 30: Data Table on Thrombolytics - Market size and forecast 2022-2027 ($ million)
Exhibit 31: Chart on Thrombolytics - Year-over-year growth 2022-2027 (%)
Exhibit 32: Data Table on Thrombolytics - Year-over-year growth 2022-2027 (%)
5.4 Anticoagulants - Market size and forecast 2022-2027
Exhibit 33: Chart on Anticoagulants - Market size and forecast 2022-2027 ($ million)
Exhibit 34: Data Table on Anticoagulants - Market size and forecast 2022-2027 ($ million)
Exhibit 35: Chart on Anticoagulants - Year-over-year growth 2022-2027 (%)
Exhibit 36: Data Table on Anticoagulants - Year-over-year growth 2022-2027 (%)
5.5 Antiplatelets - Market size and forecast 2022-2027
Exhibit 37: Chart on Antiplatelets - Market size and forecast 2022-2027 ($ million)
Exhibit 38: Data Table on Antiplatelets - Market size and forecast 2022-2027 ($ million)
Exhibit 39: Chart on Antiplatelets - Year-over-year growth 2022-2027 (%)
Exhibit 40: Data Table on Antiplatelets - Year-over-year growth 2022-2027 (%)
5.6 Antihypertensives - Market size and forecast 2022-2027
Exhibit 41: Chart on Antihypertensives - Market size and forecast 2022-2027 ($ million)
Exhibit 42: Data Table on Antihypertensives - Market size and forecast 2022-2027 ($ million)
Exhibit 43: Chart on Antihypertensives - Year-over-year growth 2022-2027 (%)
Exhibit 44: Data Table on Antihypertensives - Year-over-year growth 2022-2027 (%)
5.7 Other therapeutics - Market size and forecast 2022-2027
Exhibit 45: Chart on Other therapeutics - Market size and forecast 2022-2027 ($ million)
Exhibit 46: Data Table on Other therapeutics - Market size and forecast 2022-2027 ($ million)
Exhibit 47: Chart on Other therapeutics - Year-over-year growth 2022-2027 (%)
Exhibit 48: Data Table on Other therapeutics - Year-over-year growth 2022-2027 (%)
5.8 Market opportunity by Type
Exhibit 49: Market opportunity by Type ($ million)
6 Market Segmentation by Distribution Channel
6.1 Market segments
Exhibit 50: Chart on Distribution Channel - Market share 2022-2027 (%)
Exhibit 51: Data Table on Distribution Channel - Market share 2022-2027 (%)
6.2 Comparison by Distribution Channel
Exhibit 52: Chart on Comparison by Distribution Channel
Exhibit 53: Data Table on Comparison by Distribution Channel
6.3 Hospital pharmacies - Market size and forecast 2022-2027
Exhibit 54: Chart on Hospital pharmacies - Market size and forecast 2022-2027 ($ million)
Exhibit 55: Data Table on Hospital pharmacies - Market size and forecast 2022-2027 ($ million)
Exhibit 56: Chart on Hospital pharmacies - Year-over-year growth 2022-2027 (%)
Exhibit 57: Data Table on Hospital pharmacies - Year-over-year growth 2022-2027 (%)
6.4 Retail pharmacies - Market size and forecast 2022-2027
Exhibit 58: Chart on Retail pharmacies - Market size and forecast 2022-2027 ($ million)
Exhibit 59: Data Table on Retail pharmacies - Market size and forecast 2022-2027 ($ million)
Exhibit 60: Chart on Retail pharmacies - Year-over-year growth 2022-2027 (%)
Exhibit 61: Data Table on Retail pharmacies - Year-over-year growth 2022-2027 (%)
6.5 Online pharmacies - Market size and forecast 2022-2027
Exhibit 62: Chart on Online pharmacies - Market size and forecast 2022-2027 ($ million)
Exhibit 63: Data Table on Online pharmacies - Market size and forecast 2022-2027 ($ million)
Exhibit 64: Chart on Online pharmacies - Year-over-year growth 2022-2027 (%)
Exhibit 65: Data Table on Online pharmacies - Year-over-year growth 2022-2027 (%)
6.6 Market opportunity by Distribution Channel
Exhibit 66: Market opportunity by Distribution Channel ($ million)
7 Customer Landscape
7.1 Customer landscape overview
Exhibit 67: Analysis of price sensitivity, lifecycle, customer purchase basket, adoption rates, and purchase criteria
8 Geographic Landscape
8.1 Geographic segmentation
Exhibit 68: Chart on Market share by geography 2022-2027 (%)
Exhibit 69: Data Table on Market share by geography 2022-2027 (%)
8.2 Geographic comparison
Exhibit 70: Chart on Geographic comparison
Exhibit 71: Data Table on Geographic comparison
8.3 North America - Market size and forecast 2022-2027
Exhibit 72: Chart on North America - Market size and forecast 2022-2027 ($ million)
Exhibit 73: Data Table on North America - Market size and forecast 2022-2027 ($ million)
Exhibit 74: Chart on North America - Year-over-year growth 2022-2027 (%)
Exhibit 75: Data Table on North America - Year-over-year growth 2022-2027 (%)
8.4 Europe - Market size and forecast 2022-2027
Exhibit 76: Chart on Europe - Market size and forecast 2022-2027 ($ million)
Exhibit 77: Data Table on Europe - Market size and forecast 2022-2027 ($ million)
Exhibit 78: Chart on Europe - Year-over-year growth 2022-2027 (%)
Exhibit 79: Data Table on Europe - Year-over-year growth 2022-2027 (%)
8.5 Asia - Market size and forecast 2022-2027
Exhibit 80: Chart on Asia - Market size and forecast 2022-2027 ($ million)
Exhibit 81: Data Table on Asia - Market size and forecast 2022-2027 ($ million)
Exhibit 82: Chart on Asia - Year-over-year growth 2022-2027 (%)
Exhibit 83: Data Table on Asia - Year-over-year growth 2022-2027 (%)
8.6 Rest of World (ROW) - Market size and forecast 2022-2027
Exhibit 84: Chart on Rest of World (ROW) - Market size and forecast 2022-2027 ($ million)
Exhibit 85: Data Table on Rest of World (ROW) - Market size and forecast 2022-2027 ($ million)
Exhibit 86: Chart on Rest of World (ROW) - Year-over-year growth 2022-2027 (%)
Exhibit 87: Data Table on Rest of World (ROW) - Year-over-year growth 2022-2027 (%)
8.7 US - Market size and forecast 2022-2027
Exhibit 88: Chart on US - Market size and forecast 2022-2027 ($ million)
Exhibit 89: Data Table on US - Market size and forecast 2022-2027 ($ million)
Exhibit 90: Chart on US - Year-over-year growth 2022-2027 (%)
Exhibit 91: Data Table on US - Year-over-year growth 2022-2027 (%)
8.8 UK - Market size and forecast 2022-2027
Exhibit 92: Chart on UK - Market size and forecast 2022-2027 ($ million)
Exhibit 93: Data Table on UK - Market size and forecast 2022-2027 ($ million)
Exhibit 94: Chart on UK - Year-over-year growth 2022-2027 (%)
Exhibit 95: Data Table on UK - Year-over-year growth 2022-2027 (%)
8.9 Germany - Market size and forecast 2022-2027
Exhibit 96: Chart on Germany - Market size and forecast 2022-2027 ($ million)
Exhibit 97: Data Table on Germany - Market size and forecast 2022-2027 ($ million)
Exhibit 98: Chart on Germany - Year-over-year growth 2022-2027 (%)
Exhibit 99: Data Table on Germany - Year-over-year growth 2022-2027 (%)
8.10 China - Market size and forecast 2022-2027
Exhibit 100: Chart on China - Market size and forecast 2022-2027 ($ million)
Exhibit 101: Data Table on China - Market size and forecast 2022-2027 ($ million)
Exhibit 102: Chart on China - Year-over-year growth 2022-2027 (%)
Exhibit 103: Data Table on China - Year-over-year growth 2022-2027 (%)
8.11 Canada - Market size and forecast 2022-2027
Exhibit 104: Chart on Canada - Market size and forecast 2022-2027 ($ million)
Exhibit 105: Data Table on Canada - Market size and forecast 2022-2027 ($ million)
Exhibit 106: Chart on Canada - Year-over-year growth 2022-2027 (%)
Exhibit 107: Data Table on Canada - Year-over-year growth 2022-2027 (%)
8.12 Market opportunity by geography
Exhibit 108: Market opportunity by geography ($ million)
9 Drivers, Challenges, and Trends
9.1 Market drivers
9.2 Market challenges
9.3 Impact of drivers and challenges
Exhibit 109: Impact of drivers and challenges in 2022 and 2027
9.4 Market trends
10 Vendor Landscape
10.1 Overview
10.2 Vendor landscape
Exhibit 110: Overview on Criticality of inputs and Factors of differentiation
10.3 Landscape disruption
Exhibit 111: Overview on factors of disruption
10.4 Industry risks
Exhibit 112: Impact of key risks on business
11 Vendor Analysis
11.1 Vendors covered
Exhibit 113: Vendors covered
11.2 Market positioning of vendors
Exhibit 114: Matrix on vendor position and classification
11.3 Amgen Inc.
Exhibit 115: Amgen Inc. - Overview
Exhibit 116: Amgen Inc. - Product / Service
Exhibit 117: Amgen Inc. - Key offerings
11.4 AstraZeneca Plc
Exhibit 118: AstraZeneca Plc - Overview
Exhibit 119: AstraZeneca Plc - Product / Service
Exhibit 120: AstraZeneca Plc - Key news
Exhibit 121: AstraZeneca Plc - Key offerings
11.5 Athersys Inc.
Exhibit 122: Athersys Inc. - Overview
Exhibit 123: Athersys Inc. - Product / Service
Exhibit 124: Athersys Inc. - Key offerings
11.6 Bayer AG
Exhibit 125: Bayer AG - Overview
Exhibit 126: Bayer AG - Business segments
Exhibit 127: Bayer AG - Key offerings
Exhibit 128: Bayer AG - Segment focus
11.7 Biogen Inc.
Exhibit 129: Biogen Inc. - Overview
Exhibit 130: Biogen Inc. - Product / Service
Exhibit 131: Biogen Inc. - Key offerings
Exhibit 132: Boehringer Ingelheim International GmbH - Overview
Exhibit 133: Boehringer Ingelheim International GmbH - Business segments
Exhibit 134: Boehringer Ingelheim International GmbH - Key news
Exhibit 135: Boehringer Ingelheim International GmbH - Key offerings
Exhibit 136: Boehringer Ingelheim International GmbH - Segment focus
Exhibit 137: Bristol Myers Squibb Co. - Overview
Exhibit 138: Bristol Myers Squibb Co. - Product / Service
Exhibit 139: Bristol Myers Squibb Co. - Key offerings
11.10 Daiichi Sankyo Co. Ltd.
Exhibit 140: Daiichi Sankyo Co. Ltd. - Overview
Exhibit 141: Daiichi Sankyo Co. Ltd. - Business segments
Exhibit 142: Daiichi Sankyo Co. Ltd. - Key news
Exhibit 143: Daiichi Sankyo Co. Ltd. - Key offerings
Exhibit 144: Daiichi Sankyo Co. Ltd. - Segment focus
Exhibit 145: F. Hoffmann La Roche Ltd. - Overview
Exhibit 146: F. Hoffmann La Roche Ltd. - Business segments
Exhibit 147: F. Hoffmann La Roche Ltd. - Key news
Exhibit 148: F. Hoffmann La Roche Ltd. - Key offerings
Exhibit 149: F. Hoffmann La Roche Ltd. - Segment focus
11.12 Johnson and Johnson
Exhibit 150: Johnson and Johnson - Overview
Exhibit 151: Johnson and Johnson - Business segments
Exhibit 152: Johnson and Johnson - Key news
Exhibit 153: Johnson and Johnson - Key offerings
Exhibit 154: Johnson and Johnson - Segment focus
11.13 Medtronic Plc
Exhibit 155: Medtronic Plc - Overview
Exhibit 156: Medtronic Plc - Business segments
Exhibit 157: Medtronic Plc - Key news
Exhibit 158: Medtronic Plc - Key offerings
Exhibit 159: Medtronic Plc - Segment focus
11.14 Merck and Co. Inc.
Exhibit 160: Merck and Co. Inc. - Overview
Exhibit 161: Merck and Co. Inc. - Business segments
Exhibit 162: Merck and Co. Inc. - Key news
Exhibit 163: Merck and Co. Inc. - Key offerings
Exhibit 164: Merck and Co. Inc. - Segment focus
11.15 Pfizer Inc.
Exhibit 165: Pfizer Inc. - Overview
Exhibit 166: Pfizer Inc. - Product / Service
Exhibit 167: Pfizer Inc. - Key news
Exhibit 168: Pfizer Inc. - Key offerings
11.16 Sanofi SA
Exhibit 169: Sanofi SA - Overview
Exhibit 170: Sanofi SA - Business segments
Exhibit 171: Sanofi SA - Key news
Exhibit 172: Sanofi SA - Key offerings
Exhibit 173: Sanofi SA - Segment focus
Exhibit 174: Teva Pharmaceutical Industries Ltd. - Overview
Exhibit 175: Teva Pharmaceutical Industries Ltd. - Business segments
Exhibit 176: Teva Pharmaceutical Industries Ltd. - Key news
Exhibit 177: Teva Pharmaceutical Industries Ltd. - Key offerings
Exhibit 178: Teva Pharmaceutical Industries Ltd. - Segment focus
12 Appendix
12.1 Scope of the report
12.2 Inclusions and exclusions checklist
Exhibit 179: Inclusions checklist
Exhibit 180: Exclusions checklist
12.3 Currency conversion rates for US$
Exhibit 181: Currency conversion rates for US$
12.4 Research methodology
Exhibit 182: Research methodology
Exhibit 183: Validation techniques employed for market sizing
Exhibit 184: Information sources
12.5 List of abbreviations
Exhibit 185: List of abbreviations
About Us
Technavio is a leading global technology research and advisory company. Their research and analysis focus on emerging market trends and provide actionable insights to help businesses identify market opportunities and develop effective strategies to optimize their market positions. With over 500 specialized analysts, Technavio's report library consists of more than 17,000 reports and counting, covering 800 technologies, spanning 50 countries. Their client base consists of enterprises of all sizes, including more than 100 Fortune 500 companies. This growing client base relies on Technavio's comprehensive coverage, extensive research, and actionable market insights to identify opportunities in existing and potential markets and assess their competitive positions within changing market scenarios.
Contact
Technavio Research
Jesse Maida
Media & Marketing Executive
US: +1 844 364 1100
UK: +44 203 893 3200
Email: [email protected]
Website: www.technavio.com
SOURCE Technavio
For more details,please visit the original website
The content of the article does not represent any opinions of Synapse and its affiliated companies. If there is any copyright infringement or error, please contact us, and we will deal with it within 24 hours.
Organizations
Indications
Drugs
Hot reports


Get started for free today!
Accelerate Strategic R&D decision making with Synapse, PatSnap’s AI-powered Connected Innovation Intelligence Platform Built for Life Sciences Professionals.
Start your data trial now!
Synapse data is also accessible to external entities via APIs or data packages. Leverages most recent intelligence information, enabling fullest potential.